Impact Factor ISSN: 1449-1907
- Issue 8; 2026
- Issue 7; 2026
- Issue 6; 2026
- Issue 5; 2026
- Issue 4; 2026
- Volume 23; 2026
- Past Issues
- Editorial Board
- Cover Images
- Index & Coverage
- Cover Suggestion
- Special Issues
Introduction
Materials and Methods
Results
Discussion
Conclusions
Supplementary Material
Acknowledgements
References

 Global reach, higher impact
Int J Med Sci 2026; 23(6):2072-2080. doi:10.7150/ijms.129021 This issue Cite
Research Paper
The association between air pollutants and mild cognitive impairment in Taiwanese elderly
Sui-Lung Su1, Yue-Ting Lin1, Chih-Hong Pan1,2, Meng-Chang Lee1, Yu-Hsuan Chen3, Hsiao-Ting Lin3, Hao Su4, Wei-Teing Chen5,6,7 ![]()
1. Graduate Institute of Public Health, College of Public Health, National Defense Medical University, Taipei, Taiwan.
2. Institute of Labor, Occupational Safety and Health, Ministry of Labor, New Taipei City, Taiwan.
3. School of Public Health, College of Public Health, National Defense Medical University, Taipei, Taiwan.
4. Graduate Institute of Medical Sciences, College of Medicine, National Defense Medical University, Taipei, Taiwan.
5. Division of Thoracic Medicine, Department of Medicine, Cheng Hsin General Hospital, Taipei, Taiwan.
6. Division of Thoracic Medicine, Department of Medicine, Tri-Service General Hospital, National Defense Medical University, Taipei, Taiwan.
7. School of Medicine, College of Medicine, National Defense Medical University, Taipei, Taiwan.
Received 2025-11-26; Accepted 2026-4-17; Published 2026-5-1
Abstract

Background: Mild cognitive impairment (MCI) is considered a prodromal stage of dementia, and cognitive decline is generally challenging to reverse. Recently, air pollution has been identified as a risk factor for cognitive impairment, making the exploration of this association an essential research topic. However, nationwide studies investigating the relationship between air pollution and MCI are still lacking.
Objective: This study aimed to investigate the association between air pollution and MCI in Taiwan.
Methods: This cross-sectional study utilized data from the Taiwan Biobank, retrieved elderly participants aged above 60, between 2008 and 2021. The study collected demographic data and cognitive function assessments using the Mini-Mental State Examination (MMSE) scale. MCI was defined by cut-off scores of 18, 21, and 25 according to educational levels. Google Map was used to locate the nearest air quality monitoring station from the residential address of participants. Individual daily average exposure concentrations of PM2.5, PM10, SO2, O3, CO, and NO2 were sourced from the air quality monitoring station of Environmental Protection Administration (EPA) between 1993 and 2021. Regression models were employed to identify factors associated with MCI in Taiwan.
Results: This study contains 4,173 cases with MCI and 31,022 controls, representing an MCI prevalence of 11.9%. The individual daily average exposure concentrations of PM2.5, PM10, O3, CO, SO2 and NO2 are 30.70±8.38 μg/m3, 59.25±15.81 μg/m3, 25.96±3.08 ppb, 0.65±0.42 ppm, 4.97±2.59 ppb and 20.22±5.09 ppb, respectively. Tertiles of pollution exposure in regression models show that higher exposure to PM2.5 and SO2 are associated with a higher risk of MCI compared to that of lower exposure levels (OR = 1.23, 95% CI: 1.11-1.37; OR = 1.20, 95% CI: 1.07-1.34). Furthermore, concurrent exposure to the highest tertiles (T3) of both PM2.5 and SO2 increased the risk of MCI to 2.33 (95% CI: 1.56-3.48).
Conclusions: We found evidence of the effect of PM2.5 and SO2 on MCI among elderly individuals in Taiwan. Moreover, the association between PM2.5 and MCI risk escalated with higher SO2 concentrations, demonstrating a synergistic interaction between the two pollutants. This discovery may provide evidence for policy of MCI prevention.
Keywords: mild cognitive impairment (MCI), air pollutants, mini-mental state examination (MMSE)
Introduction
With the rapid aging of the global population, the proportion of elderly people is expected to increase from 12% to 22% [1]. In Taiwan, the elderly population is projected to reach 39.3% by 2060, making it the second-highest in the world [2]. Research shows that over 20% of the elderly suffer from neurological diseases, with dementia and cognitive impairment being the most common among them [1]. A previous survey in Taiwan (2011-2013) reported that the age- and sex-adjusted prevalence of overall dementia and mild cognitive impairment (MCI) in older adults were 8.13% and 18.78%, respectively [3], which is higher than the prevalence observed in East Asia (4.98-6.99% in 2015) [4].
Dementia is a neurodegenerative disease that severely impacts an individual's ability to perform daily activities independently, causing a heavy burden on caregivers [5, 6]. MCI is considered a precursor to dementia, with about 5-10% of MCI individuals progressing to dementia each year [7, 8]. As dementia is currently incurable and cognitive decline is difficult to reverse, identifying risk factors for MCI is crucial. The risk factors for cognitive decline include age, gender, education level, medical history, genetics, lifestyle, and environmental factors [9-12]. Among these, the relationship between air pollutants and MCI is an important issue in public health. Air pollutants such as particulate matter (PM), nitrogen oxides, and ozone are powerful oxidants that can reach the brain, causing oxidative stress and neuroinflammation, which can affect the central nervous system [13, 14]. Previous studies have shown that long-term exposure to particulate pollutants can lead to amyloid beta deposition in the brain, and exposure to PM2.5 and PM10 increases the risk of developing MCI [15, 16]. Moreover, studies have also found that exposure to sulfur dioxide (SO2) causes synaptic dysfunction in the hippocampus, impairing memory in animal models [17]. Since nationwide studies investigating the relationship between air pollution and MCI are still lacking, this study aimed to examine the association between air pollution and MCI in Taiwan.
Materials and Methods
Study population
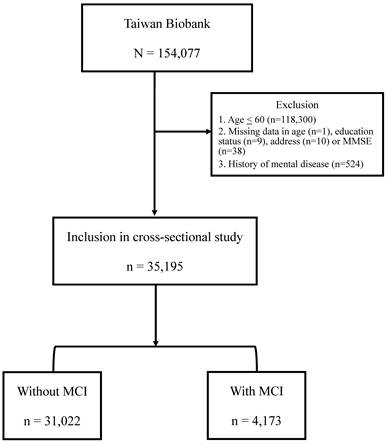
The Taiwan Biobank (TWB) was established with the purpose of collecting genomic and lifestyle data from Taiwanese residents, and it is currently the largest biobank in Taiwan supported by the government [18]. The TWB consists of data from community-based volunteers between the ages of 20 and 70. Prior to participation, all participants provided informed consent, donated blood samples, and underwent physical examinations. Various measurements such as body height, weight, and body mass index (BMI) (kg/m2) were recorded. Additionally, participants were interviewed face-to-face by TWB researchers and asked to complete questionnaires regarding personal and lifestyle factors. The data analysis for this study utilized the questionnaire survey data and relevant physical examination measurements of 154,077 participants from the Taiwan Biobank, collected between 2008 and 2021. After excluding individuals below the age of 60 or history of mental disease, as well as those with incomplete information regarding age, place of residence, Mini-Mental State Examination (MMSE), and education level, a total of 35,195 participants was included in the study. The flow chart was shown in Figure 1.
Flow chart. A total of 154,077 participants were analyzed using data from the TWB database. The exclusion criteria are individuals below the age of 60 (n = 118,300), those with incomplete information regarding age (n=1), education status (n=9), address (n=10) or MMSE (n=38), and history of mental disease (n = 524). The 35,195 subjects were recruited in the study, including of 4,173 subjects with MCI and 31,022 subjects without MCI.
Collection of demographic and medical data
Basic information about subjects were retrieved from TWB questionnaire, containing age, gender, education level, marital status, monthly income, residence, BMI, exercise habits, smoking, alcohol, hypertension, stroke, diabetes and depression.
Assessment of mild cognitive impairment
Cognitive impairment was assessed by MMSE, including six domains: visuospatial, language, concentration, working memory, memory recall, and orientation [19]. The scores of MMSE ranges from 0 to 30, and higher scores indicate better cognitive function. The cut-off scores for MCI were defined as scores ≤ 18 for illiterates, ≤ 21 for participants with primary school education, and ≤ 25 for those with junior high school degree or above [20]. The 35,195 subjects were recruited in the study, including of 4,173 subjects with MCI and 31,022 subjects without MCI.
Assessment of air pollutants
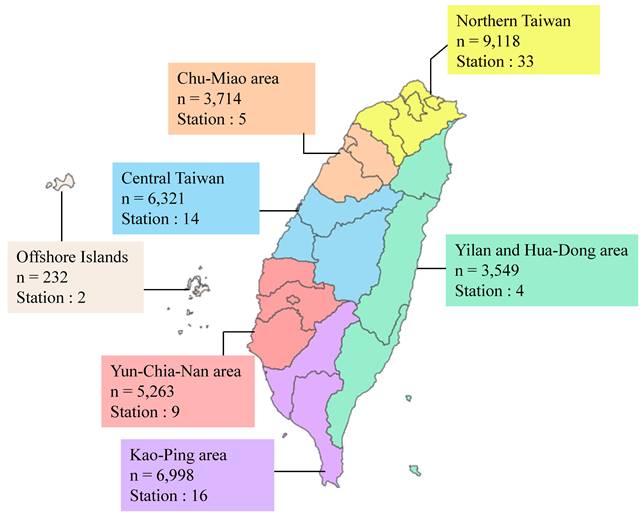
This study collected air pollution concentration data from 83 monitoring stations provided by the Environmental Protection Administration (EPA) and the Environmental Protection Bureaus of five cities, including Taipei City, New Taipei City, Taoyuan City, Taichung City, and Kaohsiung City [21-26]. Seven Air Quality Zones (AQZs) classified by the EPA: northern Taiwan (NT), the Chu-Miao (CM) area, central Taiwan (CT), the Yun-Chia-Nan (YCN) area, the Kao-Ping (KP) area, the Hua-Dong (HD) area, Yilan (YI), and the Offshore Islands [21]. The distribution of participants and monitoring stations across these AQZs is shown in Figure 2.
Participant numbers and monitoring station distribution map for air quality zones in Taiwan. Northern Taiwan includes a population of 9,118 individuals with 33 monitoring stations. The Chu-Miao area has a population of 3,714 individuals and 5 monitoring stations. Central Taiwan includes a population of 6,321 individuals with 14 monitoring stations. The Yun-Chia-Nan area has a population of 5,263 individuals and 9 monitoring stations. The Kao-Ping area has a population of 6,998 individuals with 16 monitoring stations. The Yilan and Hua-Dong area includes a population of 3,549 individuals with 4 monitoring stations. Lastly, the Offshore Islands include a population of 232 individuals and 2 monitoring stations.
The residential address of each participant was used to estimate exposure to outdoor air pollution. The average concentrations of air pollutants, including particulate matter with an aerodynamic diameter of ≤ 2.5 μm (PM2.5), particulate matter with an aerodynamic diameter of ≤ 10 μm (PM10), ozone (O3), carbon monoxide (CO), sulfur dioxide (SO2), and nitrogen dioxide (NO2) were calculated for each year. Average yearly data were determined in two steps: (1) obtaining the geographic coordinates (latitude and longitude) of the administrative district center of each participant's residential area and the monitoring station addresses from government open data platforms, the EPA, and the Environmental Protection Bureaus, and (2) using Google Maps to locate the nearest air quality monitoring station to each participant's residential administrative district as the data source. The participant's yearly average exposure concentrations of PM10, SO2, O3, NO2, CO were estimated from 1993 to the year of MMSE assessment. Since PM2.5 data were unavailable until 2005, the participant's yearly average exposure concentrations of PM2.5 was estimated from 2005 to the year of MMSE assessment [21].
Statistical analysis
Data were expressed as mean ± standard deviation or frequency (%) and tertile for air pollutants concentration. Differences between groups were analyzed using the chi-square test for categorical variables and the independent t test for continuous variables. Logistic regression analysis was used to identify associations between each air pollutant and MMSE through three adjustment models. Model 1 was adjusted for gender, age, stroke, monthly income, BMI, exercise habits, marital status, smoking, alcohol, hypertension, and diabetes. Education level was excluded as a covariate because it was used to define MMSE cut-off scores, preventing over-adjustment bias. Model 2 was a multi-pollutant model that further adjusted for co-pollutants to account for the simultaneous exposure to multiple air pollutants. Model 3 further incorporated an interaction term between PM2.5 and SO2 (PM2.5 × SO2) into the multi-pollutant model to evaluate potential synergistic effects on the risk of MCI (Table S2). Furthermore, a sensitivity analysis was conducted by including depression as an additional covariate in the final logistic regression models to evaluate the robustness of our findings. This study considered a p value of < 0.05 as significant for all analyses. All analyses were performed using SPSS 25.0.
Ethics statement
The study protocol followed the guidelines for human studies and was conducted ethically in accordance with the World Medical Association Declaration of Helsinki. The study was approved by the Institutional Review Board of the Tri-Service General Hospital (TSGH), a medical teaching hospital of the National Defense Medical University in Taipei, Taiwan (approval number: TSGH-2-107-05-091, approval date: 29 June 2018).
Results
Demographic data
The demographic characteristics of the study participants are shown in Table 1. The study included a total of 35,195 individuals, 39% of whom are male. The overall mean age is 64.19 ± 3.22 years old. Among participants without mild cognitive impairment (MCI) are 64.14 ± 3.17 years old. In contrast, participants with MCI exhibited a slightly higher mean age of 64.58 ± 3.54 years old. Significant differences are observed between the MCI and without MCI groups. The MCI group is characterized by older age (p < 0.001), lower educational level (p < 0.001), less married (p < 0.001), lower income (p < 0.001), higher body mass index (BMI) (p < 0.001), less exercise habits (p < 0.001), more smoking (p = 0.008), hypertension (p < 0.001), stroke (p < 0.001), and diabetes (p < 0.001).
Demographic data
| Variable | Total (n=35,195) | Without MCI (n = 31,022) | With MCI (n = 4,173) | P-value |
|---|---|---|---|---|
| Male | 13724 (39.0%) | 12114 (39.0%) | 1610 (38.6%) | 0.560 |
| Age | 64.19±3.22 | 64.14±3.17 | 64.58±3.54 | < 0.001* |
| 60-75 | 34936 (99.3%) | 30820 (99.3%) | 4116 (98.6%) | < 0.001* |
| > 75 | 259 (0.7%) | 202 (0.7%) | 57 (1.4%) | |
| Education | < 0.001* | |||
| illiterate | 247 (0.7%) | 152 (0.5%) | 95 (2.3%) | |
| primary school | 5065 (14.4%) | 4395 (14.2%) | 670 (16.1%) | |
| junior high school or above | 29883 (84.9%) | 26475 (85.3%) | 3408 (81.7%) | |
| Married/Cohabitant | 27151 (77.2%) | 24051 (77.6%) | 3100 (74.4%) | < 0.001* |
| Monthly income >100,000 NTD | 1510 (7.6%) | 1414 (8.0%) | 96 (4.3%) | < 0.001* |
| BMI | < 0.001* | |||
| < 18.5 kg/m2 | 819 (2.3%) | 744 (2.4%) | 75 (1.8%) | |
| 18.5≤X < 24 kg/m2 | 16443 (46.7%) | 14661 (47.3%) | 1782 (42.8%) | |
| 24≤X < 27 kg/m2 | 11034(31.4%) | 9689 (31.2%) | 1345 (32.3%) | |
| ≥ 27 kg/m2 | 6879 (19.6%) | 5916 (19.1%) | 963 (23.1%) | |
| Exercise habits | 16910 (48.1%) | 15047 (48.5%) | 1863 (44.6%) | < 0.001* |
| Smoking | 4763 (14.4%) | 4138 (14.2%) | 625 (15.8%) | 0.008* |
| Alcohol | 3249 (9.2%) | 2851 (9.2%) | 398 (9.6%) | 0.459 |
| Hypertension | 8930 (25.4%) | 7722 (24.9%) | 1208 (28.9%) | < 0.001* |
| Stroke | 492 (1.4%) | 398 (1.3%) | 94 (2.3%) | < 0.001* |
| Diabetes | 3938 (11.2%) | 3376 (10.9%) | 562 (13.5%) | < 0.001* |
| Depression | 1301 (3.7%) | 1137 (3.7%) | 164 (3.9%) | 0.395 |
*: P-value < 0.05
Estimation of air pollutants concentration among subjects with or without MCI
The estimation of air pollutants concentration among subjects with or without MCI are shown in Table 2. Participants with MCI are exposed to higher concentrations of PM2.5, PM10, and SO2, with mean levels of 31.30 ± 8.85 μg/m³, 59.98 ± 16.2 μg/m³, and 5.09 ± 2.71 ppb, respectively. The second tertiles (T2) or third tertiles (T3) have higher proportion of participants with MCI among PM2.5, PM10, O3, SO2, and NO2.
Estimation of air pollutants concentration among subjects with or without MCI
| Variable | Total (n = 35,195) | Without MCI (n = 31,022) | With MCI (n = 4,173) | P-value |
|---|---|---|---|---|
| Air pollutants | ||||
PM2.5 (μg/ ) ) | 30.70±8.38 | 30.62±8.32 | 31.30±8.85 | < 0.001* |
PM10 (μg/ ) ) | 59.25±15.8 | 59.15±15.8 | 59.98±16.2 | 0.002* |
| O3 (ppb) | 25.96±3.08 | 25.96±3.08 | 25.99±3.02 | 0.570 |
| CO (ppm) | 0.65±0.42 | 0.65±0.36 | 0.65±0.74 | 0.542 |
| SO2 (ppb) | 4.97±2.59 | 4.95±2.57 | 5.09±2.71 | 0.001* |
| NO2 (ppb) | 20.22±5.09 | 20.25±5.09 | 20.04±5.05 | 0.014* |
| PM2.5 tertile | < 0.001* | |||
T1 (≤ 26.53 μg/ ) ) | 11730 (33.3%) | 10394 (33.5%) | 1336 (32.0%) | |
T2 (26.54-34.86 μg/ ) ) | 11729 (33.3%) | 10448 (33.7%) | 1281 (30.7%) | |
T3 (> 34.87 μg/ ) ) | 11736 (33.3%) | 10180 (32.8%) | 1556 (37.3%) | |
| PM10 tertile | < 0.001* | |||
T1 (≤ 49.89 μg/ ) ) | 11731 (33.3%) | 10476 (33.8%) | 1255 (30.1%) | |
T2 (49.9-68.3 μg/ ) ) | 11730 (33.3%) | 10242 (33.0%) | 1488 (35.7%) | |
T3 (> 68.31 μg/ ) ) | 11734 (33.3%) | 10304 (33.2%) | 1430 (34.3%) | |
| O3 tertile | < 0.001* | |||
| T1 (≤ 24.59 ppb) | 11729 (33.3%) | 10361 (33.4%) | 1368 (32.8%) | |
| T2 (24.6-27.19 ppb) | 11732 (33.3%) | 10144 (32.7%) | 1588 (38.1%) | |
| T3 (> 27.2 ppb) | 11734 (33.3%) | 10517 (33.9%) | 1217 (29.2%) | |
| CO tertile | 0.001* | |||
| T1 (≤ 0.56 ppm) | 11724 (33.3%) | 10235 (33.0%) | 1489 (35.7%) | |
| T2 (0.57-0.68 ppm) | 11738 (33.4%) | 10365 (33.4%) | 1373 (32.9%) | |
| T3 (> 0.69 ppm) | 11733 (33.3%) | 10422 (33.6%) | 1311 (31.4%) | |
| SO2 tertile | < 0.001* | |||
| T1 (≤ 3.79 ppb) | 11729 (33.3%) | 10472 (33.8%) | 1257 (30.1%) | |
| T2 (3.8-5.49 ppb) | 11727 (33.3%) | 10268 (33.1%) | 1459 (35.0%) | |
| T3 (> 5.5 ppb) | 11739 (33.4%) | 10282 (33.1%) | 1457 (34.9%) | |
| NO2 tertile | 0.020* | |||
| T1 (≤ 18.75 ppb) | 11731 (33.3%) | 10349 (33.4%) | 1382 (33.1%) | |
| T2 (18.76-22.49 ppb) | 11729 (33.3%) | 10265 (33.1%) | 1464 (35.1%) | |
| T3 (> 22.5 ppb) | 11735 (33.3%) | 10408 (33.6%) | 1327 (31.8%) |
*: P-value<0.05
Distribution of demographic data according to tertile of estimation of air pollutants concentration
The distribution of demographic characteristics across tertiles of PM2.5, PM10, O3, SO2, CO, and NO2 concentrations are shown in Table 3. Significant differences in variables such as gender, age, stroke, monthly income, BMI, exercise habits, marital/cohabitation status, smoking, alcohol consumption, hypertension, and diabetes were observed among the three groups.
Distribution of demographic data according to tertile of estimation of air pollutants concentration
| Variable | PM2.5 (μg/m3) | PM10 (μg/m3) | O3 (ppb) | |||||||||
|---|---|---|---|---|---|---|---|---|---|---|---|---|
| T1 | T2 | T3 | P-value | T1 | T2 | T3 | P-value | T1 | T2 | T3 | P-value | |
| Male | 4554(38.8%) | 4566(38.9%) | 4604(39.2%) | 0.803 | 4539(38.7%) | 4563(38.9%) | 4622(39.4%) | 0.531 | 4427(37.7%) | 4659(39.7%) | 4638(39.5%) | 0.003* |
| Age | 64.46±3.50 | 64.15±3.11 | 63.96±3.00 | <0.001* | 64.34±3.42 | 64.19±3.15 | 64.03±3.06 | <0.001* | 64.25±3.28 | 64.14±3.20 | 64.17±3.18 | 0.028* |
| Education > 12 years | 5166(44.0%) | 4819(41.1%) | 4694(40.0%) | <0.001* | 5199(44.3%) | 4689(40.0%) | 4791(40.8%) | <0.001* | 6577(56.1%) | 7142(60.9%) | 6797(57.9%) | < 0.001* |
| Married/Cohabitant | 8878(75.7%) | 9055(77.3%) | 9218(78.6%) | <0.001* | 8912(76.0%) | 9064(77.3%) | 9175(78.2%) | <0.001* | 8907(76.1%) | 9073(77.4%) | 9171(78.2%) | < 0.001* |
| Monthly income > 100,000 NTD | 714(8.9%) | 431(7.5%) | 365(6.1%) | <0.001* | 644(9.4%) | 464(7.3%) | 402(6.1%) | <0.001* | 529(8.3%) | 514(7.7%) | 467(6.9%) | 0.009* |
| BMI | 0.183 | 0.076 | 0.001* | |||||||||
| < 18.5 kg/m2 | 265(2.3%) | 270(2.3%) | 284(2.4%) | 273(2.3%) | 262(2.2%) | 284(2.4%) | 280(2.4%) | 274(2.3%) | 265(2.3%) | |||
| 18.5≤X < 24 kg/m2 | 5459(46.6%) | 5449(46.5%) | 5535(47.2%) | 5502(46.9%) | 5395(46.0%) | 5546(47.3%) | 5638(48.1%) | 5334(45.5%) | 5471(46.7%) | |||
| 24≤X < 27 kg/m2 | 3625(30.9%) | 3704(31.6%) | 3705(31.6%) | 3591(30.6%) | 3771(32.2%) | 3672(31.3%) | 3644(31.1%) | 3721(31.7%) | 3669(31.3%) | |||
| ≥ 27 kg/m2 | 2374(20.3%) | 2299(19.6%) | 2206(18.8%) | 2359(20.1%) | 2295(19.6%) | 2225(19.0%) | 2159(18.4%) | 2398(20.4%) | 2322(19.8%) | |||
| Exercise habits | 5456(46.5%) | 5512(47.0%) | 5942(50.6%) | <0.001* | 5435(46.3%) | 5595(47.7%) | 5880(50.1%) | <0.001* | 5736(48.9%) | 5563(47.4%) | 5611(47.8%) | 0.060 |
| Smoking | 1620(14.7%) | 1618(14.7%) | 1525(13.7%) | 0.055 | 1610(14.6%) | 1636(14.9%) | 1517(13.7%) | 0.020* | 1534(13.9%) | 1638(14.9%) | 1591(14.3%) | 0.102 |
| Alcohol | 1132(9.7%) | 1076(9.2%) | 1041(8.9%) | 0.119 | 1127(9.6%) | 1094(9.3%) | 1028(8.8%) | 0.075 | 1013(8.6%) | 1156(9.9%) | 1080(9.2%) | 0.006* |
| Hypertension | 2932(25.0%) | 2969(25.3%) | 3029(25.8%) | 0.353 | 2909(24.8%) | 2985(25.4%) | 3036(25.9%) | 0.162 | 2920(24.9%) | 3005(25.6%) | 3005(25.6%) | 0.347 |
| Stroke | 187(1.6%) | 160(1.4%) | 145(1.2%) | 0.060 | 179(1.5%) | 165(1.4%) | 148(1.3%) | 0.224 | 154(1.3%) | 174(1.5%) | 164(1.4%) | 0.540 |
| Diabetes | 1297(11.1%) | 1271(10.8%) | 1370(11.7%) | 0.108 | 1275(10.9%) | 1273(10.9%) | 1390(11.8%) | 0.022* | 1232(10.5%) | 1351(11.5%) | 1355(11.5%) | 0.016* |
| Depression | 450(3.8%) | 413(3.5%) | 438(3.7%) | 0.428 | 425(3.6%) | 432(3.7%) | 444(3.8%) | 0.804 | 428(3.6%) | 464(4.0%) | 409(3.5%) | 0.154 |
| Variable | SO2 (ppb) | CO(ppm) | NO2(ppb) | |||||||||
| T1 | T2 | T3 | P-value | T1 | T2 | T3 | P-value | T1 | T2 | T3 | P-value | |
| Male | 4583(39.1%) | 4636(39.5%) | 4505(38.4%) | 0.188 | 4701(40.1%) | 4597(39.2%) | 4426(37.7%) | 0.001* | 4701(40.1%) | 4640(39.6%) | 4383(37.3%) | < 0.001* |
| Age | 64.42±3.44 | 64.08±3.14 | 64.06±3.05 | <0.001* | 64.19±3.31 | 64.15±3.14 | 64.22±3.20 | 0.195 | 64.32±3.41 | 64.03±3.05 | 64.21±3.17 | < 0.001* |
| Education > 12 years | 5164(44.0%) | 4468(38.1%) | 5047(43.0%) | <0.001* | 4382(37.4%) | 4644(39.6%) | 5653(48.2%) | <0.001* | 4494(38.3%) | 4522(38.6%) | 5663(48.3%) | < 0.001* |
| Married/Cohabitant | 8982(76.6%) | 9146(78.1%) | 9023(76.9%) | 0.023* | 9165(78.2%) | 9045(77.1%) | 8941(76.3%) | 0.002* | 9083(77.5%) | 9161(78.2%) | 8907(76.0%) | < 0.001* |
| Monthly income > 100,000 NTD | 569(8.4%) | 486(7.5%) | 455(7.0%) | 0.008* | 507(7.5%) | 430(6.7%) | 573(8.6%) | <0.001* | 540(7.2%) | 397(6.9%) | 573(8.7%) | < 0.001* |
| BMI | <0.001* | <0.001* | < 0.001* | |||||||||
| < 18.5 kg/m2 | 249(2.1%) | 256(2.2%) | 314(2.7%) | 224(1.9%) | 275(2.3%) | 320(2.7%) | 225(1.9%) | 277(2.4%) | 317(2.7%) | |||
| 18.5≤X < 24 kg/m2 | 5475(46.7%) | 5324(45.4%) | 5644(48.1%) | 5246(44.8%) | 5438(46.4%) | 5759(49.1%) | 5255(44.8%) | 5444(46.4%) | 5744(49.0%) | |||
| 24≤X < 27 kg/m2 | 3672(31.3%) | 3806(32.5%) | 3556(30.3%) | 3757(32.1%) | 3688(31.4%) | 3589(30.6%) | 3746(32.0%) | 3723(31.8%) | 3565(30.4%) | |||
| ≥ 27 kg/m2 | 2329(19.9%) | 2333(19.9%) | 2217(18.9%) | 2493(21.3%) | 2326(19.8%) | 2060(17.6%) | 2498(21.3%) | 2280(19.4%) | 2101(17.9%) | |||
| Exercise habits | 5645(48.1%) | 5421(46.2%) | 5844(49.8%) | <0.001* | 5425(46.3%) | 5563(47.4%) | 5922(50.5%) | <0.001* | 5425(46.2%) | 5707(48.7%) | 5778(49.2%) | < 0.001* |
| Smoking | 1613(14.6%) | 1689(15.3%) | 1461(13.3%) | <0.001* | 1719(15.6%) | 1562(14.1%) | 1482(13.6%) | <0.001* | 1682(15.2%) | 1615(14.6%) | 1466(13.4%) | < 0.001* |
| Alcohol | 1128(9.6%) | 1161(9.9%) | 960(8.2%) | <0.001* | 1204(10.3%) | 1037(8.8%) | 1008(8.6%) | <0.001* | 1208(10.3%) | 1079(9.2%) | 962(8.2%) | < 0.001* |
| Hypertension | 2956(25.2%) | 3050(26.0%) | 2924(24.9%) | 0.134 | 3076(26.2%) | 3004(25.6%) | 2850(24.3%) | 0.002* | 3076(26.2%) | 3031(25.8%) | 2823(24.1%) | <0.001* |
| Stroke | 177(1.5%) | 161(1.4%) | 154(1.3%) | 0.420 | 171(1.5%) | 172(1.5%) | 149(1.3%) | 0.351 | 192(1.6%) | 153(1.3%) | 147(1.3%) | 0.025* |
| Diabetes | 1253(10.7%) | 1406(12.0%) | 1279(10.9%) | 0.003* | 1344(11.5%) | 1345(11.5%) | 1249(10.6%) | 0.073 | 1359(11.6%) | 1354(11.5%) | 1225(10.4%) | 0.007* |
| Depression | 415(3.5%) | 445(3.8%) | 441(3.8%) | 0.532 | 404(3.4%) | 439(3.7%) | 458(3.9%) | 0.170 | 405(3.5%) | 438(3.7%) | 458(3.9%) | 0.181 |
*: P-value < 0.05
The association between tertile of air pollutants concentration and MCI
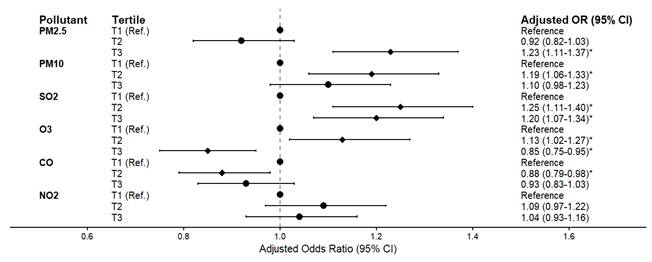
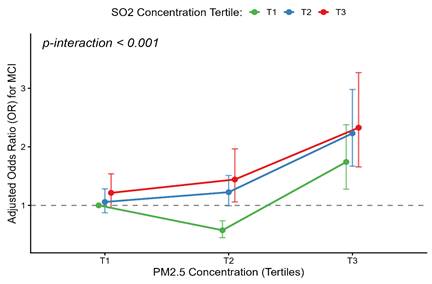
The associations between tertile of air pollutants and the risk of MCI are presented in Figure 3 and Table S2. After adjusting for gender, age, stroke, economic status, BMI, exercise habits, marital status, smoking, alcohol consumption, hypertension, and diabetes, participants with second tertile (T2) groups exposure concentrations of PM10, SO2 and O3 had a significantly higher risk of MCI compared to those in the first tertile (T1) groups (PM10: OR = 1.19, 95% CI: 1.06-1.33; SO2: OR = 1.25, 95% CI: 1.11-1.40; O3: OR = 1.13, 95% CI: 1.02-1.27). Meanwhile, participants with third tertile (T3) groups exposure concentrations of PM2.5 and SO2 had similar trends (PM2.5: OR = 1.23, 95% CI: 1.11-1.37; SO2: OR = 1.20, 95% CI: 1.07-1.34). However, participants exposed to higher concentrations of O3 and CO had a significantly lower risk of MCI compared to those in T1 groups (O3: OR = 0.85, 95% CI: 0.75-0.95; CO: OR = 0.88, 95% CI: 0.79-0.98). Meanwhile, the exposure concentrations of NO2 were not associated with MCI (OR = 1.04, 95% CI: 0.93 - 1.16). Furthermore, a highly significant interaction between PM2.5 and SO2 (PM2.5 × SO2) was observed (p-interaction < 0.001). After adjusting for co-pollutants and this interaction (Table S2), the independent effect of SO2 became non-significant, while the highest PM2.5 exposure (T3) remained robustly associated with MCI (OR = 1.74, 95% CI: 1.27-2.37). Crucially, concurrent exposure to the highest tertiles (T3) of both pollutants amplified the risk (OR = 2.33, 95% CI: 1.56-3.48) (Figure 4). Conversely, moderate PM2.5 (T2) showed a negative association (OR = 0.58, 95% CI: 0.45-0.74) compared to the reference group. Additionally, a sensitivity analysis was performed by further adjusting for depression in the final model (Table S3). The primary associations between air pollutants and the risk of MCI remained fundamentally unchanged, confirming the stability and reliability of our findings.
The association between tertile of air pollutants concentration and MCI. The forest plot displays the adjusted odds ratios (ORs) and 95% confidence intervals (CIs) for MCI across tertiles (T1, T2, and T3) of different air pollutants (PM2.5, PM10, SO2, O3, CO, and NO2), with the lowest tertile (T1) serving as the reference group. Data were adjusted for gender, age, stroke history, economic status, BMI, exercise habits, marital status, smoking, alcohol consumption, hypertension, and diabetes. The dots represent the ORs, and the horizontal bars represent the 95% CIs. *: p < 0.05.
Synergistic interaction of PM2.5 and SO2 on the risk of mild cognitive impairment. The interaction plot displays the adjusted odds ratios (ORs) for Mild Cognitive Impairment (MCI) across different combinations of PM2.5 and SO2 tertiles, with the lowest co-exposure group (PM2.5 T1 and SO2 T1) serving as the reference. The X-axis represents the tertiles of PM2.5 concentration, and the Y-axis indicates the adjusted ORs for MCI. The green, blue, and red lines correspond to the first (T1), second (T2), and third (T3) tertiles of SO2, respectively. Data were adjusted for gender, age, stroke history, economic status, BMI, exercise habits, marital status, smoking, alcohol consumption, hypertension, and diabetes. The dots represent the specific adjusted ORs for each combination, and the vertical bars represent the 95% CIs.
Discussion
There are 4,173 cases of MCI and 31,022 control participants, with an overall prevalence of MCI of 11.9%. The exposure to air pollutants concentrations were as followed: PM2.5 (30.70 ± 8.38 μg/m³), PM10 (59.25 ± 15.81 μg/m³), O₃ (25.96 ± 3.08 ppb), CO (0.65 ± 0.42 ppm), SO₂ (4.97 ± 2.59 ppb), and NO₂ (20.22 ± 5.09 ppb). Tertiles of air pollutants exposure reveals those higher levels of exposure to PM2.5 and SO₂ are significantly associated with an increased risk of MCI, with OR of 1.23 (95% CI: 1.11-1.37) and 1.20 (95% CI: 1.07-1.34), respectively, when compared to that of lower exposure levels.
A Swedish study revealed that elderly individuals exposed to high levels of PM experienced significant cognitive decline [27]. Similarly, research conducted in the United States found that PM2.5 exposure negatively affected cognitive function in older women [28]. In Taiwan, Chen et al. reported that long-term exposure to PM2.5 were associated with poor cognitive function in Taiwanese community-dwelling older adults [29, 30]. PM has been recognized as a major factor contributing to Alzheimer's disease [31, 32]. Although PM2.5 and PM10 share neurodegenerative mechanisms [33-35], the apparent protective effect of PM10 in Model 2 is likely a statistical artifact of multicollinearity (Beta = 0.87, p < 0.001) rather than a true biological benefit [36].
In this study, Higher SO₂ exposure associated with higher risk of MCI. Research by Park et al. and Chen et al. demonstrated that higher SO₂ exposure levels were correlated with lower MMSE scores, particularly in the domains of orientation, recall, and language abilities [30, 37]. Additionally, animal studies have confirmed that SO₂ exposure leads to increased pro-inflammatory cytokine levels, the production of amyloid-β protein in the brain, and hippocampal synaptic dysfunction, leading to cognitive impairment [17, 38, 39]. Notably, our interaction analysis reveals a significant interaction between PM2.5 and SO₂. The negative association between moderate PM2.5 (T2) and MCI may be consistent with the concept of hormesis [40], where mild environmental stress activates adaptive neuroprotective pathways [41]. Conversely, high PM2.5 exposure (T3) combined with SO₂ is synergistically associated with a higher risk of MCI, a finding that aligns with experimental models showing neurodegeneration through apoptosis and synaptic damage [42]. Our findings suggest that SO₂ may act as a critical effect modifier, elevating the risk of MCI during co-exposure with PM2.5.
Chen et al., using data from the Taiwan Biobank and Environmental Protection Administration, observed that higher O₃ concentrations had a protective effect on cognitive function [30]. Likewise, increase O₃ concentrations were associated with better cognition of long-term exposure in Taiwanese community-dwelling older adults [43]. In Korea, Park et al. used MMSE to assess cognitive function in adults aged 60 and above, finding that higher O₃ concentrations were associated with higher MMSE scores [37, 44]. These findings are consistent with the results of the present study. A potential biological explanation for this protective association is the "hormetic effect," where low-level oxidative stress induced by O3 may trigger adaptive cellular responses. This includes the activation of the Nrf2 signaling pathway and upregulation of endogenous antioxidant enzymes (e.g., superoxide dismutase), which collectively enhance neuroprotective capacity against cognitive decline [45, 46]. However, a cohort study in China tracking 9,544 individuals aged 65 and older reported that for every 10-unit increase in average O₃ exposure, the risk of cognitive impairment rose by 10.4%, contradictory to our findings, probably due to the different criteria of MMSE cutoff score [47]. O₃ can trigger the release of pro-inflammatory cytokines such as IL-1β, TNF-α, and IL-6 and disrupt the blood-brain barrier, leading to increased synthesis of inflammatory molecules in the brain [48, 49]; however, Iaccarino et al. found that exposure to PM2.5 concentrations was associated with amyloid PET scan, but not O₃ [50], suggesting that future study should be conducted to explore the mechanism of O₃ and cognitive function.
Although many studies have identified that CO and NO2 might negatively affect cognitive function [51-53], our study showed that the tertile of NO2 concentrations were not associated with MCI. Further experimental and epidemiological studies are needed to confirm the causal relationships between NO2 and MCI. While CO exposure exhibited an inverse association with MCI, suggesting a potential protective effect. This phenomenon could be attributed to the anti-inflammatory and neuroprotective properties of low-dose CO [54].
This study has four limitations. First, it is a cross-sectional study, we could not examine the effects of long-term exposure to these air pollutants on cognitive functioning. Second, the study participants are volunteers from the Taiwan Biobank, who may have higher health literacy and better economic conditions and lifestyles compared to that of the general population. Third, air pollution exposure was calculated using only the data from the nearest monitoring administrative district centers, which may not precisely evaluate individual exposure levels. However, as 88% of the administrative centers are located within 20 km of a station, the potential misclassification bias is considered to be minimized (Figure S1). Finally, air pollution levels were retrieved from air quality monitoring stations, which serve as a crude measure of exposure. While outdoor air pollution significantly contributes to indoor and personal exposure, it may not accurately represent actual personal exposure levels.
Conclusions
This study discloses that an effect of PM2.5 and SO2 on MCI among elderly individuals in Taiwan. Moreover, synergistic interaction exists between the two pollutants, with the risk of MCI significantly escalating as PM2.5 concentrations increase. This discovery may provide evidence for policy of MCI prevention. These findings can serve as a valuable reference for formulating air pollution control measures and dementia prevention policies in Taiwan, highlighting the importance of addressing environmental factors in the mitigation of MCI risk.
Supplementary Material
Supplementary figure and tables.
Acknowledgements
The authors appreciate all the scientists whose works contribute to this research article.
Funding
This research was funded by Cheng Hsin General Hospital (CHNDMC-110-16, CHNDMC-111-13, CHNDMC-112-01, CHNDMC-113-11201, CHNDMC-114-11201 and CHNDMC-115-04) and Medical Affairs Bureau, Ministry of National Defense (MND-MAB-C01-112002, MND-MAB-C14-113050, MND-MAB-C12-114049).
Authors' contributions
Conceptualization, Sui-Lung Su, Wei-Teing Chen; Data curation, Yue-Ting Lin; Formal analysis, Sui-Lung Su, Yue-Ting Lin; Investigation, Yue-Ting Lin, Hao Su; Methodology, Sui-Lung Su, Yue-Ting Lin, Chih-Hong Pan, Meng-Chang Lee, Yu-Hsuan Chen, Hsiao-Ting Lin, Wei-Teing Chen; Supervision, Wei-Teing Chen; Validation, Chih-Hong Pan, Meng-Chang Lee, Yu-Hsuan Chen, Hsiao-Ting Lin, Wei-Teing Chen; Writing - original draft, Sui-Lung Su; Writing - review & editing, Chih-Hong Pan, Meng-Chang Lee, Yu-Hsuan Chen, Hsiao-Ting Lin, Wei-Teing Chen.
Data availability
The datasets used and analysed during the current study available from the corresponding author on reasonable request.
Competing Interests
The authors have declared that no competing interest exists.
References
1. WHO. Mental health of older adults. Available from: https://wwwwhoint/news-room/fact-sheets/detail/mental-health-of-older-adults. 2017
2. National Development Council. Population Projections for the Republic of China (Taiwan): National Development Council; 2024 [Available from: https://pop-proj.ndc.gov.tw/main_en/
3. Sun Y, Lee HJ, Yang SC, Chen TF, Lin KN, Lin CC. et al. A nationwide survey of mild cognitive impairment and dementia, including very mild dementia, in Taiwan. PLoS One. 2014;9(6):e100303
4. Prince M, Guerchet M, Prina M. The epidemiology and impact of dementia-current state and future trends. WHO thematic briefing. 2015
5. Sachdev PS, Blacker D, Blazer DG, Ganguli M, Jeste DV, Paulsen JS. et al. Classifying neurocognitive disorders: the DSM-5 approach. Nat Rev Neurol. 2014;10(11):634-42
6. Wimo A, Guerchet M, Ali GC, Wu YT, Prina AM, Winblad B. et al. The worldwide costs of dementia 2015 and comparisons with 2010. Alzheimers Dement. 2017;13(1):1-7
7. Ma L. Depression, Anxiety, and Apathy in Mild Cognitive Impairment: Current Perspectives. Front Aging Neurosci. 2020;12:9
8. Mitchell AJ, Shiri-Feshki M. Rate of progression of mild cognitive impairment to dementia-meta-analysis of 41 robust inception cohort studies. Acta Psychiatr Scand. 2009;119(4):252-65
9. Chen JH, Lin KP, Chen YC. Risk factors for dementia. J Formos Med Assoc. 2009;108(10):754-64
10. van der Flier WM, Scheltens P. Epidemiology and risk factors of dementia. J Neurol Neurosurg Psychiatry. 2005 76 Suppl 5(Suppl 5):v2-7
11. Kivipelto M, Mangialasche F, Ngandu T. Lifestyle interventions to prevent cognitive impairment, dementia and Alzheimer disease. Nat Rev Neurol. 2018;14(11):653-66
12. Killin LO, Starr JM, Shiue IJ, Russ TC. Environmental risk factors for dementia: a systematic review. BMC Geriatr. 2016;16(1):175
13. Block ML, Calderon-Garciduenas L. Air pollution: mechanisms of neuroinflammation and CNS disease. Trends Neurosci. 2009;32(9):506-16
14. Genc S, Zadeoglulari Z, Fuss SH, Genc K. The adverse effects of air pollution on the nervous system. J Toxicol. 2012;2012(1):782462
15. Cacciottolo M, Wang X, Driscoll I, Woodward N, Saffari A, Reyes J. et al. Particulate air pollutants, APOE alleles and their contributions to cognitive impairment in older women and to amyloidogenesis in experimental models. Transl Psychiatry. 2017;7(1):e1022
16. Tzivian L, Dlugaj M, Winkler A, Weinmayr G, Hennig F, Fuks KB. et al. Long-Term Air Pollution and Traffic Noise Exposures and Mild Cognitive Impairment in Older Adults: A Cross-Sectional Analysis of the Heinz Nixdorf Recall Study. Environ Health Perspect. 2016;124(9):1361-8
17. Yun Y, Yao G, Yue H, Guo L, Qin G, Li G. et al. SO(2) inhalation causes synaptic injury in rat hippocampus via its derivatives in vivo. Chemosphere. 2013;93(10):2426-32
18. Feng YA, Chen CY, Chen TT, Kuo PH, Hsu YH, Yang HI. et al. Taiwan Biobank: A rich biomedical research database of the Taiwanese population. Cell Genom. 2022;2(11):100197
19. Folstein MF, Folstein SE, McHugh PR. “Mini-mental state”: a practical method for grading the cognitive state of patients for the clinician. Journal of psychiatric research. 1975;12(3):189-98
20. Katzman R, Zhang MY, Ouang Ya Q, Wang ZY, Liu WT, Yu E. et al. A Chinese version of the Mini-Mental State Examination; impact of illiteracy in a Shanghai dementia survey. J Clin Epidemiol. 1988;41(10):971-8
21. Ministry of Environment. Taiwan Air Quality Monitoring Network 2022 [Available from: https://airtw.moenv.gov.tw/ENG/default.aspx
22. Environmental Protection Department Taipei City Government. Air Quality Monitoring Network [Available from: https://www.tldep.gov.taipei/EIACEP_EN/
23. Environmental Protection Department New Taipei City Government. Air Quality Monitoring Network [Available from: https://www.epd.ntpc.gov.tw/Home
24. Environmental Protection Department Taoyuan City Government. Air Quality Monitoring Network [Available from: https://tydep.tycg.gov.tw/
25. Environmental Protection Department Taichung City Government. Air Quality Monitoring Network [Available from: https://taqm.epb.taichung.gov.tw/
26. Environmental Protection Department Kaohsiung City Government. Air Quality Monitoring Network [Available from: https://airtw.epa.gov.tw/ENG/default.aspx
27. Grande G, Wu J, Ljungman PL, Stafoggia M, Bellander T, Rizzuto D. Long-term exposure to PM 2.5 and cognitive decline: a longitudinal population-based study. Journal of Alzheimer's Disease. 2021;80(2):591-9
28. Weuve J, Puett RC, Schwartz J, Yanosky JD, Laden F, Grodstein F. Exposure to particulate air pollution and cognitive decline in older women. Archives of internal medicine. 2012;172(3):219-27
29. Chen JH, Kuo TY, Yu HL, Wu C, Yeh SL, Chiou JM. et al. Long-Term Exposure to Air Pollutants and Cognitive Function in Taiwanese Community-Dwelling Older Adults: A Four-Year Cohort Study. J Alzheimers Dis. 2020;78(4):1585-600
30. Chen MC, Wang CF, Lai BC, Hsieh SW, Chen SC, Hung CH. et al. Air Pollution Is Associated with Poor Cognitive Function in Taiwanese Adults. Int J Environ Res Public Health. 2021;18(1):316
31. Cho J, Jang H, Park H, Noh Y, Sohn J, Koh SB. et al. Alzheimer's disease-like cortical atrophy mediates the effect of air pollution on global cognitive function. Environ Int. 2023;171:107703
32. Calderón-Garcidueñas L, Herrera-Soto A, Jury N, Maher BA, González-Maciel A, Reynoso-Robles R. et al. Reduced repressive epigenetic marks, increased DNA damage and Alzheimer's disease hallmarks in the brain of humans and mice exposed to particulate urban air pollution. Environ Res. 2020;183:109226
33. He F, Tang J, Zhang T, Lin J, Li F, Gu X. et al. Impact of air pollution exposure on the risk of Alzheimer's disease in China: A community-based cohort study. Environmental research. 2022;205:112318
34. Roy R, D'Angiulli A. Air pollution and neurological diseases, current state highlights. Frontiers in neuroscience. 2024;18:1351721
35. Calderón-Garcidueñas L, Stommel EW, Lachmann I, Waniek K, Chao C-K, González-Maciel A. et al. TDP-43 CSF concentrations increase exponentially with age in metropolitan Mexico City young urbanites highly exposed to PM2. 5 and ultrafine particles and historically showing Alzheimer and Parkinson's hallmarks. Brain TDP-43 pathology in MMC residents is associated with high Cisternal CSF TDP-43 concentrations. Toxics. 2022;10(10):559
36. Tolbert PE, Klein M, Peel JL, Sarnat SE, Sarnat JA. Multipollutant modeling issues in a study of ambient air quality and emergency department visits in Atlanta. Journal of exposure science & environmental epidemiology. 2007;17(2):S29-S35
37. Park SY, Han J, Kim SH, Suk HW, Park JE, Lee DY. Impact of Long-Term Exposure to Air Pollution on Cognitive Decline in Older Adults Without Dementia. J Alzheimers Dis. 2022;86(2):553-63
38. Petersen RC. Mild cognitive impairment as a diagnostic entity. J Intern Med. 2004;256(3):183-94
39. Yang Z, Chen Y, Zhang Y, Li R, Dong C. The role of pro-/anti-inflammation imbalance in Abeta42 accumulation of rat brain co-exposed to fine particle matter and sulfur dioxide. Toxicol Mech Methods. 2017;27(8):568-74
40. Calabrese EJ. Hormesis: a fundamental concept in biology. Microb Cell. 2014;1(5):145-9
41. Wang Y, Jin X, Li M, Gao J, Zhao X, Ma J. et al. PM(2.5) Increases Systemic Inflammatory Cells and Associated Disease Risks by Inducing NRF2-Dependent Myeloid-Biased Hematopoiesis in Adult Male Mice. Environ Sci Technol. 2023;57(21):7924-37
42. Ku T, Chen M, Li B, Yun Y, Li G, Sang N. Synergistic effects of particulate matter (PM(2.5)) and sulfur dioxide (SO(2)) on neurodegeneration via the microRNA-mediated regulation of tau phosphorylation. Toxicol Res (Camb). 2017;6(1):7-16
43. Chen YC, Hsieh PI, Chen JK, Kuo E, Yu HL, Chiou JM. et al. Effect of indoor air quality on the association of long-term exposure to low-level air pollutants with cognition in older adults. Environ Res. 2023;233:115483
44. Cleary EG, Cifuentes M, Grinstein G, Brugge D, Shea TB. Association of low-level ozone with cognitive decline in older adults. Journal of Alzheimer's Disease. 2017;61(1):67-78
45. Galiè M, Covi V, Tabaracci G, Malatesta M. The Role of Nrf2 in the Antioxidant Cellular Response to Medical Ozone Exposure. International Journal of Molecular Sciences. 2019;20(16):4009
46. Re L, Mawsouf MN, Menéndez S, León OS, Sánchez GM, Hernández F. Ozone Therapy: Clinical and Basic Evidence of Its Therapeutic Potential. Archives of Medical Research. 2008;39(1):17-26
47. Gao Q, Zang E, Bi J, Dubrow R, Lowe SR, Chen H. et al. Long-term ozone exposure and cognitive impairment among Chinese older adults: A cohort study. Environ Int. 2022;160:107072
48. Croze ML, Zimmer L. Ozone Atmospheric Pollution and Alzheimer's Disease: From Epidemiological Facts to Molecular Mechanisms. J Alzheimers Dis. 2018;62(2):503-22
49. Martínez-Lazcano JC, González-Guevara E, del Carmen Rubio M, Franco-Pérez J, Custodio V, Hernández-Cerón M. et al. The effects of ozone exposure and associated injury mechanisms on the central nervous system. Rev Neurosci. 2013;24(3):337-52
50. Iaccarino L, La Joie R, Lesman-Segev OH, Lee E, Hanna L, Allen IE. et al. Association Between Ambient Air Pollution and Amyloid Positron Emission Tomography Positivity in Older Adults with Cognitive Impairment. JAMA Neurol. 2021;78(2):197-207
51. Kilian J, Kitazawa M. The emerging risk of exposure to air pollution on cognitive decline and Alzheimer's disease - Evidence from epidemiological and animal studies. Biomed J. 2018;41(3):141-62
52. Clifford A, Lang L, Chen R, Anstey KJ, Seaton A. Exposure to air pollution and cognitive functioning across the life course-A systematic literature review. Environ Res. 2016;147:383-98
53. Chen H, Kwong JC, Copes R, Hystad P, van Donkelaar A, Tu K. et al. Exposure to ambient air pollution and the incidence of dementia: A population-based cohort study. Environ Int. 2017;108:271-7
54. Weaver LK. Clinical practice. Carbon monoxide poisoning. N Engl J Med. 2009;360(12):1217-25
Author contact
![]() Corresponding author: Dr. Wei-Teing Chen, Division of Thoracic Medicine, Department of Medicine, Cheng Hsin General Hospital, No. 45, Zhenxing St, Beitou District, Taipei City, 112, Taiwan, R.O.C. (e-mail: unirigincom).
Corresponding author: Dr. Wei-Teing Chen, Division of Thoracic Medicine, Department of Medicine, Cheng Hsin General Hospital, No. 45, Zhenxing St, Beitou District, Taipei City, 112, Taiwan, R.O.C. (e-mail: unirigincom).