Impact Factor ISSN: 1449-1907
- Issue 9; 2026
- Issue 8; 2026
- Issue 7; 2026
- Issue 6; 2026
- Issue 5; 2026
- Volume 23; 2026
- Past Issues
- Editorial Board
- Cover Images
- Index & Coverage
- Cover Suggestion
- Special Issues
Introduction
Materials and Methods
Results
Discussion
Conclusions
Abbreviations
Acknowledgements
References

 Global reach, higher impact
Int J Med Sci 2026; 23(5):1865-1874. doi:10.7150/ijms.131338 This issue Cite
Research Paper
Mediation of Pre-Pregnancy Body Mass Index and Dietary Patterns with Relation to Vitamin D and Erythropoiesis-Related Micronutrients in Pregnant Women
Nhi Thi Hong Nguyen1,2, Chien-Yeh Hsu3,4, Chyi-Huey Bai5,6,7, Jung-Su Chang1,7,8,9, Yi-Chun Chen1, Ya-Li Huang5,6, Fan-Fen Wang10, Arpita Das11,12, Jane C.-J. Chao1,4,7,9 ![]()
1. School of Nutrition and Health Sciences, Taipei Medical University, Taipei, Taiwan.
2. Health Personnel Training Institute, University of Medicine and Pharmacy, Hue University, Hue city, Vietnam.
3. Department of Information Management, National Taipei University of Nursing and Health Sciences, Taipei, Taiwan.
4. Master Program in Global Health and Health Security, Taipei Medical University, Taipei, Taiwan.
5. Department of Public Health, School of Medicine, Taipei Medical University, Taipei, Taiwan.
6. School of Public Health, Taipei Medical University, Taipei, Taiwan.
7. Nutrition Research Center, Taipei Medical University Hospital, Taipei, Taiwan.
8. Graduate Institute of Metabolism and Obesity Sciences, Taipei Medical University, Taipei, Taiwan.
9. TMU Research Center for Digestive Medicine, Taipei Medical University, Taipei, Taiwan.
10. Department of Internal Medicine, Yangming Branch, Taipei City Hospital, Taipei, Taiwan.
11. Center for Drug Research and Development, Chang Gung University of Science and Technology, Taoyuan, Taiwan.
12. Graduate Institute of Health Industry Technology, College of Human Ecology, Chang Gung University of Science and Technology, Taoyuan, Taiwan.
Received 2026-1-12; Accepted 2026-3-21; Published 2026-4-8
Abstract

Pre-pregnancy body mass index (BMI) and dietary patterns (DPs) have been linked to serum erythropoiesis-related micronutrients (iron, folate, and vitamin B12). We studied the mediating effects of pre-pregnancy BMI and DPs on the association of serum vitamin D with the levels of erythropoiesis-related micronutrients. A cross-sectional research involving 1485 pregnant women was carried out in hospitals and clinics between 2017 and 2019 using the Nationwide Nutrition and Health Survey in Taiwan. Dietary intake was measured using food frequency questionnaire, and DPs were identified utilizing principal component analysis. Serum vitamin D and iron biomarker levels were examined. A mediation analysis was conducted to investigate the mediating effects of pre-pregnancy BMI and DPs on the association of serum vitamin D levels with erythropoiesis-related micronutrient levels. Serum 25(OH) vitamin D was positively linked to erythropoiesis-related micronutrient levels. Pre-pregnancy BMI partially mediated the association between serum 25(OH) vitamin D and serum iron (indirect effect: -0.004, 95% confidence interval (CI): -0.009, 0.000), folate (indirect effect: -0.009, 95% CI: -0.021, 0.000), and vitamin B12 levels (indirect effect: -0.137, 95% CI: 0.282, -0.02). Animal and staple-based DP and mushrooms, roots, and dairy DP mediated the association between serum 25(OH) vitamin D and serum iron levels (indirect effect: -0.004, 95% CI: -0.009, 0.000 and indirect effect: -0.004, 95% CI: 0.009, 0.000, respectively). Pre-pregnancy BMI mediates the association of serum vitamin D with erythropoiesis-related micronutrients. Animal and staple-based DP and mushrooms, roots, and dairy DP mediate the association between serum vitamin D and iron status.
Keywords: pregnant women, serum vitamin D, iron biomarkers, dietary pattern, mediating effect
Introduction
Iron, folate, and vitamin B12 are essential elements for erythropoiesis, and the demand for these micronutrients was increased during pregnancy [1]. A deficiency in any of these three nutrients could lead to reduced erythrocyte production and decreased numbers of circulating erythrocytes [1]. This condition could further not only cause anemia but also pose significant health risks for both mothers and children [2-5]. An iron deficiency during pregnancy can result in poor fetal growth, prematurity, and even intrauterine death due to severe anemia, along with increased maternal morbidity and mortality [6, 7]. Folate is crucial during pregnancy for embryonic formation, particularly during neural tube closure, as well as for preventing birth defects and growth retardation [8-10]. Previous research indicated that inadequate folate is linked to higher risks of adverse pregnancy outcomes, including stillbirths, preterm deliveries, and low birth weights [13, 14]. Furthermore, a vitamin B12 deficiency was found to be substantially related to intrauterine development retardation [11, 12].
Vitamin D is crucial for maintaining the homeostasis of multiple organ systems [15]. In addition to regulating phosphorus and calcium levels and supporting bone mineralization, vitamin D also exerts extra-skeletal impacts on cardiovascular, metabolic, respiratory, and immune systems [16-19]. Vitamin D insufficiency during pregnancy was common worldwide, and connected with numerous adverse maternal and fetal outcomes [20-22]. Recent research indicated that vitamin D influenced erythropoiesis [23], and was positively correlated with serum iron levels in pregnant women [24, 25]. Studies have observed the correlations between serum levels of vitamin D, folate, and vitamin B12 in children, however, these associations have not been investigated in pregnant women [25].
Additionally, pregnant women with higher pre-pregnancy body mass index (BMI) values, particularly in cases of overweight and obesity, had lower serum levels of iron, folate, and vitamin B12 [26-28]. Pregnant women consuming higher tertiles of carnivore DPs increased the risk of low serum iron levels, but decreased the risk of low serum vitamin B12 and vitamin D levels. Pregnant women in the highest tertile of dairy and nondairy alternative DP showed a reduced risk of low serum folate and vitamin B12 levels [29]. However, the effects of pre-pregnancy BMI and DPs on serum vitamin D and erythropoiesis-related micronutrients remain unclear. Our study aimed to explore the mediating effects of pre-pregnancy BMI and DPs on erythropoiesis-related micronutrient levels among the pregnant population.
Materials and Methods
Study design and study population
The 2017-2019 Nationwide Nutrition and Health Survey in Taiwan (NAHSIT) was performed in pregnant participants among 11 hospitals/clinics using stratified multistage probability sampling [28]. The data were provided by the same research team conducting the NAHSIT in pregnant women, and analyzed for the present study in February 2025. The eligible participants in this cross-sectional study were those who: (1) aged ≥15 years, (2) possessed a maternal health examination booklet, (3) had received obstetric examination services on more than one occasion, (4) spoke Mandarin or Taiwanese, and (5) had the willingness to participate in this study and submitted an informed consent form. Parental consent was provided for the participants under 20 years of age. Women with non-singleton pregnancies or who were unresponsive were excluded from the analysis. In total, 1485 pregnant individuals were involved in our study.
Evaluation of vitamin D and iron biomarkers
Blood samples were taken during the prenatal visit in order to measure serum 25(OH) vitamin D and anemia-related biomarkers such as hemoglobin (Hb), ferritin, total iron-binding capacity (TIBC), transferrin saturation, iron, folate, and vitamin B12. The assessment of serum biomarkers was presented previously [30].
Dietary assessment
Dietary consumption was evaluated using a standardized semi-quantitative food frequency questionnaire (FFQ), adapted from the NAHSIT FFQ with the habitual dietary intake of 59 food items as previously reported [28]. The consumption frequency for each food item was recorded on a daily, weekly, or monthly basis, and the overall monthly frequency was subsequently calculated for each food category. To calculate the DP score, 59 food items from the FFQ were grouped into 26 food group categories based on the similarities in nutrient composition shown in the previous supplementary material [30]. Principal component analysis (PCA) was employed to derive DPs from these food groups [31].
Covariates
Demographic characteristics were gathered for all pregnant individuals through a self-reported questionnaire, which included age, residential region, education level, household income, parity, number of pregnancies, trimester (trimester 1, 0-12 weeks, trimester 2, 13-26 weeks, and trimester 3, 27-40 weeks), and anthropometric data [32]. Pre-pregnancy BMI was computed as weight (kg) divided by height2 (m2).
Statistical analysis
The Shapiro-Wilks test was employed to assess the normality of variable distributions. Participants' baseline characteristics were provided as frequency and percentage for categorical variables, and as mean with standard deviation for continuous variables. Spearman correlation coefficients were calculated to examine the correlations between demographic characteristics, iron biomarkers, DP scores, and serum concentrations of erythropoiesis-related micronutrients (iron, folate, and vitamin B12) in pregnant women. The PCA was conducted using PROC PLS tool in SAS 9.4 (SAS, Cary, NC, USA) to classify 26 food group categories into three DPs. Factor loadings below 0.30 were excluded to simplify the analysis [33], as higher loadings indicate stronger associations between specific food groups and derived dietary patterns.
Hierarchical forward regression models were applied to examine the independent effects of demographic characteristics, anemia-related biomarkers, and DP scores on serum levels of erythropoiesis-related micronutrients (iron, folate, and vitamin B12). In step 1, serum 25(OH) vitamin D was included as the primary independent variable, with age and iron biomarkers (Hb, ferritin, and TIBC) as control variables. In step 2, mediator variables, including pre-pregnancy BMI and DPs, were added to the model.
In addition, mediation analysis was performed to estimate the impacts of the independent variable on a mediator (path a), the effect of the mediator on a dependent variable (path b), the direct effect of the independent variable on the dependent variable (path c), and the direct effect of the independent variable on the dependent variable after accounting for the mediator (path c'). A bootstrapping method, based on the procedures recommended by Shrout and Bolger, was used to test the mediation effect [34]. Indirect effects (a × b) were calculated using point estimates, 95% bias-corrected samples with 95% CI based on 5000 bootstrapped samples. In our analysis, pre-pregnancy BMI and DP scores served as the mediators in the relationship between serum 25(OH) vitamin D and serum concentrations of erythropoiesis-related micronutrients (iron, folate, and vitamin B12). All analyses were conducted employing R programming software (version 4.1.3, R Development Core Team, Vienna, Austria). The p-values ≤ 0.05 are regarded as statistically significant.
Results
Characteristics of pregnant women
The baseline characteristics of 1485 pregnant women are demonstrated in Table 1. The participants had an average age of 32.6 years. The highest proportion of participants resided in the northern region (33.2%), and had a graduate degree (68.7%). More than half of the participants (55.0%) had one previous delivery (parity = 1). Pregnant women in this study had mean pre-pregnancy BMI of 22.5 kg/m2, and average serum concentrations of 25.9 nmol/L for 25(OH) vitamin D, 12.9 µmol/L for serum iron, 29.9 nmol/L for serum folate, and 313.4 pmol/L for serum vitamin B12. Among DPs, the highest mean score was observed for the mushrooms, roots, and dairy DP (54.7 points), followed by animal DP (51.9 points).
Baseline characteristics of pregnant women (n = 1485)
| n (%) or mean ± SD | |
|---|---|
| Age, years | 32.6 ± 4.8 |
| Residential region, n (%)* | |
| Northern | 492 (33.2) |
| Central | 370 (24.9) |
| Southern | 288 (19.4) |
| Eastern and other | 333 (22.5) |
| Education level, n (%)* | |
| High school | 235 (15.9) |
| Undergraduate | 228 (15.4) |
| Graduate | 1014 (68.7) |
| Household income, n (%)* | |
| < 30,000 NTD | 208 (14.3) |
| 30,000-60,000 NTD | 629 (43.1) |
| ≥ 60,000 NTD | 622 (42.6) |
| Parity, n (%)* | |
| 1 | 816 (55.0) |
| 2 | 522 (35.2) |
| 3 | 145 (9.8) |
| Number of pregnancies, n (%) | |
| 1 | 1452 (97.8) |
| ≥ 2 | 33 (2.2) |
| Trimester, n (%) | |
| First | 364 (24.5) |
| Second | 483 (32.5) |
| Third | 638 (43.0) |
| Pre-pregnancy BMI, kg/m2 | 22.5 ± 4.3 |
| 25(OH) Vitamin D, nmol/L | 25.9 ± 8.8 |
| Hemoglobin, mmol/L | 7.3 ± 1.2 |
| Ferritin, nmol/L | 0.05 ± 0.09 |
| TIBC, µmol/L | 83.6 ± 18.3 |
| Transferrin saturation, % | 16.5 ± 9.8 |
| Iron, µmol/L | 12.9 ± 7.1 |
| Folate, nmol/L | 29.9 ± 30.6 |
| Vitamin B12, pmol/L | 313.4 ± 200.9 |
| Mushrooms, roots, and dairy DP, score | 54.7 ± 33.5 |
| Processed and carnivore product-based DP, score | 9.6 ± 8.2 |
| Animal and staple-based DP, score | 51.9 ± 26.7 |
*There were 2, 8, 26, and 2 missing values for the residential region, education level, household income, and parity, respectively. BMI: body mass index; DP: dietary pattern; SD: standard deviation; TIBC: total iron binding capacity
Dietary patterns
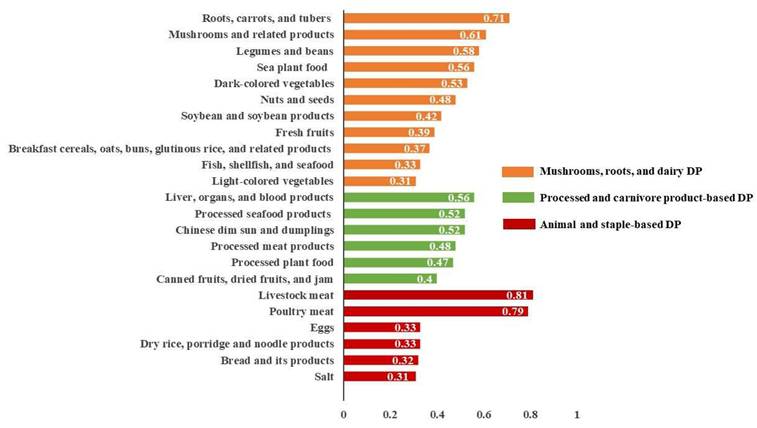
The PCA results revealed three different DPs, which together accounted for 7.4% of the total variance (3.0%, 2.2%, and 2.2%, respectively) as illustrated in Figure 1. Factor loading thresholds above 0.30 were used to categorize and rank DPs. Each DP was labeled based on its primary factor loadings and food composition. The DP-1 was designated as mushrooms, roots, and dairy DP. The DP-2 was labeled as processed and carnivore product-based DP. The DP-3 was classified as animal and staple-based DP.
Factor loading of three dietary patterns derived from principal component analysis. DP: dietary pattern.
Association of demographic characteristics, iron biomarkers, dietary pattern scores with serum levels of erythropoiesis-related micronutrients
Table 2 presents Spearman's correlation coefficients of demographic characteristics, iron biomarkers, and DP scores with serum erythropoiesis-related micronutrient levels among pregnant women. Age, serum 25(OH) vitamin D, and ferritin showed positive correlations with serum iron, folate, and vitamin B12. However, pre-pregnancy BMI was negatively associated with serum iron (ρ = -0.06, p = 0.017), folate (ρ = -0.09, p < 0.001), and vitamin B12 (ρ = -0.13, p < 0.001). Serum TIBC was positively correlated with serum iron (ρ = 0.48, p < 0.001), but negatively correlated with serum folate (ρ = -0.27, p < 0.001) and vitamin B12 (ρ = -0.32, p < 0.001). The mushrooms, roots, and dairy DP revealed a positive correlation with serum folate (ρ = 0.07, p = 0.007), and animal and staple-based DP was negatively linked to serum iron (ρ = -0.06, p = 0.021).
Spearman's correlation coefficients between demographic characteristics, iron biomarkers, dietary pattern scores, and serum erythropoiesis-related micronutrient levels among pregnant women (n = 1485)
| Variables | Serum iron | Serum folate | Serum vitamin B12 | |||
|---|---|---|---|---|---|---|
| ρ | P-value | ρ | P-value | ρ | P-value | |
| Age, years | 0.09 | < 0.001 | 0.20 | < 0.001 | 0.08 | 0.002 |
| Pre-pregnancy BMI, kg/m2 | -0.06 | 0.017 | -0.09 | < 0.001 | -0.13 | < 0.001 |
| 25(OH) Vitamin D, nmol/L | 0.11 | < 0.001 | 0.19 | < 0.001 | 0.20 | < 0.001 |
| Hemoglobin, mmol/L | 0.28 | < 0.001 | 0.16 | < 0.001 | 0.15 | < 0.001 |
| Ferritin, nmol/L | 0.48 | < 0.001 | 0.36 | < 0.001 | 0.34 | < 0.001 |
| TIBC, µmol/L | 0.48 | < 0.001 | -0.27 | < 0.001 | -0.32 | < 0.001 |
| Transferrin saturation, % | 0.02 | 0.457 | -0.01 | 0.739 | -0.03 | 0.345 |
| Mushrooms, roots, and dairy DP, score | -0.04 | 0.101 | 0.07 | 0.007 | 0.03 | 0.309 |
| Processed and carnivore product-based DP, score | 0.01 | 0.757 | 0.03 | 0.206 | -0.001 | 0.957 |
| Animal and staple-based DP, score | -0.06 | 0.021 | -0.02 | 0.484 | 0.03 | 0.292 |
BMI: body mass index; DP: dietary pattern; TIBC: total iron binding capacity
Hierarchical linear regression models on serum iron, folate, and vitamin B12
Table 3 presents the findings of the hierarchical linear regression analysis of serum 25(OH) vitamin D, demographic characteristics, iron biomarkers, and DP scores on serum iron. In step 1, serum 25(OH) vitamin D, age, Hb, and ferritin indicated positive associations with serum iron. However, TIBC was negatively correlated with serum iron. In step 2, after adding pre-pregnancy BMI and DPs into the model, serum 25(OH) vitamin D (β = 0.11, 95% CI: 0.07, 0.15, p < 0.001), age (β = 0.90, 95% CI: 0.02, 0.17, p < 0.05), hemoglobin (β = 1.02, 95% CI: 0.73, 1.31, p < 0.001), and ferritin (β = 4.81, 95% CI: 0.99, 8.62, p < 0.05) were positively associated with serum iron. However, TIBC (β = -0.05, 95% CI: -0.07, -0.03, p < 0.001), pre-pregnancy BMI (β = -0.18, 95% CI: -0.26, -0.09, p < 0.001), animal and staple-based DP (β = -0.02, 95% CI: -0.03, -0.002, p < 0.05) were negatively correlated with serum iron.
Hierarchical linear regression model on the association of demographic characteristics, anemia-related biomarkers, and DP scores with serum iron
| Predictors | Step 1 β (95% CI) | Step 2 β (95% CI) |
|---|---|---|
| 25(OH) Vitamin D, nmol/L | 0.09 (0.06, 0.14)*** | 0.11 (0.07, 0.15)*** |
| Age, years | 0.08 (0.01, 0.15)* | 0.09 (0.02, 0.17)* |
| Hemoglobin, mmol/L | 1.01 (0.72, 1.31)*** | 1.02 (0.73, 1.31)*** |
| Ferritin, nmol/L | 4.48 (0.65, 8.31)* | 4.81 (0.99, 8.62)* |
| TIBC, µmol/L | -0.05 (-0.07, -0.03)*** | -0.05 (-0.07, -0.03)*** |
| Pre-pregnancy BMI, kg/m2 | -0.18 (-0.26, -0.09)*** | |
| Mushrooms, roots, and dairy DP, score | -0.01 (-0.02, 0.01) | |
| Processed and carnivore product-based DP, score | -0.004 (-0.05, 0.04) | |
| Animal and stable-based DP, score | -0.02 (-0.03, -0.002)* | |
| Adjusted R2 | 0.08 | 0.10 |
*p < 0.05, ***p < 0.001. β: regression coefficient; BMI: body mass index; DP: dietary pattern; TIBC: total iron binding capacity
Table 4 indicates the findings of the hierarchical linear regression models of serum 25(OH) vitamin D, demographic characteristics, iron biomarkers, and DP scores on serum folate. In step 1, serum 25(OH) vitamin D, age, and ferritin showed positive associations with serum folate (p < 0.001). However, Hb and TIBC were negatively correlated with serum folate (p < 0.001). In step 2, the independent variables in step 1 remained significantly associated with serum folate, including serum 25(OH) vitamin D (β = 0.43, 95% CI: 0.27, 0.59, p < 0.001), age (β = 0.48, 95% CI: 0.18, 0.78, p < 0.01), Hb (β = -3.04, 95% CI: -4.22, -1.87, p < 0.001), ferritin (β = 79.03, 95% CI: 63.53, 94.53, p < 0.01), and TIBC (β = -0.29, 95% CI: -0.37, -0.20, p < 0.001). In step 2, pre-pregnancy BMI (β = -0.32, 95% CI: -0.65, 0.02, p < 0.05) was negatively associated with serum folate, but mushrooms, roots, and dairy DP (β = 0.11, 95% CI: 0.07, 0.16, p < 0.001) and processed and carnivore product-based DP (β = 0.24, 95% CI: 0.05, 0.43, p < 0.05) were positively correlated with serum folate.
Hierarchical linear regression model on the association of demographic characteristics, anemia-related biomarkers, and DP scores with serum folate
| Predictors | Step 1 β (95% CI) | Step 2 β (95% CI) |
|---|---|---|
| 25(OH) Vitamin D, nmol/L | 0.46 (0.29, 0.63)*** | 0.43 (0.27, 0.59)*** |
| Age, years | 0.52 (0.22, 0.83)*** | 0.48 (0.18, 0.78)** |
| Hemoglobin, mmol/L | -3.27 (-4.46, 2.07)*** | -3.04 (-4.22, -1.87)*** |
| Ferritin, nmol/L | 81.75 (66.05, 97.45)*** | 79.03 (63.53, 94.53) ** |
| TIBC, µmol/L | -0.28 (-0.37, -0.19)*** | -0.29 (-0.37, -0.20)*** |
| Pre-pregnancy BMI, kg/m2 | -0.32 (-0.65, 0.02)* | |
| Mushrooms, roots, and dairy DP, score | 0.11 (0.07, 0.16)*** | |
| Processed and carnivore product-based DP, score | 0.24 (0.05, 0.43)* | |
| Animal and stable-based DP, score | -0.002 (-0.06, 0.06) | |
| Adjusted R2 | 0.15 | 0.19 |
*p < 0.05, **p < 0.01, ***p < 0.001. β: regression coefficient; BMI: body mass index; DP: dietary pattern; TIBC: total iron binding capacity
Table 5 demonstrates the results of the hierarchical linear regression models of serum 25(OH) vitamin D, demographic characteristics, iron biomarkers, and DP scores on serum vitamin B12. In step 1, serum 25(OH) vitamin D and age were positively correlated with serum vitamin B12, but TIBC was negatively associated with serum vitamin B12. In step 2, serum 25(OH) vitamin D (β = 3.64, 95% CI: 2.49, 4.78, p < 0.001), age (β = 2.86, 95% CI: 0.76, 4.96, p < 0.001), and TIBC (β = -1.82, 95% CI: -2.42, -1.22, p < 0.001) remained significant correlations with serum vitamin B12, and pre-pregnancy BMI (β = -5.45, 95% CI: -7.78, -3.12, p < 0.001) indicated a negative association with serum vitamin B12.
Hierarchical linear regression model on the association of demographic characteristics, anemia-related biomarkers, and DP scores with serum vitamin B12
| Predictors | Step 1 β (95% CI) | Step 2 β (95% CI) |
|---|---|---|
| 25(OH) Vitamin D, nmol/L | 3.46 (2.31, 4.60)*** | 3.64 (2.49, 4.78)*** |
| Age, years | 2.35 (0.25, 4.45)* | 2.86 (0.76, 4.96)*** |
| Hemoglobin, mmol/L | 3.13 (-5.16, 11.42) | 3.84 (-4.41, -12.09) |
| Ferritin, nmol/L | 56.49 (-52.83, 165.80) | 72.49 (-36.28, 181.25) |
| TIBC, µmol/L | -1.88 (-2.48, -1.28)*** | -1.82 (-2.42, -1.22)*** |
| Pre-pregnancy BMI, kg/m2 | -5.45 (-7.78, -3.12)*** | |
| Mushrooms, roots, and dairy DP, score | -0.24 (-0.58, 0.09) | |
| Processed and carnivore product-based DP, score | -1.04 (-2.39, 0.31) | |
| Animal and stable-based DP, score | 0.23 (-0.17, 0.63) | |
| Adjusted R2 | 0.06 | 0.07 |
*p < 0.05, ***p < 0.001. β: regression coefficient; BMI: body mass index; DP: dietary pattern; TIBC: total iron binding capacity
Mediating effects of pre-pregnancy BMI and dietary patterns between serum 25(OH) vitamin D and serum erythropoiesis-related micronutrients
To understand the mediating effects of pre-pregnancy BMI and DP scores between serum 25(OH) vitamin D and serum erythropoiesis-associated micronutrients (i.e., serum iron, folate, and vitamin B12), a mediation analysis was conducted (Figure 2). First, we observed that the association of serum 25(OH) vitamin D with serum iron was mediated by pre-pregnancy BMI, animal and staple-based DP, as well as mushrooms, roots, and dairy DP, with the standardized regression coefficients for the indirect associations of -0.004 (95% CI: -0.009, 0.000, p = 0.02), -0.004 (95% CI: -0.009, 0.000, p = 0.045), and -0.004 (95% CI -0.009, 0.000, p = 0.03), respectively (Table 6). The direct effect remained statistically significant after accounting for these mediators (p < 0.001). The association of serum 25(OH) vitamin D with serum folate was mediated by pre-pregnancy BMI, with the standardized regression coefficient for the indirect association of -0.009 (95% CI: -0.021, 0.000, p = 0.033) (Table 7). The direct effect remained statistically significant after including the mediator (β = 0.376, 95% CI: 0.216, 0.58, p < 0.001). The relationship between serum 25(OH) vitamin D and serum vitamin B12 was mediated by pre-pregnancy BMI, with the standardized regression coefficient for the indirect association of -0.137 (95% CI: -0.282, -0.02, p = 0.02) (Table 8). The direct effect remained statistically significant after including the mediator (β = 3.406, 95% CI: 1.562, 5.51, p < 0.001).
Mediating effects of pre-pregnancy body mass index and dietary patterns between serum 25(OH) vitamin D and serum erythropoiesis-associated micronutrients. *p < 0.05, **p < 0.01, ***p < 0.001.
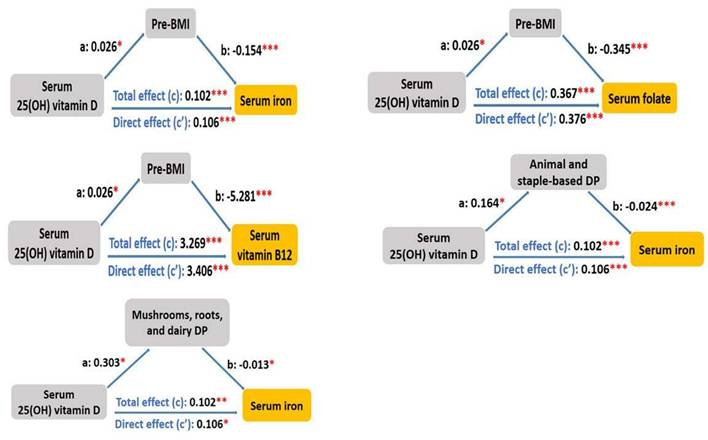
Effects mediated by pre-pregnancy BMI, animal and staple-based DP score, and mushrooms, roots, and dairy DP score on the association between serum 25(OH) vitamin D and serum iron levels
| Serum 25(OH) vitamin D | Serum iron | ||||||
|---|---|---|---|---|---|---|---|
| Indirect effect | Direct effect | Total effect | Proportion mediated (%) | ||||
| β (95% CI) | P | β (95% CI) | P | β (95% CI) | P | ||
| Pre-pregnancy BMI | -0.004 (-0.009, 0.000) | 0.02 | 0.106 (0.061, 0.15) | < 0.001 | 0.102 (0.057, 0.15) | < 0.001 | -3.9% |
| Animal and staple-based DP score | -0.004 (-0.009, 0.000) | 0.045 | 0.106 (0.062, 0.15) | < 0.001 | 0.102 (0.058, 0.15) | < 0.001 | -3.9% |
| Mushrooms, roots, and dairy DP score | -0.004 (-0.009, 0.000) | 0.03 | 0.106 (0.061, 0.15) | < 0.001 | 0.102 (0.058, 0.15) | < 0.001 | -3.8% |
β: regression coefficient; BMI: body mass index; CI: confidence interval; DP: dietary pattern
Effects mediated by pre-pregnancy BMI on the association between serum 25(OH) vitamin D and serum folate levels
| Serum 25(OH) vitamin D | Serum folate | ||||||
|---|---|---|---|---|---|---|---|
| Indirect effect | Direct effect | Total effect | Proportion mediated (%) | ||||
| β (95% CI) | P | β (95% CI) | P | β (95% CI) | P | ||
| Pre-pregnancy BMI | -0.009 (-0.021, 0.000) | 0.033 | 0.376 (0.216, 0.58) | < 0.001 | 0.367 (0.205, 0.58) | < 0.001 | -2.4% |
β: regression coefficient; BMI: body mass index; CI: confidence interval
Effects mediated by pre-pregnancy BMI on the association between serum 25(OH) vitamin D and serum vitamin B12 levels
| Serum 25(OH) vitamin D | Serum vitamin B12 | ||||||
|---|---|---|---|---|---|---|---|
| Indirect effect | Direct effect | Total effect | Proportion mediated (%) | ||||
| β (95% CI) | P | β (95% CI) | P | β (95% CI) | P | ||
| Pre-pregnancy BMI | -0.137 (-0.282, -0.02) | 0.02 | 3.406 (1.562, 5.51) | < 0.001 | 3.269 (1.405, 5.38) | < 0.001 | -4.2% |
β: regression coefficient; BMI: body mass index; CI: confidence interval
Discussion
DPs played vital roles in erythropoiesis-associated micronutrient status during pregnancy, and pre-pregnancy BMI was reported to be associated with levels of erythropoiesis-related micronutrients in pregnant women [26-28]. However, the impacts of serum 25(OH) vitamin D on levels of erythropoiesis-related micronutrients as mediated by pre-pregnancy BMI and DPs remain unclear. The novelty of our study lies in examining the mediating effects of pre-pregnancy BMI and DPs on the associations of serum 25(OH) vitamin D with erythropoiesis-related micronutrient levels in pregnant women. Our major findings were: (1) an increase in serum 25(OH) vitamin D was associated with elevated levels of serum iron, folate, and vitamin B12, (2) an elevation in pre-pregnancy BMI was linked with a decrease in serum iron, folate, or vitamin B12 level, (3) higher animal and staple-based DP scores were associated with lower serum iron levels, (4) higher intakes of mushrooms, roots, and dairy DP as well as processed and carnivore product-based DP were associated with increased serum folate levels, (5) pre-pregnancy BMI partially mediated the association of serum 25(OH) vitamin D with serum erythropoiesis-related micronutrient levels, and (6) animal and staple-based DP as well as mushrooms, roots, and dairy DP partially mediated the association between serum 25(OH) vitamin D and serum iron levels.
In this study, we found that increasing serum 25(OH) vitamin D levels were positively linked with elevated serum iron, folate, and vitamin B12 levels. The findings aligned with the results of the previous studies, which reported that serum vitamin D influenced erythropoiesis [23], and was positively correlated with serum iron levels among pregnant women [24, 25]. Additionally, our results showed that pre-pregnancy BMI was related to serum iron, folate, and vitamin B12 levels, supported by prior studies which indicated that higher pre-pregnancy BMI had an association with lower serum levels of iron, folate, and vitamin B12 in pregnant women [26-28].
We demonstrated that pre-pregnancy BMI with the mean of 22.5 kg/m2 had a positive association with serum 25(OH) vitamin D levels. However, a previous study reported that high maternal BMI (≥ 25 kg/m2) in early pregnancy increased the risk of vitamin D deficiency [35]. Additionally, obese women with pre-pregnancy BMI ≥ 30 kg/m2 showed lower adjusted serum 25(OH) vitamin D levels and an increased prevalence of vitamin D deficiency as compared with lean women with pre-pregnancy BMI < 25 kg/m2 [36]. The inconsistencies between our findings and the previous studies could be attributed to the differences in the mean of pre-pregnancy BMI among study populations. We also observed that serum 25(OH) vitamin D level was positively related to animal and staple-based DP and mushrooms, roots, and dairy DP scores. The previous evidence showed that higher intake of plant-based, carnivore, or dairy and nondairy alternatives DP was linked to a decreased risk of low serum vitamin D levels in Taiwanese pregnant women [29]. Another study demonstrated that greater dairy intake was significantly associated with higher serum vitamin D levels in pregnant women [37].
We observed that pre-pregnancy BMI partially mediated the relationship between serum 25(OH) vitamin D and serum erythropoiesis-related micronutrient levels, implying that vitamin D's effect on these micronutrients could be indirectly mediated through its influence on maternal body composition. Pregnant women with higher BMI (≥ 25 kg/m2) were associated with lower circulating vitamin D levels [38] due to its sequestration in the adipose tissue [39]. Furthermore, pregnant women with higher BMI (≥ 30 kg/m2) increased inflammatory markers adenosine deaminase and C-reactive protein [40]. Women with high BMI (27.9 ± 4.9 kg/m2) and high energy intake (2389 ± 715 kcal/d) decreased micronutrient intake such as vitamin D, iron, and folate, and reduced the bioavailability of iron [41].
Additionally, animal and staple-based DP scores as well as mushrooms, roots, and dairy DP scores partially mediated the relationship between serum 25(OH) vitamin D and serum iron levels. The mediation by these DPs in the vitamin D-iron pathway suggests that these diets rich in iron-containing foods could enhance vitamin D's direct influence on serum iron levels. Women with higher serum 25(OH) vitamin D levels (≥ 50 nmol/L) had better iron status by increasing transferrin saturation [42]. A systematic review also supported that a positive association between vitamin D and iron status [43]. Vitamin D could improve intestinal iron absorption via iron-hepcidin-ferroportin axis, suggesting a possible synergy between serum vitamin D and iron status [25]. In our study, mushrooms, roots, and dairy DP scores partially mediated the relationship between serum 25(OH) vitamin D and serum iron levels. The biological plausibility of this mediation was supported by the nutritional properties of the food components in this DP. Mushrooms, particularly these exposed to sunlight or ultraviolet light, served as a non-animal source of vitamin D2, contributing directly to vitamin D status [44]. Root vegetables such as carrots and beets are not significant sources of vitamin D, but they are rich in antioxidants and phytochemicals which could promote systemic anti-inflammatory processes, thereby indirectly supporting the regulation of vitamin D and iron homeostasis [45].
In addition to iron, folate, and vitamin B12, which are well-recognized micronutrients related to anemia, zinc is another important micronutrient related to anemia [46, 47]. Zinc represents the second most abundant trace element in the erythron after iron [48]. Zinc played an important biological role in maintaining the quantity and integrity of red blood cells [46]. Intracellular zinc in erythroid progenitor cells was recognized as a molecular switch that drove erythroid development and cell survival which were tightly regulated [49]. Additionally, zinc served as a structural or catalytic component of metalloproteins which were critical for heme biosynthesis or antioxidant defense in red blood cells, including δ-aminolevulinic acid dehydratase and superoxide dismutase 1 [50, 51]. Moreover, GATA1, a transcriptional factor, is a zinc-finger protein, and requires zinc to regulate the proliferation and differentiation of red blood cells [51]. Therefore, further research is needed to take zinc into account as a vital micronutrient associated with anemia.
This study has several strengths. The present study utilized a nationally representative dataset from a population of Taiwanese pregnant women. To our knowledge, this is the first study to investigate the mediation association of pre-pregnancy BMI and DP scores with vitamin D and erythropoiesis-related micronutrients. However, our study has certain limitations. First, the study was constrained by its cross-sectional design, so we were unable to demonstrate the causal relationship. Second, the FFQ and self-reported information for body weight and height could have caused biases, including under- or over-estimation error. Third, some specific pathological symptoms in pregnant women such as morning sickness during the first trimester of pregnancy were not included in our analysis.
Conclusions
We observed that pre-pregnancy BMI partially mediated the association of serum 25(OH) vitamin D with serum erythropoiesis-related micronutrient levels. Higher pre-pregnancy BMI was negatively associated with erythropoiesis-related micronutrient levels. Animal and staple-based DP scores as well as mushrooms, roots, and dairy DP scores mediated the association of serum 25(OH) vitamin D with serum iron. Higher intake of animal and staple-based DP or mushrooms, roots, and dairy DP was correlated with reduced serum iron levels.
Abbreviations
BMI: body mass index; CI: confidence interval; DP: dietary pattern; FFQ: food frequency questionnaire; Hb: hemoglobin; NAHSIT: Nationwide Nutrition and Health Survey in Taiwan; PCA: principal component analysis; TIBC: total iron-binding capacity.
Acknowledgements
We gratefully acknowledge the Nationwide Nutrition and Health Survey in Pregnant Women team for providing the access of the dataset.
Data availability statement
The data were obtained from the dataset of the Nationwide Nutrition and Health Survey in Taiwan, and were not publicly accessible. Data described in the manuscript can be provided by the corresponding author upon reasonable request.
Ethics statement and consent to participate
The study was approved by the Joint Institutional Review Board of Taipei Medical University (TMU-JIRB N201707039), and was performed in line with the principles of the Declaration of Helsinki. All subjects provided the written informed consent before participating in this study.
Author contributions
NTH Nguyen, JC-J Chao designed the study. C-Y Hsu, C-H Bai, J-S Chang, Y-C Chen, Y-L Huang, and F-F Wang participated in data curation and validation. NTH Nguyen performed a formal analysis. NTH Nguyen, A Das, and JC-J Chao wrote the original draft. NTH Nguyen and JC-J Chao reviewed and edited the manuscript. All the authors read and approved the final manuscript.
Competing Interests
The authors have declared that no competing interest exists.
References
1. Koury M, Ponka P. New insights into erythropoiesis: the roles of folate, vitamin B12, and iron. Annu Rev Nutr. 2004;24:105-131
2. Mishra J, Tomar A, Puri M. et al. Trends of folate, vitamin B12, and homocysteine levels in different trimesters of pregnancy and pregnancy outcomes. Am J Hum Biol. 2020;32:e23388
3. Furness D, Fenech M, Dekker G. et al. Folate, vitamin B12, vitamin B6 and homocysteine: impact on pregnancy outcome. Matern Child Nutr. 2013;9:155-166
4. Alwan NA, Hamamy H. Maternal iron status in pregnancy and long-term health outcomes in the offspring. J Pediatr Genet. 2015;4:111-123
5. Hernández-Martínez C, Canals J, Aranda N. et al. Effects of iron deficiency on neonatal behavior at different stages of pregnancy. Early Hum Dev. 2011;87:165-169
6. Abu-Ouf NM, Jan MM. The impact of maternal iron deficiency and iron deficiency anemia on child's health. Saudi Med J. 2015;36:146-149
7. Georgieff MK. Iron deficiency in pregnancy. Am J Obstet Gynecol. 2020;223:516-524
8. Zou R, El Marroun H, Cecil C. et al. Maternal folate levels during pregnancy and offspring brain development in late childhood. Clin Nutr. 2021;40:3391-3400
9. Scholl TO, Johnson WG. Folic acid: influence on the outcome of pregnancy. Am J Clin Nutr. 2000;71:1295S-1303S
10. Ami N, Bernstein M, Boucher F. et al. Folate and neural tube defects: the role of supplements and food fortification. Paediatr Child Health. 2016;21:145-154
11. Sukumar N, Venkataraman H, Wilson S. et al. Vitamin B12 status among pregnant women in the UK and its association with obesity and gestational diabetes. Nutrients. 2016;8:768
12. Behere RV, Deshmukh AS, Otiv S. et al. Maternal vitamin B12 status during pregnancy and its association with outcomes of pregnancy and health of the offspring: a systematic review and implications for policy in India. Front Endocrinol (Lausanne). 2021;12:619176
13. de Benoist B. Conclusions of a WHO technical consultation on folate and vitamin B12 deficiencies. Food Nutr Bull. 2008;29:S238-S244
14. Lweno ON, Kalinjuma AV, Hertzmark E. et al. Maternal high intake of vitamin B12 and folate reduces the risk of adverse birth outcomes among HIV negative pregnant women in Dar es Salaam, Tanzania. Reprod Female Child Health. 2023;2:242-252
15. IUPAC-IUB Joint Commission on Biochemical Nomenclature (JCBN). nomenclature of vitamin D. Recommendations 1981. Eur J Biochem. 1982;124:223-227
16. Christakos S, Dhawan P, Verstuyf A. et al. Vitamin D: metabolism, molecular mechanism of action, and pleiotropic effects. Physiol Rev. 2016;96:365-408
17. Jolliffe DA, Camargo CA Jr, Sluyter JD. et al. Vitamin D supplementation to prevent acute respiratory infections: a systematic review and meta-analysis of aggregate data from randomised controlled trials. Lancet Diabetes Endocrinol. 2021;9:276-292
18. Demer LL, Hsu JJ, Tintut Y. Steroid hormone vitamin D: implications for cardiovascular disease. Circ Res. 2018;122:1576-1585
19. Gaudet M, Plesa M, Mogas A. et al. Recent advances in vitamin D implications in chronic respiratory diseases. Respir Res. 2022;23:252
20. Accortt EE, Lamb A, Mirocha J. et al. Vitamin D deficiency and depressive symptoms in pregnancy are associated with adverse perinatal outcomes. J Behav Med. 2018;41:680-689
21. Huang JY, Qiu C, Miller RS. et al. Maternal birthweight is associated with subsequent risk of vitamin D deficiency in early pregnancy. Paediatr Perinat Epidemiol. 2013;27:472-480
22. Qin LL, Lu FG, Yang SH. et al. Does maternal vitamin D deficiency increase the risk of preterm birth: a meta-analysis of observational studies. Nutrients. 2016;8:301
23. Kaymak CM, ÜK E. Is there an association between vitamin D level and iron deficiency in children? Arch Argent Pediatr. 2018;116:e736-e743
24. Qiu F, Li R, Gu S. et al. The effect of iron dextran on vitamin D3 metabolism in SD rats. Nutr Metab (Lond). 2022;19:47
25. Si S, Peng Z, Cheng H. et al. Association of vitamin D in different trimester with hemoglobin during pregnancy. Nutrients. 2022;14:2455
26. Scholing JM, Olthof MR, Jonker FA. et al. Association between pre-pregnancy weight status and maternal micronutrient status in early pregnancy. Public Health Nutr. 2018;21:2046-2055
27. Suliburska J, Cholik R, Kocyłowski R. et al. Relationship between prepregnancy BMI and the concentrations of iron, calcium, and magnesium in serum and hair during the first trimester of pregnancy in women. J Trace Elem Med Biol. 2024;83:127388
28. Mayasari NR, Hu TY, Chao JC. et al. Associations of the pre-pregnancy weight status with anaemia and the erythropoiesis-related micronutrient status. Public Health Nutr. 2021;24:6247-6257
29. Das A, Bai CH, Chang JS. et al. Associations of dietary patterns and vitamin D levels with iron status in pregnant women: a cross-sectional study in Taiwan. Nutrients. 2023;15:1805
30. Nguyen NTH, Bai CH, Chang JS. et al. Association of nutrient intake and dietary patterns with serum folate and anemia-related biomarkers in Taiwanese pregnant women with pre-pregnancy overweightness or obesity. Int J Med Sci. 2025;22:1630-1639
31. Jolliffe IT, Cadima J. Principal component analysis: a review and recent developments. Philos Trans A Math Phys Eng Sci. 2016;374:20150202
32. Amare YE, Haile D. Evaluation of pulmonary function tests among pregnant women of different trimesters in Debre Berhan Referral Hospital, Shoa, Ethiopia. Int J Womens Health. 2016;12:1135-1143
33. Kurniawan AL, Hsu CY, Rau HH. et al. Dietary patterns in relation to testosterone levels and severity of impaired kidney function among middle-aged and elderly men in Taiwan: a cross-sectional study. Nutr J. 2016;18:42
34. Shrout PE, Bolger N. Mediation in experimental and nonexperimental studies: new procedures and recommendations. Psychol Methods. 2002;7:422-445
35. Jani R, Knight-Agarwal CR, Bloom M. et al. The association between pre-pregnancy body mass index, perinatal depression and maternal vitamin D status: findings from an Australian cohort study. Int J Womens Health. 2020;12:213-219
36. Bodnar LM, Catov JM, Roberts JM. et al. Prepregnancy obesity predicts poor vitamin D status in mothers and their neonates. J Nutr. 2007;137:2437-2442
37. Kareem MA. Dietary consumption with vitamin D status among pregnant women: a descriptive-analytic study. Cureus. 2023;15:e50289
38. Seoud M, Jaafar I, Kojok D. et al. Prevalence and predictive factors for vitamin D deficiency in pregnant Lebanese women: a retrospective cohort study. Gynecol Endocrinol. 2025;41:2521531
39. Park CY, Han SN. The role of vitamin D in adipose tissue biology: adipocyte differentiation, energy metabolism, and inflammation. J Lipid Atheroscler. 2021;10:130-144
40. Bernhardt GV, Shivappa P, Bernhardt K. et al. Markers of inflammation in obese pregnant women: adenosine deaminase and high sensitive C-reactive protein. Eur J Obstet Gynecol Reprod Biol X. 2022;16:100167
41. Brouzes CMC, Darcel N, Tomé D. et al. Urban Egyptian women aged 19-30 years display nutrition transition-like dietary patterns, with high energy and sodium intakes, and insufficient iron, vitamin D, and folate intakes. Curr Dev Nutr. 2020;4:nzz143
42. Blanco-Rojo R, Pérez-Granados AM, Toxqui L. et al. Relationship between vitamin D deficiency, bone remodelling and iron status in iron-deficient young women consuming an iron-fortified food. Eur J Nutr. 2013;52:695-703
43. Azizi-Soleiman F, Vafa M, Abiri B. et al. Effects of iron on vitamin D metabolism: a systematic review. Int J Prev Med. 2016;7:126
44. Cardwell G, Bornman JF, James AP. et al. A review of mushrooms as a potential source of dietary vitamin D. Nutrients. 2018;10:1498
45. Wintergerst ES, Maggini S, Hornig DH. Contribution of selected vitamins and trace elements to immune function. Ann Nutr Metab. 2007;51:301-323
46. Kim J, Lee J, Ryu MS. Cellular zinc deficiency impairs heme biosynthesis in developing erythroid progenitors. Nutrients. 2023 15
47. Killilea DW, Siekmann JH. The role of zinc in the etiology of anemia. In: Karakochuk CD, Zimmermann MB, Moretti D, eds, et al. Nutritional Anemia, 2nd ed. Cham, Switzerland: Springer Nature. 2022:187-194
48. Saper RB, Rash R. Zinc: an essential micronutrient. Am Fam Physician. 2009;79:768-772
49. Tanimura N, Liao R, Wilson GM. et al. GATA/Heme multi-omics reveals a trace metal-dependent cellular differentiation mechanism. Dev Cell. 2018;46:581-594
50. Kambe T, Tsuji T, Hashimoto A, Itsumura N. The Physiological, biochemical, and molecular roles of zinc transporters in zinc homeostasis and metabolism. Physiol Rev. 2015;95:749-784
51. Jaffe EK. The remarkable character of porphobilinogen synthase. Acc Chem Res. 2016;49:2509-2517
Author contact
![]() Corresponding author: Jane C.-J. Chao, Ph.D., School of Nutrition and Health Sciences, College of Nutrition, Taipei Medical University, 250 Wu-Hsing Street, Taipei 11031, Taiwan; Tel: +886-2-27361661 ext. 6548; Fax: +886-2-27373112; E-mail: chenjuiedu.tw.
Corresponding author: Jane C.-J. Chao, Ph.D., School of Nutrition and Health Sciences, College of Nutrition, Taipei Medical University, 250 Wu-Hsing Street, Taipei 11031, Taiwan; Tel: +886-2-27361661 ext. 6548; Fax: +886-2-27373112; E-mail: chenjuiedu.tw.