Impact Factor ISSN: 1449-1907
- Issue 9; 2026
- Issue 8; 2026
- Issue 7; 2026
- Issue 6; 2026
- Issue 5; 2026
- Volume 23; 2026
- Past Issues
- Editorial Board
- Cover Images
- Index & Coverage
- Cover Suggestion
- Special Issues
Introduction
Materials and Methods
Results
Discussion
Conclusion
Supplementary Material
Acknowledgements
References

 Global reach, higher impact
Int J Med Sci 2026; 23(5):1605-1612. doi:10.7150/ijms.128104 This issue Cite
Research Paper
Causal Association Between Body Mass Index and Kidney Stone Disease in Taiwanese: A Mendelian Randomization Study
Ming-Ru Lee1,2#, Po-Yu Hsu3#, Szu-Chia Chen4,5,6,7, Shu-Pin Huang2,8,9, Jiun-Hung Geng1,2,7,8,9 ![]()
1. Department of Urology, Kaohsiung Municipal Siaogang Hospital, Kaohsiung 812015, Taiwan.
2. Department of Urology, Kaohsiung Medical University Hospital, Kaohsiung Medical University, Kaohsiung 807378, Taiwan.
3. Department of Post-Baccalaureate Medicine, College of Medicine, Kaohsiung Medical University, Kaohsiung 807378, Taiwan.
4. Department of Internal Medicine, Kaohsiung Municipal Siaogang Hospital, Kaohsiung Medical University, Kaohsiung 812015, Taiwan.
5. Department of Internal Medicine, Division of Nephrology, Kaohsiung Medical University Hospital, Kaohsiung Medical University, Kaohsiung 807378, Taiwan.
6. Faculty of Medicine, College of Medicine, Kaohsiung Medical University, Kaohsiung 807378, Taiwan.
7. Center for Big Data Research, Kaohsiung Medical University, Kaohsiung 807378, Taiwan.
8. Graduate Institute of Clinical Medicine, College of Medicine, Kaohsiung Medical University, Kaohsiung 807378, Taiwan.
9. Department of Urology, School of Medicine, College of Medicine, Kaohsiung Medical University 807378, Kaohsiung, Taiwan.
# These authors contributed equally to this article.
Received 2025-9-21; Accepted 2026-2-25; Published 2026-3-17
Abstract

Introduction: Kidney stone disease (KSD) is a common urological disorder with an increasing incidence worldwide. Previous observational studies have reported an association between body mass index (BMI) and KSD; however, the causal relationship remains uncertain, particularly in Asian populations. This study aimed to investigate the causal effect of BMI on KSD risk in Taiwanese individuals using a Mendelian randomization (MR) approach.
Materials and Methods: BMI-associated single nucleotide polymorphisms (SNPs) were identified through a literature review and validated in Taiwanese cohorts (n = 107,191). Significant SNPs (P-value < 0.05) were selected as instrumental variables for MR analysis, with KSD as the outcome. Several MR methods, including inverse variance weighted (IVW), median-based, robust, and MR-Egger approaches, were applied to estimate the causal effect.
Results: A total of 17 BMI-associated SNPs validated in the Taiwanese cohort were used as instrumental variables in the MR analysis. The penalized IVW model demonstrated a significant positive association between genetically predicted BMI and KSD risk (OR = 2.16, 95% CI: 1.22-3.81, P-value = 0.008). Similar results were observed using robust IVW (OR = 2.13, 95% CI: 1.25-3.62, P-value = 0.005) and weighted median approaches (P-value = 0.050 and 0.042). No evidence of directional pleiotropy was detected.
Conclusion: Our findings provide genetic evidence supporting a causal association between higher BMI and increased KSD risk in Taiwanese individuals, suggesting that weight management may play an important role in KSD prevention. Further studies are needed to investigate the underlying biological mechanisms, population-specific genetic susceptibilities, and effective preventive strategies for obesity-related KSD.
Keywords: kidney stone disease, body mass index, Mendelian randomization, single nucleotide polymorphisms, genetic instrumental variables, obesity, Taiwanese population
Introduction
Kidney stone disease (KSD) is a common and increasingly prevalent urological condition that imposes a significant healthcare burden globally. [1] It is characterized by the formation of calculi within the urinary tract, often leading to acute pain, hematuria, urinary tract obstruction, and recurrent hospitalizations. [2, 3] The global prevalence of KSD is estimated to range from 5% to 15%, with notable regional and ethnic differences. [1, 4] In Taiwan, the incidence of KSD has shown a steady rise over recent decades, possibly driven by changes in diet, lifestyle, and comorbidity profiles. [5] Identifying modifiable risk factors is essential to developing effective preventive strategies and reducing the disease burden.
Obesity, often measured by body mass index (BMI), has emerged as a potential risk factor for KSD in multiple observational studies. [6-8] Obese individuals have been shown to have a higher risk of developing kidney stones due to alterations in urinary composition, including increased excretion of calcium, oxalate, uric acid, and other lithogenic factors. [7] However, most evidence linking BMI and KSD has been derived from observational studies, which are susceptible to residual confounding, reverse causation, and measurement bias. [9] The true causal relationship between BMI and KSD, especially in Asian populations, remains unclear. This is of particular importance since Asian individuals, including Taiwanese, may differ in genetic backgrounds, body composition, and stone composition compared to Western populations. [10, 11]
Mendelian Randomization (MR) offers a powerful approach to overcoming the limitations of observational research by leveraging genetic variants as instrumental variables (IVs) to infer causality. [12] Since genetic variants are randomly assigned at conception and generally not affected by confounders, MR mimics the design of a natural randomized controlled trial. [13, 14] Prior MR studies in Western populations have suggested a possible causal role of higher BMI in increasing the risk of KSD. [15] However, the generalizability of these findings to East Asian populations, such as Taiwanese, is uncertain due to ethnic-specific genetic and environmental differences. Notably, few, if any, MR studies have directly addressed the BMI-KSD relationship in Taiwanese individuals.
In this study, we aimed to investigate the causal relationship between BMI and KSD in a Taiwanese population using MR approach, including inverse variance weighted (IVW), penalized and robust models, as well as MR-Egger regression, were applied to ensure robustness and sensitivity of the causal estimates. By doing so, we sought to provide more definitive evidence on whether BMI plays a causal role in the risk of KSD in Taiwanese individuals, which may inform public health strategies and clinical management focused on weight control for KSD prevention.
Materials and Methods
Study Population and Cohort Description
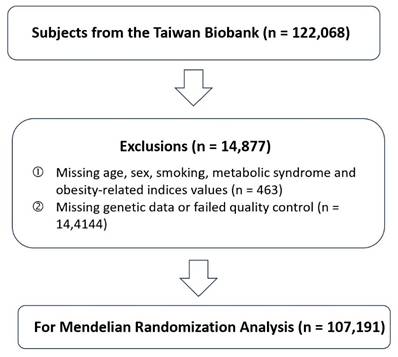
A total of 122,068 participants from the Taiwan Biobank (TWB) were initially considered for inclusion and detailed information about the TWB has been described in previous publications. [16-21] Participants with missing information on key variables, including age, sex, smoking status, metabolic syndrome, or obesity-related indices, were excluded (n = 463). In addition, individuals with incomplete or low-quality genetic data were removed from the analysis (n = 14,414). After these exclusions, 107,191 participants remained and were included in the MR analysis (Figure 1). Detailed phenotypic information, including height, weight, and KSD diagnosis, was collected through structured interviews, clinical examination, and linked health records. BMI was calculated as weight in kilograms divided by height in meters squared (kg/m²). The diagnosis of KSD was based on self-report diagnosed KSD. All participants provided written informed consent, and the study protocol was approved by the Institutional Review Board of the affiliated research institutions (KMUHIRB-E(I)-20210058).
Flowchart of Participant Selection for Mendelian Randomization Analysis. This flowchart illustrates the selection process of study participants from the Taiwan Biobank. A total of 122,068 individuals were initially enrolled. After excluding participants with missing demographic, lifestyle, or metabolic information (n = 463) and those with missing or low-quality genetic data (n = 14,414), 107,191 participants remained eligible and were included in the Mendelian randomization (MR) analysis.
Genotyping and Quality Control
Genotyping data were obtained using the customized Axiom TWB 2.0 array platform. [18] Rigorous quality control (QC) measures were implemented to ensure data reliability. Single nucleotide polymorphisms (SNPs) were filtered out if they exhibited a call rate below 98%, a minor allele frequency (MAF) less than 1%, or significant deviation from Hardy-Weinberg equilibrium (P-value < 1×10⁻⁶). In addition, individuals showing unexpected relatedness, discrepancies between reported and genetic sex, or genotype call rates lower than 95% were excluded from further analyses.
Selection and Validation of Instrumental Variables
We extracted SNPs significantly associated with BMI from the GWAS catalog [22] and further validated their effects in our Taiwanese cohort. Thirty-six independent SNPs were selected based on linkage disequilibrium pruning (r² < 0.01) and their biological relevance to BMI. Variants that met the genome-wide significance threshold (P-value < 1×10⁻⁸) and demonstrated consistent effect directions in our population were retained as instrumental variables. Details of each SNP, including effect allele, beta coefficient, standard error, and minor allele frequency, are presented in Supplementary Tables 1 and 2.
Instrument strength was assessed using the F-statistic calculated as  , where β and SE represent the SNP-BMI association estimates in the Taiwanese cohort. Across the 17 validated SNPs included in the primary analysis, the mean F-statistic was 12.29 (range 4.05-38.02) (Supplementary Table 3).
Observational Association Between BMI and KSD
To evaluate the observational association between BMI and KSD, univariate and multivariate logistic regression models were constructed. Odds ratios (ORs) with 95% confidence intervals (CIs) were estimated. The multivariate model adjusted for age, sex, smoking status, and metabolic syndrome. BMI was modeled as a continuous variable.
Mendelian Randomization Analyses
MR analyses were performed using multiple complementary statistical approaches to estimate the causal effect of genetically predicted BMI on the risk of KSD. The IVW method served as the primary analysis under the assumption that all instruments were valid. To assess the robustness of the findings and account for potential pleiotropy, several additional estimators were applied, including the simple median, weighted median, and penalized weighted median methods, the latter two providing reliable estimates even when up to 50% of the weight comes from invalid instruments. MR-Egger regression was used to evaluate directional pleiotropy through its intercept term, while robust IVW and penalized robust IVW methods were applied to mitigate the influence of outlier variants. Causal estimates were expressed as ORs with corresponding 95% CIs and P-values. Heterogeneity and directional pleiotropy were assessed using the MR-Egger intercept test. All analyses were conducted in R (version 4.5.2; R Foundation for Statistical Computing, Vienna, Austria) using the MendelianRandomization package (version 0.10.0). [23] Because genetic variants are randomly allocated at conception, MR analyses were performed without adjustment for conventional confounders such as age, sex, or smoking status.
Sensitivity Analyses
Sensitivity analyses were conducted to examine the robustness of the MR results. The MR-PRESSO (Pleiotropy Residual Sum and Outlier) test was used to detect horizontal pleiotropy and identify potential outlier SNPs. Both the raw and outlier-corrected MR-PRESSO estimates were obtained, and the global test statistic was used to evaluate the overall presence of pleiotropy. To further account for the potential impact of multiple testing during SNP validation, an additional sensitivity analysis was performed using a Bonferroni-corrected threshold. Specifically, SNPs that did not meet the significance criterion of P-value < 0.0029 in the Taiwanese cohort were excluded, and the MR analyses were repeated using only the remaining variants.
Statistical Analyses
Continuous variables were presented as mean values with corresponding standard deviations, while categorical variables were expressed as frequencies and percentages. Differences between participants with and without KSD were assessed using independent t-tests for continuous variables and chi-square tests for categorical variables. MR analyses were conducted in R (version 4.5.2; R Foundation for Statistical Computing, Vienna, Austria) and Rstudio (version 2025.09.0; Posit Software, PBC, Boston, MA, USA), using customized scripts for sensitivity testing and assessment of instrument strength.
Results
Clinical Characteristics of the Study Population
Our study population included 107,191 participants, with a mean age of 49.9 years and a mean BMI of 24.2 kg/m². Among them, 68,620 were female and 38,571 were male (Table 1). In addition, 27.2% had a history of smoking, and 22.5% met the criteria for metabolic syndrome. When separating participants with and without KSD, 6,868 and 100,323 individuals were identified, respectively. Participants with KSD were older (mean age 53.7 vs. 49.6 years) and had higher BMI (25.3 vs. 24.1 kg/m²), a greater prevalence of smoking history (41.5% vs. 26.3%) and metabolic syndrome (33.3% vs. 21.8%), and a higher proportion of males (60.1% vs. 34.3%) compared with those without KSD (Table 1).
Baseline characteristics of the study population.
| Variable | Overall (N = 107,191) | Non-KSD (N = 100,323) | KSD (N = 6,868) | P-value |
|---|---|---|---|---|
| Sex, n (%) | < 0.001 | |||
| Male | 38,571 (36.0) | 34,443 (34.3) | 4,128 (60.1) | |
| Female | 68,620 (64.0) | 65,880 (65.7) | 2,740 (39.9) | |
| Age, mean (SD), years | 49.9 (10.9) | 49.6 (11.0) | 53.7 (9.7) | < 0.001 |
| Smoking experience, n (%) | < 0.001 | |||
| No | 78,004 (72.8) | 73,988 (73.7) | 4,016 (58.5) | |
| Yes | 29,187 (27.2) | 26,335 (26.3) | 2,852 (41.5) | |
| BMI, mean (SD), kg/m² | 24.2 (3.8) | 24.1 (3.8) | 25.3 (3.8) | < 0.001 |
| Metabolic syndrome, n (%) | < 0.001 | |||
| No | 83,028 (77.5) | 78,449 (78.2) | 4,579 (66.7) | |
| Yes | 24,163 (22.5) | 21,874 (21.8) | 2,289 (33.3) |
Abbreviations: KSD = Kidney stone disease; BMI = Body mass index; SD = Standard deviation.
Association Between BMI and KSD
To further examine the association between BMI and KSD, we performed a multivariate logistic regression analysis adjusted for sex, age, smoking history, and the presence of metabolic syndrome (Table 2). BMI was significantly associated with higher odds of having KSD (Adjusted OR = 1.03, 95% CI = 1.02-1.04, P-value < 0.001), indicating that individuals with higher BMI were more likely to have KSD.
Multivariate logistic regression analysis of risk factors associated with kidney stone disease.
| Variables | Adjusted OR | 95% CI | P-value |
|---|---|---|---|
| Female sex (vs. male) | 0.43 | 0.40-0.46 | < 0.001 |
| Age (per 1-year increase) | 1.03 | 1.03-1.03 | < 0.001 |
| Smoking (yes vs. no) | 1.13 | 1.07-1.20 | < 0.001 |
| BMI (per 1 kg/m² increase) | 1.03 | 1.02-1.04 | < 0.001 |
| Metabolic syndrome (yes vs. no) | 1.15 | 1.08-1.22 | < 0.001 |
Abbreviations: OR = odds ratio; CI = confidence interval; BMI = body mass index.
Note: Adjusted for sex, age, smoking status, BMI, and metabolic syndrome.
Validation of BMI-Associated Genetic Variants in the Taiwanese Cohort
Among the 36 BMI-associated SNPs identified from previous genome-wide association studies (Supplementary Tables 1 and 2) [22], 17 passed quality control and were validated at the significance threshold (P-value < 0.05) in the Taiwanese cohort (Table 3). These validated variants were distributed across multiple chromosomes and exhibited consistent effect directions with previously reported BMI associations. Several SNPs demonstrated particularly strong associations with BMI in the Taiwanese population, including rs4077410 (TAOK2, Chr 16, β = 0.1011, P-value = 6.89 × 10⁻¹⁰, MAF = 0.4392), rs591120 (SEC16B, Chr 1, β = 0.0818, P-value = 4.82 × 10⁻⁶, MAF = 0.2986), rs9891146 (C17orf58, Chr 17, β = -0.0955, P-value = 1.89 × 10⁻⁷, MAF = 0.2851), and rs1064608 (MTCH2, Chr 11, β = 0.0700, P-value = 9.67 × 10⁻⁵, MAF = 0.2928 (Table 3 and Supplementary Table 4). The direction and magnitude of these effects were comparable to findings in previous GWAS, supporting the robustness of these genetic instruments. Using these validated SNPs as instrumental variables, subsequent MR analyses were conducted to estimate the causal effect of genetically predicted BMI on the risk of KSD.
Validation of BMI-Associated SNPs in the Taiwanese Cohort showing significant P-values
| SNP ID | Chr | Position (hg38) | Mapped Gene(s) | Effect Allele | Other Allele | MAF | β (BMI) | SE | P-value |
|---|---|---|---|---|---|---|---|---|---|
| rs2297792 | 1 | 156041653 | UBQLN4 | C | T | 0.1157 | 0.1025 | 0.0254 | 5.58×10⁻⁵ |
| rs591120 | 1 | 177933618 | SEC16B | C | G | 0.2986 | 0.0818 | 0.0179 | 4.82×10⁻⁶ |
| rs2230590 | 3 | 49898669 | MST1R | C | T | 0.1413 | 0.0821 | 0.0235 | 4.85×10⁻⁴ |
| rs1052618 | 3 | 136855659 | SLC35G2 | A | G | 0.1322 | -0.0504 | 0.0241 | 0.0362 |
| rs9438 | 3 | 154301098 | DHX36 | C | G | 0.4499 | 0.0330 | 0.0164 | 0.0440 |
| rs11755393 | 6 | 34856859 | BLTP3A | G | A | 0.4907 | 0.0430 | 0.0163 | 0.0084 |
| rs10829163 | 10 | 27028911 | ANKRD26 | C | T | 0.4388 | -0.0385 | 0.0164 | 0.0190 |
| rs284860 | 10 | 102813206 | WBP1L | C | T | 0.3987 | -0.0439 | 0.0168 | 0.0089 |
| rs11042023 | 11 | 8640969 | TRIM66 | C | T | 0.4086 | 0.0386 | 0.0166 | 0.0202 |
| rs11555762 | 11 | 43855148 | HSD17B12 | T | C | 0.2628 | 0.0453 | 0.0186 | 0.0149 |
| rs1064608 | 11 | 47618877 | MTCH2 | C | G | 0.2928 | 0.0700 | 0.0180 | 9.67×10⁻⁵ |
| rs12828016 | 12 | 889199 | WNK1 | T | G | 0.2758 | -0.0400 | 0.0182 | 0.0281 |
| rs1131877 | 14 | 102875712 | TRAF3 | C | T | 0.3958 | 0.0530 | 0.0167 | 0.0015 |
| rs11071896 | 15 | 66528912 | ZWILCH | G | A | 0.1706 | -0.0451 | 0.0217 | 0.0376 |
| rs4077410 | 16 | 29986879 | TAOK2 | G | A | 0.4392 | 0.1011 | 0.0164 | 6.89×10⁻¹⁰ |
| rs2306590 | 17 | 36498436 | MYO19 | A | G | 0.3097 | -0.0694 | 0.0177 | 8.79×10⁻⁵ |
| rs9891146 | 17 | 67991933 | C17orf58 | C | T | 0.2851 | -0.0955 | 0.0183 | 1.89×10⁻⁷ |
β represents the per-allele effect size on BMI (kg/m²) in the Taiwanese validation cohort. MAF denotes minor allele frequency. Detailed genomic context and functional annotations are provided in Supplementary Tables 1-3.
Abbreviations: SNP = single nucleotide polymorphism; Chr = chromosome; MAF = minor allele frequency; SE = standard error; BMI = body mass index.
Causal Effect of Genetically Predicted BMI on KSD
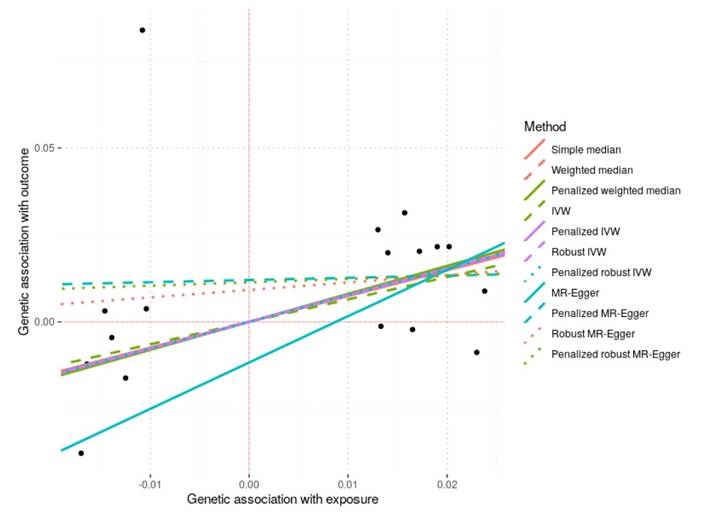
MR analyses were conducted using the 17 BMI-associated SNPs validated in the Taiwanese cohort to assess the causal effect of genetically predicted BMI on KSD (Table 4A and 4B, Figure 2). The IVW method suggested a positive causal effect (OR = 1.91, 95% CI = 0.99-3.67, P-value = 0.054), which reached statistical significance in the penalized IVW (OR = 2.16, 95% CI = 1.22-3.81, P-value = 0.008) and robust IVW analyses (OR = 2.13, 95% CI = 1.25-3.62, P-value = 0.005). Consistent findings were observed with the weighted median and penalized weighted median methods (P-value = 0.050 and 0.042, respectively), supporting the robustness of the association. MR-Egger regression yielded a directionally similar but imprecise estimate (OR = 3.78, 95% CI = 0.18-78.5, P-value = 0.389). No evidence of directional horizontal pleiotropy was detected based on MR-Egger intercept tests (all P-value > 0.05).
Scatter Plot of Mendelian Randomization Analyses for the Effect of Genetically Predicted BMI on KSD. Each black point represents the genetic association of an individual BMI-associated SNP with kidney stone disease (KSD) on the y-axis versus its association with body mass index (BMI) on the x-axis. The fitted lines correspond to causal estimates obtained from different Mendelian randomization (MR) methods, including simple median, weighted median, penalized weighted median, inverse-variance weighted (IVW), penalized IVW, robust IVW, penalized robust IVW, MR-Egger, penalized MR-Egger, robust MR-Egger, and penalized robust MR-Egger. A positive slope indicates a positive causal effect of genetically predicted BMI on the risk of KSD. The overall consistency across methods supports the reliability of the causal association.
Causal Effect Estimates. Mendelian Randomization Estimates for the Effect of Genetically Predicted BMI on KSD
| Method | OR | 95% CI | P-value |
|---|---|---|---|
| IVW | 1.91 | 0.99-3.67 | 0.054 |
| Penalized IVW | 2.16 | 1.22-3.81 | 0.008 |
| Robust IVW | 2.13 | 1.25-3.62 | 0.005 |
| Penalized robust IVW | 2.15 | 1.22-3.80 | 0.008 |
| Weighted median | 2.17 | 1.00-4.72 | 0.050 |
| Penalized weighted median | 2.24 | 1.03-4.86 | 0.042 |
| Simple median | 2.10 | 0.92-4.76 | 0.076 |
| MR-Egger (slope) | 3.78 | 0.18-78.5 | 0.389 |
When restricting the analysis to SNPs meeting the Bonferroni-corrected threshold (P-value < 0.0029), eight variants remained as instrumental variables (Supplementary Table 5). MR analyses using this reduced set of SNPs yielded effect estimates that were directionally consistent with the primary analysis but were no longer statistically significant, reflecting the reduced statistical power associated with fewer instruments (Supplementary Tables 5-6 and Supplementary Figure 1).
Sensitivity Analysis and Assessment of Horizontal Pleiotropy
Sensitivity analyses using MR-PRESSO detected evidence of horizontal pleiotropy (global test: RSSobs = 2015.87, P-value < 0.001); however, after outlier correction, the causal estimate remained directionally consistent and nonsignificant changes were observed (raw estimate = 0.17, P-value = 0.25; outlier-corrected estimate = 0.49, P-value = 0.27), suggesting that no single variant disproportionately influenced the overall result (Table 5). MR-Egger intercept tests also indicated no evidence of directional pleiotropy (P-value > 0.05) (Table 4B). Although MR-PRESSO suggested the presence of heterogeneity among SNPs, this does not necessarily imply directional pleiotropy but may reflect variability in SNP-specific causal estimates.
Assessment of Horizontal Pleiotropy. Mendelian Randomization Estimates for the Effect of Genetically Predicted BMI on KSD
| Method | Intercept (β) | SE | P-value |
|---|---|---|---|
| MR-Egger | -0.0117 | 0.0256 | 0.649 |
| Penalized MR-Egger | 0.0120 | 0.0226 | 0.595 |
| Robust MR-Egger | 0.0092 | 0.0182 | 0.614 |
| Penalized robust MR-Egger | 0.0114 | 0.0189 | 0.548 |
Effect estimates are presented as odds ratios (ORs) with 95% confidence intervals (CIs) for kidney stone disease per 1-unit increase in genetically predicted BMI, consistent with the scale of the SNP-BMI association used in the instrumental variable analysis.
MR models were not adjusted for demographic or clinical covariates, as genetic instrumental variables are assumed to be randomly allocated at conception and therefore independent of these potential confounders.
Abbreviations: BMI = body mass index; MR = Mendelian randomization; OR = odds ratio; CI = confidence interval; SE = standard error; IVW = inverse-variance weighted; MR-Egger = Mendelian randomization Egger regression.
Sensitivity Analyses for Pleiotropy and Outlier Correction
| Analysis | Causal Estimate | SD | T-stat | P-value |
|---|---|---|---|---|
| Raw MR-PRESSO estimate | 0.169 | 0.143 | 1.184 | 0.254 |
| Outlier-corrected MR-PRESSO estimate | 0.486 | 0.360 | 1.349 | 0.270 |
| Test | Statistic | P-value | ||
| MR-PRESSO global test (RSSobs) | 2015.87 | <0.001 | ||
Abbreviations: MR-PRESSO = Mendelian randomization pleiotropy residual sum and outlier; SD = standard deviation; RSSobs = observed residual sum of squares.
Discussion
This study results provide robust genetic evidence, which supports a positive association between genetically predicted BMI and risk of KSD in a Taiwanese population. These findings underscore the importance of weight management as a preventive strategy against KSD, particularly within East Asian populations where evidence on this relationship has previously been limited.
Several observational studies have consistently reported associations between obesity or increased BMI and KSD risk. [6-8] A transnational meta-analysis including 8 cohort studies found that per 5 kg/m2 increase in BMI increased the risk of kidney stones formation by 21%, and this association remained robust after removing of heterogenous studies. [24] Another cohort study with about 270,000 North-East Asian population, showed obesity were associated with an increased risk of kidney stones after a median of 4-year follow-up period. [25] Despite these observational correlations, residual confounding and reverse causation issues have made causal inference challenging. [9]
In the present study, MR was used to better evaluate whether the association between BMI and KSD may reflect a causal relationship. Because genetic variants are randomly assigned at conception according to Mendel's laws of inheritance [14], they are less likely to be influenced by lifestyle or environmental confounding factors. Using BMI-associated genetic variants as instruments, we observed consistent results across IVW, robust IVW, and median-based methods, suggesting that higher genetically predicted BMI is associated with an increased risk of KSD. Although MR-Egger regression was not statistically significant, no evidence of directional pleiotropy was detected. Overall, these findings support a likely causal relationship between higher BMI and KSD risk in this Taiwanese population.
Our findings are consistent with prior MR studies conducted primarily in Western populations. Shuai Yuan et al demonstrated a high BMI and type 2 diabetes were causally associated with an elevated risk of kidney stones in two independent population. [15] Moreover, the magnitude of this causal relationship observed in our study highlights potential ethnic differences in genetic susceptibility of BMI-related risk. Such differences could reflect variations in genetic architecture, dietary patterns, metabolic profiles, or urinary compositions specific to Asian populations. Further genetic and epidemiological studies across diverse ethnicities are warranted to clarify these population-specific relationships and identify underlying mechanisms.
Although the present study did not directly examine biological pathways, several plausible mechanisms have been proposed in previous studies that may help explain the relationship between obesity and KSD. [1] Higher BMI is known to alter urinary biochemical profiles, not only promoting stone formation through increased excretion of lithogenic substances such as calcium, oxalate, and uric acid, but also decrease concentration of anti-lithogenic substance such as citrate in urine. Obesity-related insulin resistance and metabolic syndrome contribute to altered renal handling of electrolytes and urinary acidification, resulting in a lower urine pH level and lithogenic urinary environment. [7, 26] Furthermore, chronic inflammation and oxidative stress that are closely associated with obesity related adiposity also play a role in kidney stones formation. [27, 28] Moreover, the obesity-related hormonal changes, particularly in adipokines such as leptin and adiponectin, could modulate renal tubular function and stone-forming processes. Leptin, often elevated in obese individuals, has been suggested to influence renal calcium transport and excretion negatively. [29] Conversely, adiponectin levels, typically reduced in obesity, play protective roles against insulin resistance and inflammation, both critical in preventing stone formation. [30] Taken together, these mechanisms may partially explain the observed relationship between BMI and KSD. However, these mechanisms remain hypothesis-generating and require further experimental and clinical studies to confirm.
The robust methodology employed in this study, particularly the rigorous selection and validation of instrumental SNPs, strengthens the validity of results. Nevertheless, some limitations warrant consideration. Firstly, our analyses were limited to common SNPs identified through GWAS, potentially overlooking rarer genetic variants with larger effects. Future genetic studies using whole-exome or whole-genome sequencing may reveal additional instrumental variables with stronger or more direct biological relevance. Secondly, the MR approach relies on several critical assumptions, primarily the absence of horizontal pleiotropy, where genetic variants influence KSD risk through pathways other than BMI. Although our sensitivity analyses and MR-Egger intercept tests suggested minimal pleiotropy, the possibility of residual pleiotropic effects cannot be entirely dismissed. Future studies integrating omics data could provide deeper insights into the pleiotropic mechanisms and help refine causal estimates. Thirdly, both the SNP-BMI and SNP-KSD associations were estimated within the same TWB dataset, resulting in a one-sample MR design. In contrast to two-sample MR, weak instrument bias in one-sample MR may bias causal estimates toward the corresponding observational association. Although the mean F-statistic indicated generally acceptable instrument strength, residual bias cannot be entirely excluded. Therefore, the magnitude of the causal estimates should be interpreted cautiously. Fourthly, KSD was defined based on self-reported physician-diagnosed history in the Taiwan Biobank, which may introduce outcome misclassification. However, such misclassification is likely to be non-differential with respect to genetic variants and would tend to bias MR estimates toward the null rather than generate spurious associations. Fifthly, because the genetic instruments, exposure distributions, and outcome ascertainment were derived from the TWB, the findings should be interpreted primarily within the Taiwanese population. Replication in other ethnic and geographic populations will be necessary to determine the generalizability of these results. Finally, BMI as a single measure of adiposity might not fully capture the complexity of obesity, particularly body fat distribution and metabolic health. Metrics such as waist circumference, visceral fat measurements, and metabolic parameters might provide more detailed insights into obesity-related KSD risks in future studies.
Clinically, our study emphasizes BMI control as a potentially effective intervention strategy for reducing KSD risk. Given the rising trends in obesity and KSD prevalence globally, integrating weight management programs with standard urological care could substantially impact public health outcomes. Future research could explore personalized intervention strategies targeting genetically susceptible individuals, aiming for more precise prevention of KSD through weight management and lifestyle modifications.
Conclusion
In conclusion, our MR study provides genetic evidence suggesting that higher BMI may causally increase the risk of KSD in Taiwanese individuals. The consistency of the findings across multiple MR methods supports the robustness of the observed association. These results suggest that weight management may play an important role in KSD prevention. Further research exploring underlying biological mechanisms, ethnic-specific genetic susceptibility, and preventive strategies is warranted to better understand and mitigate the burden of KSD associated with obesity.
Supplementary Material
Supplementary figures and tables.
Acknowledgements
The authors thank the Division of Medical Statistics and Bioinformatics, Department of Medical Research, Kaohsiung Medical University Hospital, for their valuable statistical and methodological support. This work was supported by the Research Center for Environmental Medicine, Kaohsiung Medical University, and by the Featured Areas Research Center Program under the Higher Education Sprout Project of the Ministry of Education (MOE), Taiwan. Additional funding was provided by research grants from the Ministry of Science and Technology and the National Science and Technology Council (NSTC114-2314-B-037-025; NSTC114-2314-B-037-024; MOST 111-2314-B-037-061; MOST 112-2314-B-037-115-MY2), the Kaohsiung Medical University Research Center (KMU-TC109A01-1; NHRIKMU-113-I001; KMUH112-2R59; KMU-TC114B05), and Kaohsiung Municipal Siaogang Hospital (S-108-017; S-111-16; kmhk-112-23; S-112-01; H-113-10; I-113-01; S-113-01; kmhk-113-06).
Funding
This work was partially supported by the Research Center for Environmental Medicine, Kaohsiung Medical University, Kaohsiung, Taiwan, and the Featured Areas Research Center Program within the framework of the Higher Education Sprout Project by the Ministry of Education (MOE) in Taiwan and the Ministry of Science and Technology research grant in Taiwan (NSTC114-2314-B-037-025, NSTC114-2314-B-037-024, MOST 111-2314-B-037-061 and MOST 112-2314-B-037-115-MY2); the Kaohsiung Medical University Research Center Grant (KMU-TC109A01-1; NHRIKMU-113-I001; KMUH112-2R59); and Kaohsiung Municipal Siaogang Hospital (S-108-017; S-111-16; kmhk-112-23; S-112-01; H-113-10; I-113-01; S-113-01; kmhk-113-06).
Ethical approval
The study was conducted according to the Declaration of Helsinki, and it was granted approval by the Institutional Review Board of Kaohsiung Medical University Hospital (KMUHIRB-E(I)-20210058), and the TWB was granted approval by the IRB on Biomedical Science Research, Academia Sinica, Taiwan and the Ethics and Governance Council of the TWB.
Availability of data and materials
The data underlying this study are from the Taiwan Biobank. Due to restrictions placed on the data by the Personal Information Protection Act of Taiwan, the minimal data set cannot be made publicly available. Data may be available upon request to interested researchers. Please send data requests to: Jiun-Hung Geng, MD. Department of Urology, Kaohsiung Municipal Siaogang Hospital.
Competing Interests
The authors have declared that no competing interest exists.
References
1. Khan SR, Pearle MS, Robertson WG. et al. Kidney stones. Nat Rev Dis Primers. 2016;2:16008
2. Shastri S, Patel J, Sambandam KK, Lederer ED. Kidney Stone Pathophysiology, Evaluation and Management: Core Curriculum 2023. Am J Kidney Dis. 2023;82(5):617-634
3. Teichman JM. Clinical practice. Acute renal colic from ureteral calculus. N Engl J Med. 2004;350(7):684-693
4. Skolarikos A, Geraghty R, Somani B. et al. European Association of Urology Guidelines on the Diagnosis and Treatment of Urolithiasis. Eur Urol. 2025;88(1):64-75
5. Huang WY, Chen YF, Carter S, Chang HC, Lan CF, Huang KH. Epidemiology of upper urinary tract stone disease in a Taiwanese population: a nationwide, population based study. J Urol. 2013;189(6):2158-2163
6. Li W, Huang J, Liu Z. et al. Trends in the prevalence of kidney stones among U.S. adults with obesity from 2007 to 2020. Int J Surg. 2025;111(9):5843-5851
7. Shavit L, Ferraro PM, Johri N. et al. Effect of being overweight on urinary metabolic risk factors for kidney stone formation. Nephrol Dial Transplant. 2015;30(4):607-613
8. Taylor EN, Stampfer MJ, Curhan GC. Obesity, weight gain, and the risk of kidney stones. Jama. 2005;293(4):455-462
9. Dahabreh IJ, Bibbins-Domingo K. Causal Inference About the Effects of Interventions From Observational Studies in Medical Journals. Jama. 2024;331(21):1845-1853
10. Ye Z, Zeng G, Yang H. et al. The status and characteristics of urinary stone composition in China. BJU Int. 2020;125(6):801-809
11. Siener R, Herwig H, Rüdy J, Schaefer RM, Lossin P, Hesse A. Urinary stone composition in Germany: results from 45,783 stone analyses. World J Urol. 2022;40(7):1813-1820
12. Venkataramani AS, Bair EF. Natural Experiments to Inform Clinical Practice. NEJM Evid. 2025;4(5):EVIDra2400268
13. Skrivankova VW, Richmond RC, Woolf BAR. et al. Strengthening the Reporting of Observational Studies in Epidemiology Using Mendelian Randomization: The STROBE-MR Statement. Jama. 2021;326(16):1614-1621
14. Sanderson E, Glymour MM, Holmes MV. et al. Mendelian randomization. Nat Rev Methods Primers. 2022 2
15. Yuan S, Larsson SC. Assessing causal associations of obesity and diabetes with kidney stones using Mendelian randomization analysis. Mol Genet Metab. 2021;134(1-2):212-215
16. Chen TY, Geng JH, Chen SC, Lee JI. Living alone is associated with a higher prevalence of psychiatric morbidity in a population-based cross-sectional study. Front Public Health. 2022;10:1054615
17. Chen YH, Lee JI, Shen JT. et al. The impact of secondhand smoke on the development of kidney stone disease is not inferior to that of smoking: a longitudinal cohort study. BMC Public Health. 2023;23(1):1189
18. Ho CY, Lee JI, Huang SP, Chen SC, Geng JH. A Genome-Wide Association Study of Metabolic Syndrome in the Taiwanese Population. Nutrients. 2023 16(1)
19. Lee MR, Ke HL, Huang JC, Huang SP, Geng JH. Obesity-related indices and its association with kidney stone disease: a cross-sectional and longitudinal cohort study. Urolithiasis. 2022;50(1):55-63
20. Ou YJ, Lee JI, Huang SP, Chen SC, Geng JH, Su CH. Association between Menopause, Postmenopausal Hormone Therapy and Metabolic Syndrome. J Clin Med. 2023 12(13)
21. Tang TY, Lee JI, Shen JT. et al. The association between menopause, postmenopausal hormone therapy, and kidney stone disease in Taiwanese women. Ann Epidemiol. 2023;78:13-18
22. Turcot V, Lu Y, Highland HM. et al. Protein-altering variants associated with body mass index implicate pathways that control energy intake and expenditure in obesity. Nat Genet. 2018;50(1):26-41
23. Yavorska OO, Burgess S. MendelianRandomization: an R package for performing Mendelian randomization analyses using summarized data. Int J Epidemiol. 2017;46(6):1734-1739
24. Trinchieri A. Body fatness, diabetes, physical activity and risk of kidney stones: a systematic review and meta-analysis of cohort studies. Eur J Epidemiol. 2019;34(12):1175-1176
25. Kim S, Chang Y, Yun KE. et al. Metabolically healthy and unhealthy obesity phenotypes and risk of renal stone: a cohort study. Int J Obes (Lond). 2019;43(4):852-861
26. Eisner BH, Eisenberg ML, Stoller ML. Relationship between body mass index and quantitative 24-hour urine chemistries in patients with nephrolithiasis. Urology. 2010;75(6):1289-1293
27. Sakhaee K. Unraveling the mechanisms of obesity-induced hyperoxaluria. Kidney Int. 2018;93(5):1038-1040
28. Poore W, Boyd CJ, Singh NP, Wood K, Gower B, Assimos DG. Obesity and Its Impact on Kidney Stone Formation. Rev Urol. 2020;22(1):17-23
29. Hall JE, do Carmo JM, da Silva AA, Wang Z, Hall ME. Obesity, kidney dysfunction and hypertension: mechanistic links. Nat Rev Nephrol. 2019;15(6):367-385
30. Rutkowski JM, Pastor J, Sun K. et al. Adiponectin alters renal calcium and phosphate excretion through regulation of klotho expression. Kidney Int. 2017;91(2):324-337
Author contact
![]() Corresponding author: Jiun-Hung Geng, Department of Urology, Kaohsiung Municipal Siaogang Hospital, Kaohsiung, Taiwan. No. 482, Shanming Rd, Xiaogang District, Kaohsiung City 812, Taiwan. Tel. +886(7)3208212. Fax: +886(7)3211033. E-mail: u9001090com.
Corresponding author: Jiun-Hung Geng, Department of Urology, Kaohsiung Municipal Siaogang Hospital, Kaohsiung, Taiwan. No. 482, Shanming Rd, Xiaogang District, Kaohsiung City 812, Taiwan. Tel. +886(7)3208212. Fax: +886(7)3211033. E-mail: u9001090com.