Impact Factor ISSN: 1449-1907

 Global reach, higher impact
Int J Med Sci 2011; 8(1):56-67. doi:10.7150/ijms.8.56 This issue Cite
Research Paper
Helicobacter pylori induces mitochondrial DNA mutation and reactive oxygen species level in AGS cells
Xue-Wen Huang 1,* ![]() , Rui-Hua Luo2,*, Qi Zhao 3, Zhong-Ze Shen 4, Li-Li Huang 1, Xian-Yuan An1, Lan-Jing Zhao 1, Jie Wang 5, Yu-Zheng Huang5
, Rui-Hua Luo2,*, Qi Zhao 3, Zhong-Ze Shen 4, Li-Li Huang 1, Xian-Yuan An1, Lan-Jing Zhao 1, Jie Wang 5, Yu-Zheng Huang5
1. Department of Clinical Laboratory, Huadong Sanatorium, Wuxi, Jiangsu Province 214065, China
2. Department of Gastroscopy, Huadong Sanatorium, Wuxi, Jiangsu Province 214065, China
3. Department of Clinical Laboratory, People's Hospital, Wuxi, Jiangsu Province 214023, China
4. Jiangsu Internation Travel Healthcare Center, Yangzhou Branch, Yangzhou, Jiangsu Province 225009, China
5. Jiangsu Institute of Parasitic Diseases, Wuxi, Jiangsu Province 214063, China
* Xue-wen Huang and Rui-hua Luo are co-first authors.
Received 2010-11-2; Accepted 2011-1-1; Published 2011-1-8
Abstract
To investigate the role of ROS in the helicobacter pylori (Hp) induced mtDNA mutations, AGS cells were treated by extracts of Hp11638 or Hp11638M. The ROS levels, cytochrome C reductions, and intracellular ATP levels were measured. The coding region and the D-Loop region were amplified and sequenced. Results showed the ROS levels, cytochrome C reduction and mtDNA mutations were markedly increased and cell viability decreased after treatment with both Hp extracts, and 616 mutations were detected in D-Loop region and 3 heteroplasmic point mutations in the Cytb gene. No mutations were found in the coding region. The mutation rates of mtDNA D-Loop region were positively correlated with the ROS levels and negatively to the ATP levels.
Keywords: Helicobacter pylori, Reactive Oxygen Species, Mitochondrial DNA, Mutation.
Introduction
Helicobacter pylori (Hp) are Gram-negative microaerophilic bacteria. Hp infection represents a key factor in the etiology of various gastrointestinal diseases, ranging from chronic active gastritis without clinical symptoms to peptic ulceration, gastric adenocarcinoma, and gastric mucosa-associated lymphoid tissue lymphoma. H. pylori-positive patients have a 10 to 20% lifetime risk of developing ulcer disease and a 1 to 2% risk of developing distal gastric cancer [1]. The cytotoxin-associated gene A (CagA) protein and vacuolating cytotoxin (VacA) protein are the main virulence factors of Hp and closely relevant with the occurrence of gastric ulcer and carcinoma [2]. Most H. pylori strains secrete VacA into the extracellular space. After exposure of VacA to acidic or basic pH, re-oligomerized VacA (mainly 6 monomeric units) at neutral pH is more toxic [3]. CagA (120-145 kDa protein) is a highly antigenic protein that is associated with a prominent inflammatory response. It has a pathogenic effect on gastric and duodenal mucosa leading to the development of peptic ulcers [4].
Studies have shown that Hp can induce reactive oxygen species (ROS) production and programmed cell death in human gastric epithelial cells [5,6]. ROS are produced as a normal product of cellular metabolism and include superoxide anion (O2•ˉ), hydrogen peroxide (H2O2), hydroxyl radical (HO•), nitric oxide (NO•), etc. They are highly reactive due to the presence of unpaired valence shell electrons and can diffuse only an extremely short distance before they dissipate. Elevated levels of ROS have been implicated in cellular physiological and pathological processes such as cell proliferation, apoptosis, differentiation, carcinogenesis, etc [7]. Mitochondria are the centre of energy metabolism in the cell and a major source of ROS. The proportion of oxygen converted into O2•ˉaccounts for about 1-2 % of the overall oxygen consumption [8]. Mitochondrial DNA (mtDNA) is an extranuclear genetic material. mtDNA is particularly susceptible to ROS generated by the respiratory chain due to its close proximity and lack of protective histones, and inefficient DNA repair systems [9].
Evidence shows Hp VacA can activate the p38/activating transcription factor 2-mediated signaling pathway resulting in decrease in mitochondrial membrane potential [10] and can induce suppression of energy metabolism followed by mitochondrial damage, leading to impairment of the cell cycle in gastric epithelial cells [11]. Recent studies suggest Hp can increase the mtDNA mutation in AGS cells and mtDNA mutations have been found in Hp infected gastric ulcer and carcinoma tissues [12,13]. However, the role of ROS in the Hp induced mtDNA mutations is still unknown and the impacts of VacA and CagA on the ROS production and mtDNA mutations are poorly understood.
To investigate the ROS production and mtDNA mutations in the Hp infected cells, AGS cells were stimulated by the extract of NCTC Hp11638 (CagA+, VacA+) or the mutant Hp11638M (CagA+, VacA-). The relationships between ROS and mtDNA mutations as well as mutations in D-loop were evaluated. Our results demonstrated the ROS levels and the amount of mtDNA mutations in cells treated by the extract of Hp11638 were markedly higher than those in cells treated by Hp11638 mutant strain. Several mutations in D-Loop region were also detected, but Cox-I, Cox-II, Cox-III, ATPase6 and ATPase8 genes had no mutations. Furthermore, 3 heteroplasmic point mutations were identified in Cytb gene and Hp induced mutations in D-Loop region were closely related to the bacterial virulence and the endogenous ROS level.
Materials and methods
Cells and Hp Strains
AGS cells were purchased from Shanghai Institute of Cell. NCTC Hp 11638, NCTC Hp11638M and E.coli ATCC 25922 were kindly provided by the Department of Medical Microbiology and Parasitology, Shanghai Jiaotong University School of Medicine.
Reagents
F12 culture medium (Hangzhou Jino Biology Co., Ltd. China), fetal bovine serum (FBS), ampicillin, penicillin and streptomycin (Shanghai Bio-engineering Co., Ltd. China), brain heart infusion agar and liquid medium (OXOID Co., Ltd. UK), LB medium (Beijing Solarbio Co., Ltd. China), gas mixture (5% O2, 85% N2, 10% CO2) (Shanghai Shenkai Gas Co., Ltd. China), anti-CagA and anti-VacA polyclonal antibodies (Santa Cruz, USA), AP conjugated secondary antibody, CellTiter-Glo luminescent cell viability assay kit (Cat.#G7570, Promega Co. USA), Dihydrorhdamine-123 (DHR-123) and oxidized cytochrome c (Sigma, USA) and AGS mtDNA extraction kit GenMed Scientifics Co., Ltd USA) were used in the present study.
Cells and Hp Culture
AGS cells were grown in the F12 culture medium containing 10% FBS, 100 U/ml penicillin and 100 µg/ml streptomycin in a humidified atmosphere of 5% CO2 and 95% air at 37°C.
Hp was grown in the brain heart infusion agar containing 7% defibered sheep blood and Hp selective antibiotic V.C.A. for 72 h. Colonies were identified by Gram-stained smear and biochemical reactions, and the washed with 5 ml of brain heart infusion liquid medium. The eluate was incubated with brain heart infusion liquid medium containing 10% FBS and Hp selector. The bacteria were cultivated at 37°C for 48 h under a microaerophilic condition (5% O2, 85% N2, 10% CO2) with continuous shaking.
E. coli were maintained in the LB liquid medium (containing 100 µg/ml ampicillin) at 37°C for 12 h with continuous shaking.
Preparation of Hp and E.coli extract
The Hp and E. coli were harvested, centrifuged at 12000 g for 10 min, washed 3 times with PBS, and then re-suspended in 5 ml of sterile double-distilled water. The suspension was vigorously oscillated for 10 min and kept at room temperature overnight. On the next day, the supernatant was obtained and vigorously oscillated for 10 min followed by centrifugation at 12000 g for 10 min. The supernatant was collected and the sediment was re-suspended in 5 ml of sterile double-distilled water, and kept on the ice followed by sonication 3 times (30 sec per time with an interval of 45 sec). Then, centrifugation was performed at 12000 g for 10 min and the supernatant was collected. All the supernatants were finally mixed and freeze-dried. The dry powder was dissolved in 1 ml of sterile double-distilled water and stored at -40℃ for use. Immediately before use, the solution was centrifuged at 18000 g for 10 min and the supernatant was filtered through a 0.22 μm filter to remove bacteria and macromolecular complex (membranes containing lipopolysaccharide and flagella) [14]. The protein concentration was determined with a DNA/Protein Analyzer (Beckman Du 800). The protein concentration in the Hp11638 extract, Hp11638M extract and E.coli ATCC25922 extract was 20 mg/ml, 30 mg/ml and 28 mg/ml, respectively. Then, the protein concentrations of Hp11638M extract and E. coli extract were adjusted to 20 mg/ml.
Detection of CagA and VacA protein using SDS-PAGE and Western Blot
Five microliters of extracts were mixed thoroughly with 20 μl of loading buffer, which were then boiled for 5 min. Ten microliters of the mixture were subjected to SDS-PAGE, and bands were captured.
Treatments of AGS cells
AGS cells in the logarithmic phase were divided into two groups. Cells in one group were grown in the medium containing 1 μmol/L DHR-123 and 60 μg/ml, 120 μg/ml, 240 μg/ml, 480 μg/ml or 960 μg/ml Hp extract for 24 h and those in the other group maintained in the medium containing 480 μg/ml Hp extract and 1 μmol/L of DHR-123 for 3 h, 6 h, 9 h, 12 h and 24 h. Cells in the blank control were grown in the culture medium alone. In the negative control group, Hp extract was replaced with E.coli extract. Cells in the positive control group were incubated in the medium containing 1 µmol/L DHR-123 and 50 µmol/L H2O2 for 24 h.
Detection of ROS using Flow cytometry
Cells were washed with PBS once. After trypsin digestion, AGS cells were re-suspended in PBS and 1×10⁴ viable cells were measured in each sample by FACScalibur (BD Bioscience). Histogram analysis was performed to analyze the mean fluorescence intensity of rhodamine 123 and ROS level can be expressed as the intensity of fluorescence [15]. All experiments were repeated for three times and data were expresses as  ± SD.
± SD.
Analysis of Cytochrome c reduction
Cytochrome c reduction directly reflects the generation of O2•ˉ in cells. To further confirm the ROS levels, cytochrome c reduction was determined. After trypsin digestion, AGS cells were re-suspended in culture medium and cell density was adjusted to 3×10⁶/ml. Then, cells were incubated with cytochrome C (50 μmol/l) for 15 min and centrifuged at 200 g for 10 min at 4℃. The absorbance of supernatant was measured using a spectrophotometer at 550 nm. The absorbance can be converted into the reduction of cytochrome c by the extinction coefficient for cytochrome c (2.1×10⁴ M-1cm-1). The results were expressed as unit nmol/3×106 AGS cells/15 min [16]. The medium containing 50 μmol/l reduced cytochrome C alone served as a blank control in the detection of absorbance. The experiment was repeated 3 times and data were expressed as  ± SD.
± SD.
Detection of cell viability
Mitochondria play a major role in cellular function such as the productions of ATP and ROS. Elevated ROS level can cause oxidative damage directly to mtDNA resulting in abnormality in ATP production. Therefore, the amount of ATP was further determined aiming to indirectly detect the cell viability and the mitochondrial activity and function [17]. After trypsin digestion, cell concentration was adjusted to 3×10⁵/ml with medium and the ATP level was tested according to the manufacturer's instruction. The intensity of the Luminescence (RLU) signals represents the cell viability.
Extraction of mtDNA of AGS cells
After trypsin digestion, AGS cells were then suspended in PBS and AGS mtDNA extraction was performed according to the manufacturer's instructions.
PCR amplification, sequencing and comparison of various mtDNA segments
The primers for mtDNA D-Loop region were synthesized by Shanghai Sangong Co., Ltd. (Table 1) and a total of 50 μl of mixture used for amplification. The products were sequenced by Shanghai Sangong Co., Ltd. immediately after purification. The primers for sequencing were those for amplification.
Primers sequence of mtDNA genes
| Sequence | Forward primer (5'→3') | Reverse primer (5'→3') | Anticipated length (bp) |
|---|---|---|---|
| D-Loop | ATTCTAACCTGAATCGGAGG | GATGCTTGCATGTGTAATCT | 1528 |
| ATPase8 | CCCGGACGTCTAAACCAAACC | GGGGATCAATAGAGGGGGAAATA | 512 |
| ATPase6 | AATTACCCCCATACTCCTTACACT | GGGTCATGGGCTGGGTTTTACTAT | 857 |
| COX-I | CCTCGGAGCTGGTAAAAA | GGGGGTTCGATTCCTTC | 1654 |
| COX-II | ACTACCCCGATGCATACACCACA | GGGCAATGAATGAAGCGAACAG | 1333 |
| COX-III | GCCGTACGCCTAACCGCTAACA | TCGTAAGGGGTGGTTTTTCTATG | 1177 |
| Cyt b | CGCACGGACTACAACCACGAC | GGACAGGCCCATTTGAGTATTTTG | 1212 |
Using the DNA Star software, mtDNA sequences of AGS cells after Hp extract treatment were compared with those in the blank control (AGS cells). mtDNA mutation is defined as both sequences are different from the those in controls. If two peaks at a particular point are observed in the sequence, only when the lower-intensity peak accounted for more than 20% of the specific peak, a mixture of signals from two bases can be determined, and hence heterogeneous mutation that occurs at this locus can be identified [18].
Statistical Analysis
Data were analyzed with SAS version 11.0 statistical software. Comparisons between multiple groups were performed with one way analysis of variance. Differences among groups were evaluated by Newman-Keuls' Q-test. Differences between two groups were evaluated with t or t' test. The mtDNA mutation rates were assessed with the chi-square test. The relationship between ROS and mtDNA mutation rate was assessed using a linear correlation test.
Results
CagA and VacA proteins
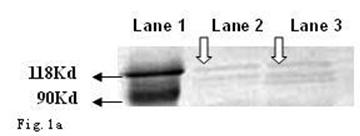
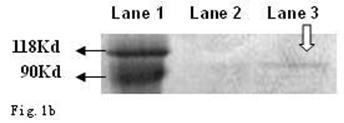
As shown in Fig. 1a and b, the CagA protein (120 kDa) and VacA protein (95 kDa) were expressed in the wide type Hp11638, whereas only the CagA protein was identified in the mutant Hp11638M.
Detection of CagA and VacA protein by Western Blot. a: CagA protein (arrow) b: VacA protein (arrow). Lane 1: Marker; Lane 2: Hp 11638M; Lane 3: Hp11638.
ROS levels in the AGS cells
Compared with the blank control, the ROS levels of the negative control were no obvious change at all stimulated concentration and duration. (The ROS levels were not significantly changed in the blank controls and negative controls)
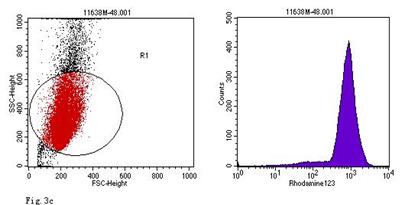
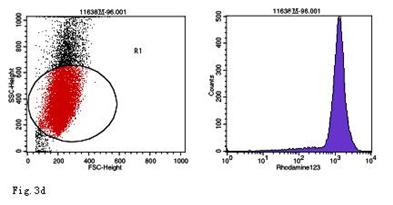
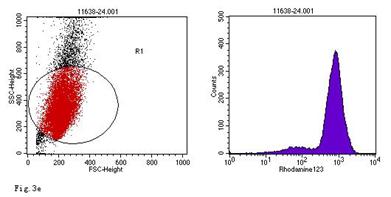
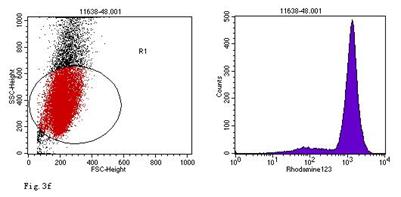
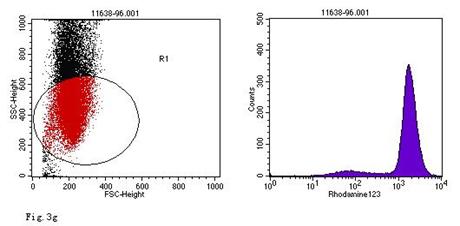
When compared with the negative control, the ROS levels in the AGS cells were markedly increased after stimulation with Hp11638M extract or Hp11638 extract (Fig. 2). Moreover, the ROS levels in AGS cells treated with 480 µg/ml and 960 µg/ml Hp11638M extract and with 240 µg/ml, 480 µg/ml and 960 µg/ml Hp11638 extract were remarkably higher than those in the positive control (310.67±24.01, P<0.01) (Fig. 3b-g). Furthermore, the ROS levels in AGS cells stimulated by Hp11638 extract of difference concentrations were significantly higher than those in cells treated by Hp11638M extract of corresponding concentrations (P<0.05) (Fig. 3c and f, other illustrations were not listed). As shown in Fig. 4, a similar trend was observed in the cytochrome c reduction.
The ROS levels in the AGS cells after treatment with different Hp extracts of various concentrations. The ROS levels increased with the increase in the concentration of Hp extracts. The ROS levels after Hp11638 treatment were markedly higher than after mutant Hp11638M treatment at each concentration (P<0.05).

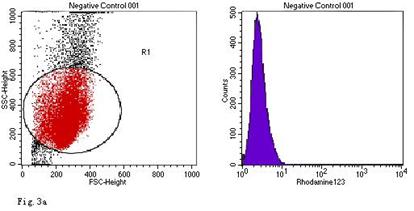
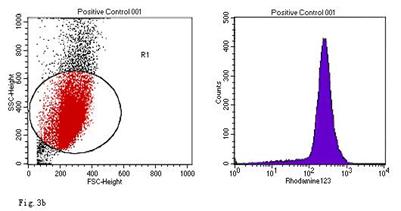
ROS levels in the AGS cells after24 h of stimulation by Hp extracts of various concentrations. a: Negative control. Cells were stimulated by 960 µg/ml E. coli extract and the ROS level was 3; b: Positive control. Cells were incubated with culture medium containing 1 µmol/l DHR-123 and 50 µmol/l H2O2 and the ROS level was 188; c: Cells were stimulated by 480 µg/ml Hp11638M extract and the ROS level was 874; d: Cells were stimulated by 960 µg/ml Hp11638M extract and the ROS level was 1334; e: Cells were stimulated by 240 µg/ml Hp11638 extract and the ROS level was 835; f: Cells were stimulated by 480 µg/ml Hp11638 extract and the ROS level was 1395; g: Cells were stimulated by 960 µg/ml Hp11638 extract and the ROS.
The cytochrome c reduction in the AGS cells after treatment with Hp extracts of various correlations. The cytochrome c reduction increased with the increase in the concentration of Hp extracts. The cytochrome c reduction after Hp11638 treatment were markedly higher than after mutant Hp11638M treatment at each concentration (P<0.05).

As shown in Table 2, the ROS levels in the AGS cells stimulated by Hp11638M extract and Hp11638 extract were dramatically higher than those in the negative control (P<0.01), and the ROS level elevated with the prolongation of stimulation (P<0.01). After treatment with Hp11638M for 12 h and 24 h and with Hp11638 for 6 h, 9 h, 12 h and 24 h, the ROS levels were significantly higher than in the positive controls (P<0.01). In addition, the ROS levels after stimulation by Hp11638 extract were remarkably higher than after stimulation by Hp11638M extract at the same time point (P<0.05). Similar trend was also observed in the cytochrome c reduction (Fig. 5).
the ROS level in AGS cells with various duration of stimulation by Hp extracts ( ± SD)
± SD)
| Group | Duration of stimulation (h) | ||||
|---|---|---|---|---|---|
| 3 | 6 | 9 | 12 | 24 | |
| Blank Control | 2.33±0.47 | 2.00±0 | 2.67±0.47 | 2.67±0.47 | 2.67±0.47 |
| Negative Control | 3.03±0.51 | 3.03±0.51 | 3.03±0.51 | 3.37±0.59 | 3.37±0.59 |
| Positive Control | 260.67±18.70 | 272.00±11.86 | 284.67±17.42 | 300.67±23.79 | 310.67±24.01 |
| Hp11638M | 52.00±16.09 | 166.00±39.59 | 316.67±49.60 | 475.33±59.01j | 880.33±80.69k |
| Hp11638 | 148.67±33.50a | 473.00±63.51b,f | 796.67±71.53c,g | 1149.00±161.28d,h | 1409.33±182.92e,i |
Note: a: P<0.05, b; P<0.01, c: P<0.01, d: P<0.01, e:P<0.01 vs Hp11638M. f: P<0.01, g: P<0.01, h: P<0.01, i: P<0.01 vs positive controls.
Cytochrome c reduction in the AGS cells after stimulation with Hp extracts for various durations. The cytochrome c reduction increased with the increase in the duration of Hp extract stimulation. The cytochrome c reduction after Hp11638 treatment were markedly higher than after mutant Hp11638M treatment at each duration (P<0.05).

As shown in Table 3 and 4, the Luminescence levels were not markedly changed in the blank control, and negative control.
RLU levels in the AGS cells after stimulation by Hp extracts of various concentrations ( ± SD)
± SD)
| Group | concentration of Hp extracts (μg/ml) | ||||
|---|---|---|---|---|---|
| 60 | 120 | 240 | 480 | 960 | |
| Blank control | 1421±159 | 1439±171 | 1398±143 | 1592±178 | 1347±128 |
| Negative control | 1379±156 | 1452±167 | 1368±123 | 1676±185 | 1383±149 |
| Positive control | 815±88 | 758±79 | 818±85 | 692±69 | 795±71 |
| Hp11638M | 658±62 | 586±54 | 415±37 | 303±35 | 186±21 |
| Hp11638 | 503±54a | 350±42b | 282±31c | 153±17d | 102±12e |
Note: P<0.01: negative control vs Hp11638M or Hp11638; a: P<0.05; b: P<0.01; c: P<0.01;d: P<0.01; e: P<0.01 vs Hp11638M.
RLU levels in the AGS cells after stimulation by Hp extracts for various durations ( ± SD)
± SD)
| Group | Duration (h) | ||||
|---|---|---|---|---|---|
| 3 | 6 | 9 | 12 | 24 | |
| Blank control | 1415±147 | 1482±153 | 1427±162 | 1564±164 | 1474±139 |
| Negative control | 1484±166 | 1571±172 | 1378±148 | 1623±175 | 1568±151 |
| Positive control | 773±82 | 816±93 | 848±80 | 759±73 | 754±71 |
| 11638M | 807±86 | 703±72 | 485±53 | 322±41 | 302±39 |
| 11638 | 750±82a | 415±37b | 359±45c | 214±24d | 153±17e |
Note: P<0.01: negative control vs Hp11638M or Hp11638; a:P>0.05;b: P<0.01; c: P<0.05;d: P<0.05; e: P<0.01 vs Hp11638M
When compared with the negative control, the Luminescence levels in the AGS cells stimulated by Hp11638M extract or Hp11638 extracts of various concentration or for different durations were significantly lower (P<0.01), and the decrease in the Luminescence level was in a concentration and time dependent manner in both groups. Furthermore, the RLU levels in the AGS cells after stimulation by Hp11638 extract were dramatically lower than those after Hp11638M stimulation at corresponding concentration (P<0.05), and the RLU levels after stimulation by Hp11638 extract for 6 h, 9 h, 12 h and 24 h were also markedly decreased when compared with those after Hp11638M stimulation for corresponding duration (P<0.05).
Mutations of mtDNA D-loop region and Cytb gene in the AGS cells
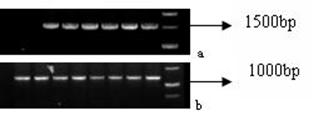
PCR products were verified by electrophoresis and then sequenced. Products of the expected size (Fig. 6a-b) showed that mtDNA D-loop region and Cytb genes were successfully amplified.
PCR products of mtDNA. a: products of mtDNA D-Loop region after 1% TAE agarose gel electrophoresis (1528 bp); b: products of Cytb gene after 1% TAE agarose gel electrophoresis (1212 bp).
When compared with the sequence of mtDNA D-Loop region of the AGS cells, no mutations in the mtDNA genes were found in the negative control.
As shown in Table 5, the mutation rates in the mtDNA D-loop region after stimulation by Hp11638 extract of 120 µg/ml, 240 µg/ml, 480 µg/ml and 960 µg/ml were remarkably higher than those after stimulation by Hp11638M extract of corresponding concentration (χ2=8.21, P<0.01; χ2=6.19, P<0.05; χ2=6.06, P<0.05; χ2=8.44, P<0.01, respectively). However, there was no significant difference between two groups when the concentrations of Hp extracts were 60 µg/ml (χ2=2.93, P>0.05). Furthermore, the mutation rates in the mtDNA D-loop region elevated with the increase in the extract concentration (Fig.7).
Mutation rates in the mtDNA D-loop region of the AGS cells
| Group | Concentration (µg/ml) | Durations (h) | ||||||||
|---|---|---|---|---|---|---|---|---|---|---|
| 60 | 120 | 240 | 480 | 960 | 3 | 6 | 9 | 12 | 24 | |
| Hp11638M (%) | 0.46 | 0.72 | 1.70 | 2.95 | 4.52 | 0.20 | 0.65 | 1.44 | 2.03 | 2.95 |
| Hp11638 (%) | 0.98a | 1.90b | 3.08c | 4.65d | 7.00e | 0.33f | 1.70g | 2.49h | 3.53i | 4.65j |
Note: a: P>0.05; b: P<0.01; c: P<0.05;d: P<0.05; e: P<0.01; f: P>0.05;g: P<0.01; h: P<0.05;i: P<0.05; j: P<0.05. vs Hp11638M
mutation rates in the mtDNA D-loop region of the AGS cells after stimulation by Hp extracts of various concentrations. The mutation rates increased with the increase in the concentration of Hp extracts. After stimulation by Hp extracts of 120 µg/ml, 240 µg/ml, 480 µg/ml and 960 µg/ml, the mutation rates in the Hp11638 group were remarkably higher than those in the Hp11638M group (P<0.01).

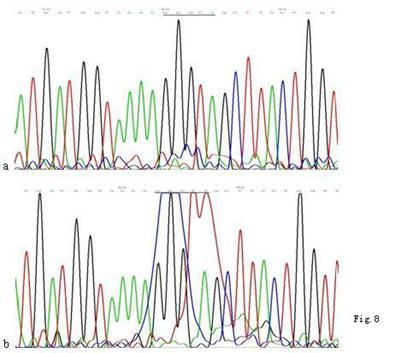
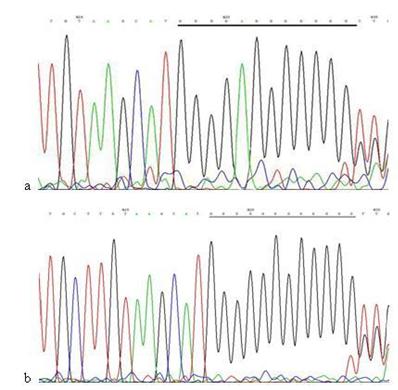
When compared with the mtDNA of AGS cells without treatment, only three heteroplasmic mutations in the Cytb gene were found in the mtDNA of AGS cells treated with 960 μg/ml Hp11638 extract for 24 h (Fig.8), while no mutation in the mtDNA genes was found in the AGS cells after stimulation by Hp extracts of other concentrations.
Mutations in the mtDNA Cytb gene. a: Sequence of mtDNA of AGS cells without treatment. the section under the black line represents the normal sequence; b: Sequence of mtDNA of AGS cells stimulated by 960 µg/ml of Hp11638 extract for 24 h. The section under the black line represents the mutant sequence. The sequencing was carried out from both directions and twice.
When compared with the D-Loop region of mtDNA of AGS cells without treatment, the mutation rates in the mtDNA D-loop region in AGS cells after stimulation by Hp11638 extract for 6, 9, 12 and 24 h were significantly higher than those after stimulation by Hp11638M extract for corresponding duration (χ2=7.2, P<0.01; χ2=4.35, P<0.05; χ2=6.40, P<0.05; χ2=6.06, P<0.05, respectively). There was no significant difference between two groups after 3 h of stimulation (χ2=0.5, P>0.05). Furthermore, the mutation rates in the mtDNA D-loop region were positively correlated with Hp extract simulation duration (Fig.9). Furthermore, the mutation rates in the mtDNA D-loop region increased with the prolongation of Hp extract simulation. When compared with AGS mtDNA, no mutation was detected in all mtDNA genes in cells stimulated by two strains for the same period of time.
Mutation rates of mtDNA D-loop region after Hp extract simulation for different durations. The mutation rates increased with the prolongation of stimulation by Hp extracts. After 6 h, 9 h, 12 h and 24 h of stimulation, the mutation rates of mtDNA D-loop region in the Hp11638 group were significantly higher than those in the Hp11638M group (P<0.05).

Types of mutation
A total of 616 mutations were identified in the mtDNA D-Loop region including 489 point mutations, 81 insertions and 46 deletions. In addition, 89.4% of the point mutations (437/489) were G → A; C→T or A → G; T→C transition.
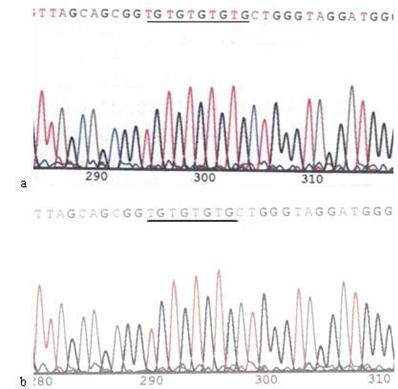
Except in cells treated with 60 μg/ml Hp11638M extract for 24 h and those treated with 480 μg/ml both extracts for 3 h, micro-satellite mutations were found in the D-Loop region after Hp stimulation under the rest conditions. The sequences of 303PolyC, 16184PolyC and 514CA repeats in the mtDNA D-Loop region of AGS cells were 8CT6C, 7CT4C and (CA)5, whereas the sequences were 7CT6C, 12C, and (CA)4 after Hp induced mutation (Fig.10-12) .
Mutation of 303PolyC in the mtDNA D-loop region. a: Sequence of 303PolyC in the mtDNA D-loop region of AGS cells, the section of black line is the normal sequence; b: Sequence of 303PolyC in the mtDNA D-loop region of AGS cells stimulated by Hp extracts, and the section of black line is the mutant sequence. The sequencing was carried out from both directions and repeated, and the sequence was assayed from 5' to 3'.
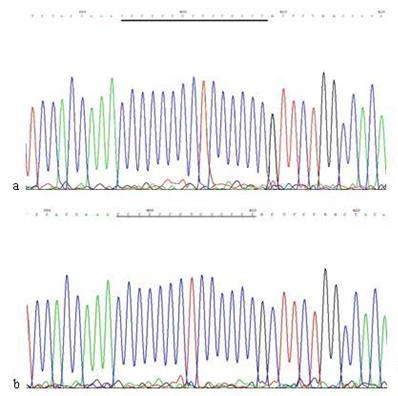
The mutation analysis of 16184PolyC in mtDNA D-loop region. a: Sequence of 16184PolyC in mtDNA D-loop region of AGS cells, the section of black line is the normal sequence; b: Sequence of 16184PolyC in mtDNA D-loop region of AGS cells stimulated by Hp extracts, and the section of black line is the mutant sequence. Sequencing was carried out from both directions and repeated once, and the sequence was assayed from 3' to 5'.
The mutation analysis of 514CA repeats in mtDNA D-loop region. a: Sequence of 514CA repeats in mtDNA D-loop region of AGS cells, the section of black line is the normal sequence; b: Sequence of 514CA repeats in mtDNA D-loop region of AGS cells stimulated by Hp extracts, and the section of black line is the mutant sequence. Sequencing was carried out from both directions and twice, and the sequence was assayed from 3' to 5'.
Correlation between mtDNA mutation rate and ROS level
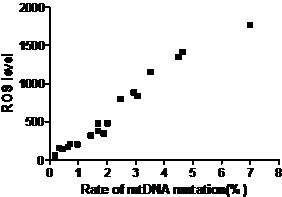
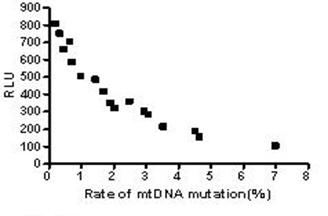
The results above suggested the mutation rate of mtDNA D-loop region and the mean ROS level were elevated and the ATP level was decreased with the increase in the concentration of both Hp extracts and with the prolongation of Hp extract stimulation. Correlation analysis (Fig.13) showed the mutation rates of the mtDNA D-Loop region were positively correlated with the mean ROS levels (r=0.982, P<0.01), and negatively related to the mean ATP levels (r=0.909, P<0.01) (Fig.14).
Correlation between the mtDNA mutation rate and ROS level. The mutation rates of mtDNA D-loop region were positively correlated with the mean ROS levels and the equation was Y=284.2X-12.7 (r=0.982, P<0.01).
Correlation between the mtDNA mutation rate and the ATP level. The mean ATP levels were negatively correlated with the mutation rates of mtDNA D-loop region and the equation was Y=-106.1X+656.7 (r=0.909, P<0.01).
Discussion
Hp has been shown to be an important pathogen of gastric and duodenal inflammation. In various developing countries, more than 80% of the population is Hp positive, even at young ages. The prevalence of Hp infection in industrialized countries generally remains under 40% and is considerably lower in children and adolescents than in adults and elderly people [1]. To date, the pathogenic mechanisms have not been well defined.
Studies have shown Hp can cause damage to mitochondria leading to the impairment of cell cycle [10,11]. In the study of Machado et al [12], they speculate, following Hp infection, the activity and expression of base excision repair and mismatch repair are down-regulated both in vitro and in vivo. Moreover, Hp induces genomic instability in nuclear CA repeats in mice and in mtDNA of AGS cells and chronic gastritis tissue, and this effect in mtDNA is associated with bacterial virulence. Furthermore, the DNA damage induced genetic exchange may facilitate spread of antibiotic resistance and selection of fitter variants through re-assortment of preexisting alleles in this important human pathogen [19]. In a letter to the editor, Lee et al [13] reveal the mtDNA mutations in peptic ulcer tissues associated with Hp infection occur in both the mtDNA control and coding regions. Approximately half of the patients had heteroplasmic mtDNA mutations.
The human mtDNA is a double stranded circular molecule of 16569 bp and contains 37 genes coding for two rRNAs, 22 tRNAs and 13 polypeptides. The mtDNA is present in high copy numbers (103~104 copies per cell) in virtually all cells and the vast majority of copies are identical at birth. Furthermore, mtDNA is known for having high acquired mutation rates which are 10 times higher than that of nuclear genomic DNA. It is generally accepted that high mutation rates of mtDNA are contributed to the lack of protective histones, inefficient DNA repair systems and continuous exposure to ROS generated by oxidative phosphorylation in the mitochondria [9].
The D-loop, which is 1124 bp in size (positions 16024-576), is a non-coding region, and acts as a promoter for both the heavy and light strands of the mtDNA, and contains essential transcription and replication elements. The D-loop region is a hot spot for mtDNA alterations and the nucleotide positions 16024±16 324 and 63±322 located in the D-Loop are termed first hypervariable region (HV1) and second hypervariable region (HV2), respectively [20]. The sequence analysis of these two regions is used not only in forensic analysis, but also in medical diagnosis [21].
Obst et al have shown that Hp extract could induce the synthesis of ROS, diminish the levels of reduced glutathione (GSH), induce DNA fragmentation and increase DNA synthesis in gastric cells [22]. Davies et al also revealed Hp could stimulate the production of reactive oxygen metabolite in the antral mucosa in vivo [23]. Hp can induce the production of pro-inflammatory cytokines from gastric epithelial cells resulting in the increased generation of ROS in gastric epithelial cells [24]. It has been shown that Hp infection can increase the expression and activity of spermine oxidase, which oxidizes polyamines that are abundant in epithelial cells to release hydrogen peroxide [25]. In addition, study also demonstrates that Hp itself also generates ROS [26], and administration of antioxidase or antioxidant may be protective [14].
In the present study, extract was obtained from VacA positive and VacA negative HP. The stimulation of ROS production by VacA, an important virulence factor of Hp, has been demonstrated in numerous studies. Kimura et al revealed VacA purified from Hp could cause mitochondrial damage (impair mitochondrial membrane potential followed by a decrease in energy metabolism) [11], which may be a cause of excessive production of ROS. This effect was confirmed by Kim et al [27]. Furthermore, VacA from Hp could also impaired glutathione metabolism which alleviates the anti-oxidative potency [28]. These effects result in excessive generation of ROS and compromised anti-oxidative potency. These effects may also explain why the ROS levels in AGS cells stimulated by Hp11638 extract were significantly higher than those in cells treated by Hp11638M extract at the corresponding concentrations.
Therefore, Hp infection may involve in many gastrointestinal diseases through excessive ROS production in the mucosa, the pronounced membrane damage, and the depletion of gastric anti-oxidants [29]. The ROS not only causes damage to nuclear and mitochondrial DNA, but compromises the DNA repair. The mismatch repair (MMR) pathway is an important mechanism involving in the DNA repair. Studies have shown Hp infection can down-regulate the expressions of MMR in vivo and in vitro [30] [12]. ROS cause damage to not only nuclear DNA, but mtDNA. mtDNA mutations have been detected in Hp-infected chronic gastritis and peptic ulcer tissues, suggesting that Hp infection contributes to the accumulation of mutations in mtDNA at early steps of gastric cancer development [31]. In the study of Machado et al., their results showed Hp infection resulted in increased mutations in the non-coding D-loop as well as the coding genes ND1 and COI of mtDNA of gastric cells [12]. The increase in the number of mutations was mainly attributed to a rise of transitions, possibly a consequence of oxidative damage. The increase in mtDNA mutations was dependent on the bacterial virulence factors. The changes in mtDNA in peptic ulcer tissues may further impair the ATP synthesis and increase the mtDNA copy number to compensate for the deficiency in ATP. During this perturbation, mitochondria might produce a large amount of ROS, causing the vicious cycle in peptic ulcer disease [13].
In the present study, the ROS levels and the mutations in the mtDNA of AGS cells were determined after Hp extract stimulation. Our results demonstrated the ROS levels and the frequency of mutations in the mtDNA increased and the cell viability decreased in a concentration and time dependent manner. In addition, the ROS levels and Luminescence levels were not markedly changed in the blank control and the negative control accompanied by absence of any mutation in the mtDNA. These findings further confirmed that the increased ROS levels and the elevated mutation rates as well as the decreased cell viability were caused by the Hp extracts. Furthermore, correlation analysis showed the ROS level was positively correlated with the mutation rates. Therefore, our findings support the hypothesis that Hp induced ROS was the main cause of mtDNA mutations.
However, the mutation rate of mtDNA in our results (7% highest) is significantly lower than that reported by Machado et al [12] which may be explained the following reasons. First, Machado et al applied live bacteria to stimulate AGS cells and the duration of stimulation was as long as 5 d, whereas stimulation by the Hp extract was conducted for only up to 24 h in the present study. Second, Machado et al compared the mtDNA sequence post-stimulation with that from database, while, in the present study, the mtDNA sequence of AGS cells after stimulation was compared with that at baseline which avoids the false increase in the mutation rate due to variance in certain loci of mtDNA between AGS cells and normal human cells. Although the mutation rate in the present study was lower than that reported by Machado et al, we still postulated there is an accumulation in the Hp extract induced mtDNA mutation.
Our results also showed that no mutations were found in the coding regions of Cox-I, Cox-II, Cox-III, ATPase6 and ATPase8 in the mtDNA. Only 3 heteroplasmic mutations in the Cytb gene loci were identified in the mtDNA of AGS cells after stimulation with 960 μg/ml Hp11638 extract, which suggested that the D-Loop region is the main location where Hp induced mtDNA mutations occur and that the mtDNA mutation seldom takes place in the gene coding region of mtDNA [32].
MtDNA contains several mono- and dinucleotide repeats. The ones most frequently used to test mtGI are a (CA)n microsatellite starting at 514 bp position of the D-loop [33] and a homopolymeric C tract extending from 16,184 to 16,193 bp of the D-loop, which is interrupted by a T at 16,189 bp position [34]. In human populations, the mtCA microsatellite shows seven different alleles varying in size by one repeat. On the other hand, the (16184)C homopolymer exhibits two forms: the stable one in which all mt-genomes of an individual have equal-length tracts (usually 10 bp long) and the unstable one in which the mt-genomes of a given individual are a mosaic of C tracts varying in length from 8 to 14 nucleotides. Moreover, a detailed analysis of the mechanism of length variation shows that a T→C transition in the T nucleotide at 16189 bp position is the primary cause of instability [34]. In our study, mutations were found in 17 out of 20 samples after stimulation by Hp extracts and included C deletion in the 303PolyC region, CA deletion in the D514CA repeats and T→C replacement at the 16189 bp position of 16184PolyC. Previous studies have found that most of mtDNA mutations are T→C; G→A replacement [32,35]. In this study, 616 mutations were identified in the D-Loop region of mtDNA, including 489 point mutations, 81 insertions and 46 deletions, and 89.4% of point mutations (437/489) were G → A; C→T and A → G; T→C conversion.
In conclusion, our study demonstrates that Hp extracts can induce the production of intracellular ROS, which may be the primary cause of mtDNA mutations. In addition, mtDNA mutation results in the reduction of ATP synthesized in mitochondria and affect cell viability. Both the pathogenic factors of Hp (VacA and CagA), especially the VacA, play an important role in the Hp induced mtDNA mutation. We speculate that the accumulation of Hp induced mtDNA mutation is likely to be one of critical mechanisms underlying the carcinogenic effects of Hp.
Acknowledgements
This study was funded by Shanghai Science and Technology Commission (No. 08411968100).
Conflict of Interest
The authors have declared that no conflict of interest exists.
References
1. Kusters JG, van Vliet AH, Kuipers EJ. Pathogenesis of Helicobacter pylori infection. Clin Microbiol Rev. 2006;19:449-490
2. Salih BA. The role of the putative virulence markers (cagA and vacA ) of Helicobacter pylori in peptic ulcer disease. Saudi Med J. 2004;25:830-836
3. Wada A, Yamasaki E, Hirayama T. Helicobacter pylori vacuolating cytotoxin VacA is responsible for gastric ulceration. J Biochem. 2004;136:741-746
4. Atherton JC. Cag A: a role at last. Gut. 2002;47:330-331
5. Calvino-Fernández M, Benito-Martínez S, Parra-Cid T. Oxidative stress by Helicobacter pylori causes apoptosis through mitochondrial pathway in gastric epithelial cells. Apoptosis. 2008;13:1267-1280
6. Ding SZ, Minohara Y, Fan XJ, Wang J. et al. Helicobacter pylori infection induces oxidative stress and programmed cell death in human gastric epithelial cells. Infect Immun. 2007;75:4030-4039
7. Bergendi L, Benes L, Duracková Z. et al. Chemistry physiology and pathology of free radicals. Life Sci. 1999;65:1865-1874
8. Chance B, Sies H, Boveris A. Hydroperoxide metabolism in mammalian organs. Physiol Rev. 1979;59:527-605
9. Sharma H, Singh A, Sharma C. et al. Mutations in the mitochondrial DNA D-loop region are frequent in cervical cancer. Cancer Cell Int. 2005;5:34
10. Nakayama M, Kimura M, Wada A. et al. Helicobacter pylori VacA activates the p38/activating transcription factor 2-mediated signal pathway in AZ-521 cells. J Biol Chem. 2004;279:7024-7028
11. Kimura M, Goto S, Wada A. et al. Vacuolating cytotoxin purified from Helicobacter pylori causes mitochondrial damage in human gastric cells. Microb Pathog. 1999;26:45-52
12. Machado AM, Figueiredo C, Touati E. et al. Helicobacter pylori infection induces genetic instability of nuclear and mitochondrial DNA in gastric cells. Clin Cancer Res. 2009;15:2995-3002
13. Lee S, Shin MG, Jo WH. et al. Association between Helicobacter pylori-related peptic ulcer tissue and somatic mitochondrial DNA mutations. Clin Chem. 2007;53:1390-1392
14. Ishikawa T, Yoshida N, Tokuda H. et al. Role of oxygen-derived free radicals in Helicobacter pylori water extract-induced mouse skin carcinogenesis. Biofactors. 2006;28:45-52
15. Shi GY, Gao F, Shi XG. et al. Detection of cellular reactive oxygen species level by flow cytometry. Acta Universitatis Medicinalis Secondae Shanghai. 2001;21:122-124
16. Babior BM, Kipnes RS, Curnutte JT. Biological defense mechanisms. The production by leukocytes of superoxide a potential bactericidal agent. J Clin Invest. 1973;52:741-744
17. Lanza IR, Nair KS. Functional assessment of isolated mitochondria in vitro. Methods Enzymol. 2009;457:349-372
18. Lutz S, Weisser HJ, Heizmann J. et al. Mitochondrial heteroplasmy amony maternally related ondividuals. Int J Legal Med. 1999;113:155-161
19. Dorer MS, Fero J, Salama NR. DNA damage triggers genetic exchange in Helicobacter pylori. PLoS Pathog. 2010;6:e1001026
20. Miller KW, Dawson JL, Hagelberg E. A concordance of nucleotide substitutions in the first and second hypervariable segments of the human mtDNA control region. Int J Legal Med. 1996;109:107-113
21. Levin BC, Cheng H, Reeder DJ. A human mitochondrial DNA standard reference material for quality control in forensic identification medical diagnosis and mutation detection. Genomics. 1999;55:135-146
22. Obst B, Wagner S, Sewing KF. et al. Helicobacter pylori causes DNA damage in gastric epithelial cells. Carcinogenesis. 2000;21:1111-1115
23. Davies GR, Simmonds NJ, Stevens TR. et al. Helicobacter pylori stimulates antral mucosal reactive oxygen metabolite production in vivo. Gut. 1994;35:179-185
24. Sharma SA, Tummuru MK, Miller GG. et al. Interleukin-8 response of gastric epithelial cell lines to Helicobacter pylori stimulation in vitro. Infect Immun. 1995;63:1681-1687
25. Xu H, Chaturvedi R, Cheng Y. et al. Spermine oxidation induced by Helicobacter pylori results in apoptosis and DNA damage: implications for gastric carcinogenesis. Cancer Res. 2004;64:8521-8525
26. Nagata K, Yu H, Nishikawa M. et al. Helicobacter pylori generates superoxide radicals and modulates nitric oxide metabolism. J Biol Chem. 1998;273:14071-14073
27. Kim JM, Kim JS, Lee JY. et al. Vacuolating cytotoxin in Helicobacter pylori water-soluble proteins upregulates chemokine expression in human eosinophils via Ca2+ influx, mitochondrial reactive oxygen intermediates, and NF-κB activation. Infect Immun. 2007;75:3373-3381
28. Kimura M, Goto S, Ihara Y. et al. Impairment of glutathione metabolism in human gastric epithelial cells treated with vacuolating cytotoxin from Helicobacter pylori. Microb Pathog. 2001;31:29-36
29. Jung HK, Lee KE, Chu SH. et al. Reactive oxygen species activity mucosal lipoperoxidation and glutathione in Helicobacter pylori-infected gastric mucosa. J Gastroenterol Hepatol. 2001;16:1336-1340
30. Park DI, Park SH, Kim SH. et al. Effect of Helicobacter pylori infection on the expression of DNA mismatch repair protein. Helicobacter. 2005;10:179-184
31. Machado AM, Figueiredo C, Seruca R. et al. Helicobacter pylori infection generates genetic instability in gastric cells. Biochim Biophys Acta. 2010;1806:58-65
32. Richter C, Park JW, Ames BN. Normal oxidative damage to mitochondrial and nuclear DNA is extensive. Proc Natl Acad Sci USA. 1988;85:6465-6477
33. Szibor R Michael M Spitsyn VA. et al. Mitochondrial D-loop 3'(CA)n repeat polymorphism: optimization of analysis and population data. Electrophoresis. 1997;18:2857-2860
34. Bendall KE, Sykes BC. Length heteroplasmy in the first hypervariable segment of the human mtDNA control region. Am J Hum Genet. 1995;57:248-256
35. Cadet J, Berger M, Douki T. et al. Oxidative damage to DNA: formation measurement and biological significance. Rev Physiol Biochem Pharmacol. 1997;131:1-87
Author contact
![]() Corresponding author: Dr. Xue-wen Huang, E-mail: dochuangcn
Corresponding author: Dr. Xue-wen Huang, E-mail: dochuangcn