Impact Factor ISSN: 1449-1907
- Issue 9; 2026
- Issue 8; 2026
- Issue 7; 2026
- Issue 6; 2026
- Issue 5; 2026
- Volume 23; 2026
- Past Issues
- Editorial Board
- Cover Images
- Index & Coverage
- Cover Suggestion
- Special Issues
Introduction
Methods and Materials
Results
Discussion
Conclusion
Supplementary Material
Acknowledgements
References

 Global reach, higher impact
Int J Med Sci 2025; 22(6):1375-1392. doi:10.7150/ijms.107694 This issue Cite
Research Paper
Multi-omics and single-cell analysis reveals machine learning-based pyrimidine metabolism-related signature in the prognosis of patients with lung adenocarcinoma
Tong Hu1†, Run Shi1†, Yangyue Xu1, Tingting Xu1, Yuan Fang1, Yunru Gu1, Zhaokai Zhou2, Yongqian Shu1,3 ![]()
1. Department of Oncology, The First Affiliated Hospital of Nanjing Medical University, Nanjing, China.
2. Department of Urology, The First Affiliated Hospital of Zhengzhou University, Zhengzhou, China.
3. Collaborative Innovation Center for Cancer Personalized Medicine, Nanjing Medical University, Nanjing, China.
† These authors contributed equally.
Received 2024-11-27; Accepted 2025-2-7; Published 2025-2-18
Abstract

Background: Pyrimidine metabolism is a hallmark of tumor metabolic reprogramming, while its significance in the prognostic and therapeutic implications of patients with lung adenocarcinoma (LUAD) still remains unclear.
Methods: In this study, an integrated framework of various machine learning and deep learning algorithms was used to develop the pyrimidine metabolism-related signature (PMRS). Its efficacy in genomic stability, chemotherapy and immunotherapy resistance was evaluated through comprehensive multi-omics analysis. The single-cell landscape of patients between PMRS subgroups was also elucidated. Subsequently, the biological functions of LYPD3, the most important coefficient factor in the PMRS model, were experimentally validated in LUAD cell lines.
Results: The PMRS model with “random survival forest” algorithm exhibited the best performance and was utilized for further analysis. It displayed excellent accuracy and stability in various model evaluation assays. Compared to the PMRS-high subgroup, patients with lower PMRS scores had better survival outcomes, more stable genomic characteristics and higher sensitivity to immunotherapy. Single-cell analysis indicated that as PMRS increased, epithelial cells gradually exhibited malignant phenotypes with enhanced pyrimidine metabolism, while PMRS-high patients showed an inhibitory status of tumor immune microenvironment. Further experiments indicated that LYPD3 promoted the malignant progression in LUAD cell lines.
Conclusion: Our study constructed the PMRS model, highlighting its potential value in the treatment and prognosis of LUAD patients and providing new insights into the individualized precision treatment for LUAD patients.
Keywords: pyrimidine metabolism, machine learning, prognosis, multi-omics analysis, single-cell analysis, lung adenocarcinoma
Introduction
Lung cancer, the most frequently diagnosed cancer with the highest mortality rate globally, seriously threatens human health (1). Despite the recent advances in surgical resection, chemotherapy and immunotherapy, the 5-year survival rate for lung cancer still remains less than 20% (1,2). Lung adenocarcinoma (LUAD) is the most common histological subtype of lung cancer (1,3). Therefore, developing a novel diagnostic and therapeutic model based on molecular characteristics for LUAD patients is a necessary and feasible approach to promote the individualized precision treatment.
Pyrimidine is the major ingredient of DNA and RNA synthesis, and has been paid attention by oncologists since the advent of chemotherapy, due to its status in interfering with the transmission of genetic information (4). In recent years, as the phenomenon of metabolic reprogramming in the tumor microenvironment (TME) has drawn the great interest of researchers, pyrimidine metabolism has gradually returned to our vision (5,6). In clinical, folate analogues like pemetrexed and nucleoside analogues like gemcitabine, are used to impede tumor progression by disturbing the de novo synthesis of pyrimidine nucleotides. Unfortunately, only applying a single chemotherapeutic agent is hard to achieve the desired effectiveness. Hence, it is reasonable to hypothesize that pyrimidine metabolism, not merely de novo synthesis, but salvage and degradation pathways, as well as the deposition of pyrimidine metabolites such as thymidine and uridine, may result in potential chemoresistance, thus attenuating the therapeutic benefits of LUAD patients (7). Following this, more efforts are still needed in clarifying the significance of pyrimidine metabolism in the treatment and prognosis of LUAD patients.
In this study, we constructed the pyrimidine metabolism-related signature (PMRS) for LUAD patients by machine learning and deep learning approaches, and investigated its efficacy in prognosis, genomic stability, chemo- and immuno-therapy sensitivity through a comprehensive analysis of multi-omics data, including bulk RNA-sequencing (RNA-seq), single-cell RNA-seq (scRNA-seq), whole-exome sequencing (WES) and metabolomics. Subsequent experiments further validated the most crucial factor in the PMRS model, LYPD3, promoted the malignant progression in LUAD cell lines. Overall, our study provided a novel perspective on pyrimidine metabolism in LUAD patients, and demonstrates that LYPD3 may serve as a potential biomarker and/or therapeutic target for LUAD patients.
Methods and Materials
Data collection and processing
We retrospectively collected the expression profiles and corresponding clinical information from 4 independent LUAD cohorts, including 1 RNA-seq dataset from The Cancer Genome Atlas (TCGA, https://portal.gdc.cancer.gov/) and 3 microarray datasets (GSE42127, GSE68465 and GSE72094) from the Gene Expression Omnibus (GEO, https://www.ncbi.nlm.nih.gov/geo/) (8-10). Patients lacking vital status and follow-up time were excluded. Probe IDs were mapped to gene symbols according to annotation files. All microarray data and RNA-seq data were subjected to log2 transformation for further analysis. Batch effects among different datasets were corrected by the “Combat” algorithm of R package sva. In total, 1,477 patients were included in this study. The detailed clinicopathological characteristics were summarized in Table S1. Moreover, the somatic mutation profiles and the copy number variation (CNV) profiles of TCGA-LUAD were accessed from TCGA portal and cBioPortal (https://www.cbioportal.org/), respectively, for genomic characteristics analysis (11).
Gene set variation analysis (GSVA)
To evaluate the metabolic characteristics of LUAD cohorts, R package GSVA was utilized to quantify the metabolic scores based on the gene sets obtained from Kyoto Encyclopedia of Genes and Genomes database (KEGG, https://www.kegg.jp/) (12,13). The corresponding gene sets were provided in Table S2. The Harrell's concordance index (C-index) was calculated by R package survival and then normalized by min-max normalization (14). The metabolism with the highest average C-index was regarded as the most prognostic pathways in LUAD cohorts.
Consensus clustering
Consensus clustering performed by R package ConsensusClusterPlus was applied for cluster discovery (15). The consensus matrix, the curve of consensus cumulative distribution function (CDF) and the proportion of ambiguous clustering (PAC) statistic were selected to determine the optimal number of clustering. T-distributed stochastic neighbor embedding (tSNE) assay was used for dimension reduction and visualization of the unsupervised clustering results.
Identification of differentially expressed genes (DEGs) and enrichment analysis
DEGs were identified using the filtering criteria of an absolute value of log2 (fold change) > 1 and an adjusted P value < 0.05 by the limma package (16). Gene Ontology (GO) and KEGG enrichment analysis of DEGs were performed by the clusterprofiler package (17).
Signature generation and efficacy evaluation
To generate PMRS with excellent accuracy and stability performance, univariate Cox regression was applied to identify prognostic DEGs. These prognostic DEGs were employed to fit prediction models in the TCGA cohort, and then validated across all datasets (TCGA, GSE42127, GSE68465 and GSE72094). The prediction models were comprised of 12 different machine learning and deep learning algorithms, including Ridge/elastic network (Enet)/Lasso regression (glmnet package), CoxBoost (CoxBoost package), supervised principal components (SuperPC, superpc package), stepwise Cox regression (stepCox, survival package), partial least squares regression for Cox models (plsRcox, plsRcox package), generalized boosted models (GBM, gbm package), random survival forest (RSF, randomForestSRC package), survival support vector machine (survival-SVM, survivalsvm package), XGBoost (XGBoost package) and deep neural network (DNN, h2o package) (14,18-26). For each model, the C-indices were calculated across all datasets. The model with the best average C-index was regarded as the optimum.
To evaluate the prognostic performance of the PMRS model, a series of assessment methods were employed, including time-receiver operator characteristic (time-ROC) curve, C-index, integrated area under curve (iAUC) and integrated brier score (iBS). The prognostic efficacy of PMRS in different clinical cohorts was further assessed by the C-index comparison with various clinical factors and previously published LUAD prognostic models.
Genomic characteristic analysis
Since somatic mutations played a crucial role in genomic characteristics, the mutation spectrum of TCGA-LUAD was analyzed. Among diverse mutational types, Nonsense_Mutation, Nonstop_Mutation, Missense_Mutation, Translation_Start_Site, Frame_Shift_Del, Frame_Shift_Ins, In_Frame_Del, In_Frame_Ins and Splice_Site were considered as non-synonymous mutations, while the remainder were classified as synonymous (27). The landscape and interaction of somatic mutations were visualized by R package maftools, and the tumor mutational burden (TMB) was calculated based on the number of mutations per megabase (Mut/Mb) (28,29). According to the best cutoff determined by the survminer package, patients were divided into TMB-high or -low groups. The corresponding survival curves were generated by the combination of PMRS and TMB stratification.
Somatic copy number alterations (SCNAs) of TCGA-LUAD were evaluated by GISTIC2.0 in the GenePattern portal (https://cloud.genepattern.org/) (30). Significant amplification (Amp) and deletion (Del) regions along linearized chromosomes between different PMRS subgroups were highlighted based on the CNV frequency, and their locations were determined by the hg38 reference genome file. The SCNAs proportion in PMRS subgroups was calculated based on CNV values generated by GISTIC2.0, in which genes with negative CNV values (-1/-2) were categorized as “Loss” and genes with positive CNV values (+1/+2) were categorized as “Gain”, while genes with a CNV value of 0 were identified as “Neutral”.
Mutations in DNA damage repair (DDR) pathways had been found to impede the repair of deleterious mutations, thereby increasing genomic instability and resulting in the platinum resistance of LUAD patients (31,32). Thus, any non-silent mutations in the DDR pathways, including nucleotide excision repair (NER), base excision repair (BER), homologous recombination repair (HRR), mismatch repair (MMR), Fanconi anemia (FA), non-homologous DNA end joining (NHEJ) and trans-lesion synthesis (TLS) were collected for somatic mutation analysis.
Drug sensitivity assessment
Drug sensitivity data of GDSC, CTRP and PRISM were obtained from the Cancer Dependency Map Project (DepMap, https://depmap.org/portal/) (33). Both CTRP and PRISM contain AUC values as a measure of drug sensitivity, while GDSC contains the values of half-maximal inhibitory concentration (IC50). Corresponding transcriptome profiles of cell lines were retrieved from the Cancer Cell Line Encyclopedia (CCLE, https://sites.broadinstitute.org/ccle/) (34). The IC50 value for each GDSC compounds was evaluated by R package oncoPredict (35). For CTRP and PRISM, compounds with more than 20% missing data were excluded before KNN imputation using the impute package, and the AUC value for each compound was predicted by the “calcPhenotype” function. Correlation coefficient between PMRS and estimated IC50 (or AUC) values indicated the potential response of LUAD patients to specific chemotherapeutic drugs.
Immune infiltration analysis and immunotherapy response evaluation
Tumor immune landscape was depicted by diverse immune infiltration algorithms, including single-sample gene set enrichment analysis (ssGSEA), TIMER, ESTIMATE, CIBERSORT, MCPcounter, xCell and EPIC (36-44). Infiltration levels of immune cells were compared between PMRS subgroups to identify those significantly distinct. Besides, tumor immune-cycle assessed by the Tracking Tumor Immunophenotype (TIP) website (http://biocc.hrbmu.edu.cn/TIP/) and the levels of 15 immune molecules were measured in PMRS subgroups (45,46). Additionally, immune characteristics, such as aneuploidy score, BCR richness, TCR richness, homologous recombination defects (HRD) score, non-silent mutation rate and number of segments were obtained from a pan-immune feature matrix (47).
The potential efficacy of immunotherapy was evaluated using the Tumor Immune Dysfunction and Exclusion (TIDE) score (http://tide.dfci.harvard.edu/) (48). Moreover, two cohorts (GSE91061 and GSE100797), consist of patients who received nivolumab treatment and those who underwent adoptive T cell therapy (ACT), respectively, were utilized to investigate the ability of PMRS in predicting potential immunotherapeutic responses (49,50).
Single-cell RNA-sequencing analysis
LUAD scRNA-seq dataset GSE131907 was included in this study to elucidate the characteristics of PMRS in the TME. The expression matrices of 11 tumor samples were merged and further processed by the Seurat package (51). After removing low-quality cells, expression profiles were normalized by the “NormalizeData” algorithm and 2,000 highly variable genes were identified by the “FindVariableFeatures” function. Principal component analysis (PCA) was applied for dimension reduction based on these genes. Cells were optimally clustered by the “FindNeighbors” and “FindClusters” algorithms. Clusters presented by tSNE reduction were annotated by the SingleR package using the “BlueprintEncodeData” reference dataset (52,53). Features of PMRS in the TME were visualized by the “FeaturePlot” function.
Subsequently, epithelial cells were isolated to identify malignant cells. R package infercnv was used to estimate CNVs from the scRNA-seq data (54). Macrophages and monocytes were considered non-malignant cells and their CNV patterns were used as a baseline. The cutoff value was set to 0.1 for 10X Genomics. Additionally, the Monocle package was used to calculate a pseudo-time trajectory analysis for malignant epithelial cells to infer the differentiation processes (55). The different branches reflected the directions of cellular differentiation.
Additionally, different PMRS patients were identified to investigate their immune characteristics from the viewpoint of single cell analysis. The cellular interactions from various subgroups were evaluated by the CellChat package (56).
Metabolomics analysis
The untargeted metabolomics profiles and expression matrix of LUAD cell lines were obtained from DepMap. Based on the transcriptome profile of the cell lines, they were divided into high-scoring or low-scoring groups for PMRS. Correlations between PMRS scores and metabolite concentrations or KEGG metabolic scores were described by the Mantel test, as implemented in R package ggcor. Metabolic distinctions in PMRS subgroups were further illustrated with radar charts.
Cell culture and transfection
The LUAD cell lines PC-9 and NCI-H1975 were procured from the Shanghai Institute of Biochemistry and Cell Biology (Shanghai, China), and cultured in RPMI-1640 (VivaCell, Shanghai, China) with 10% fetal bovine serum (FBS, VivaCell) at 37℃ in 5% CO2. The plasmid pcDNA3.1-CMV-LYPD3 and an empty vector were purchased from GeneChem (Shanghai, China). The small interfering RNAs (siRNAs) targeting LYPD3 were synthesized by Hanbio Biotechnology (Shanghai, China). Its sequences are listed in Table S3. Lipofectamine 3000 (L3000001; Thermo Fisher, MA, USA) was applied for the transfection, according to the manufacturer's protocol.
Western blot and quantitative real-time polymerase chain reaction (qPCR)
Following the standard protocol, protein samples were extracted with RIPA lysis buffer (P0013; Beyotime Biotechnology) and their concentrations were determined by the bicinchoninic acid (BCA) protein assay kit (P0010; Beyotime Biotechnology). The protein lysates mixed with loading buffer were boiled at 95°C for 5 minutes to destroy their spatial structures. Subsequently, the denatured proteins were separated by 10% sodium dodecyl sulfate polyacrylamide (SDS-PAGE) gel electrophoresis, and further transferred onto polyvinylidene fluoride (PVDF) membranes. PVDF membranes were blocked with 5% skim milk at room temperature for 2 hours, and then incubated with specific primary antibodies overnight at 4℃. After washing with Tris-buffered saline and Tween-20 (TBST) for 3 times, the membranes were incubated with horseradish peroxidase (HRP)-linked antibody for 2 hours at room temperature. Following another three washing with TBST, the immunocomplexes were visualized with the enhanced chemiluminescent kit (BL520A; Biosharp, Anhui, China). Details of antibodies and their corresponding dilution ratios are provided in Table S4.
Total cellular RNA was extracted using the RNAeasy™ kit (R0027; Beyotime Biotechnology), following the manufacturer's protocol. Isolated RNA was quantified by NanoDrop2000 (Thermo Fisher) and reverse transcribed into cDNA with HiScript III RT SuperMix (R323-01; Vazyme, Jiangsu, China). The qPCR assay was performed on QuantStudio™ 7 Flex (Thermo Fisher) using ChamQ SYBR qPCR Master Mix (Q331-02; Vazyme). The expression levels of target genes were normalized to beta-actin, and then calculated by the 2-ΔΔCt method. Primer sequences are listed in Table S5.
Cell counting kit-8 (CCK8) assay
For CCK8 assay, transfected PC-9 and NCI-H1975 cells (1×10³/well) were seeded into 96-well plates. CCK8 solution (C6005; NCM Biotech, Jiangsu, China) was added to each well and incubated for 1 hour at the appointed time. The absorbance at 450 nm was detected by Multiskan FC microplate photometer (Thermo Fisher).
Wound healing assay
For wound healing experiment, transfected cells were added to 6-well plates and incubated with serum-free RPMI-1640. When the cell confluence was greater than 90%, the scratch was created with a sterile pipette tip. After washing with PBS, the wound gap at the same location was photographed at the appointed time using a microscope with a 50× magnification (Leica, Hessian, Gremany).
Transwell assays
For Transwell invasion and migration assays, transfected cells (2×10⁴/well) in serum-free medium were seeded in the upper Transwell chambers (Corning, MA, USA) coated with or without Matrigel (Corning). RPMI-1640 with 10% FBS was added to the lower chamber as a chemoattractant. After incubation at 37℃ for 36~48 hours, cells migrating to the lower layer of the microfiltration membranes were fixed with 4% paraformaldehyde (BL539A; Biosharp) for 15 minutes and stained with crystal violet (C0121; Beyotime Biotechnology) for 30 minutes. The number of cells was then counted under a 200× microscope (Leica).
Statistical analysis
All statistical analysis and representations were performed using R (version 4.2.3) and GraphPad Prism (version 8.0.1) software. Student's t-test was applied to analyze intergroup differences for variables with normal distribution. Pearson or Spearman correlation analysis was used to assess the correlation between two variables. All in vitro experiments were repeated at least three times. A two-tailed P value less than 0.05 was deemed statistically significant.
Results
Identification of pyrimidine metabolic subgroups in LUAD
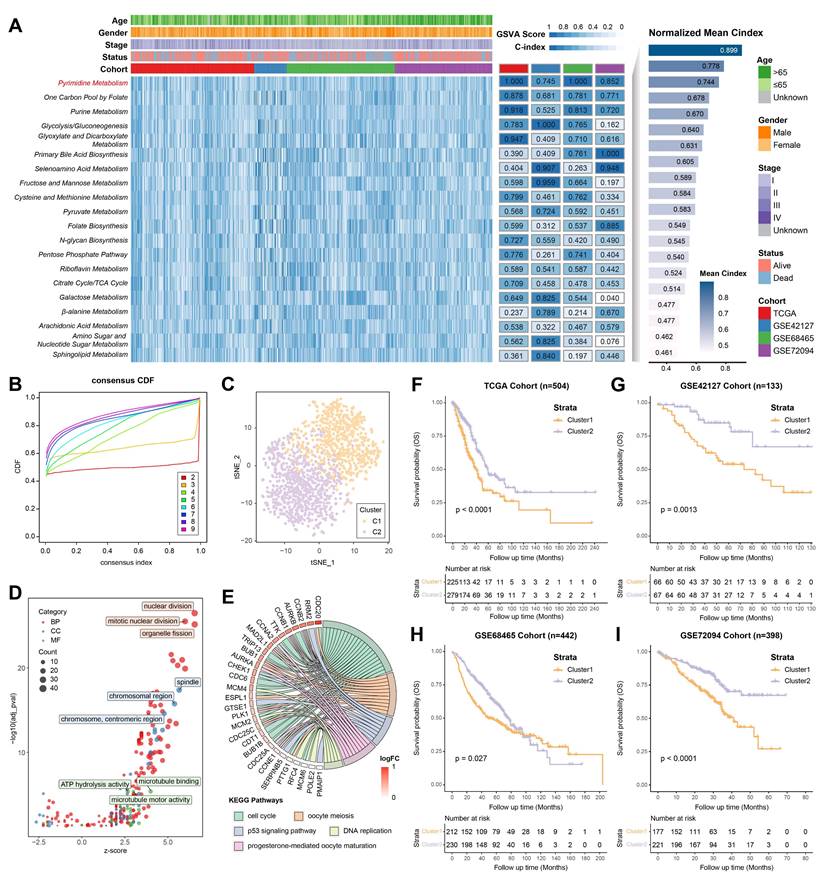
According to different metabolic scores, the C-indices of 4 independent LUAD cohorts (TCGA, GSE42127, GSE68465 and GSE72094) was calculated, indicating pyrimidine metabolism had the highest prognostic significance among all metabolic pathways (Figure 1A, Table S6). Consensus clustering was applied for unsupervised clustering and classification of the combined LUAD cohort, where all LUAD samples were divided into k (k = 2~9) clusters (Figure S1A, S1B). The CDF curve, PAC score and consensus matrix collectively showed that k = 2 was the optimal number (Figure 1B, Figure S1C-S1K). The tSNE result further revealed significant distinctions in pyrimidine metabolic characteristics between two clusters (C1 and C2) (Figure 1C). GO/KEGG analysis suggested that pyrimidine metabolism-related DEGs were enriched in the cell cycle and DNA replication pathways (Figure 1D, 1E). Furthermore, Kaplan-Meier survival analysis illustrated that Cluster1 showed a superior advantage over Cluster2 across all cohorts (Figure 1F-1I).
Identification of pyrimidine metabolic subgroups in LUAD. (A) The top 20 metabolic pathways with the highest mean C-index across LUAD cohorts. (B) The CDF curve for the unsupervised clustering of LUAD patients, k = 2~9. (C) The tSNE plot based on the pyrimidine metabolic characteristics. (D-E) GO/KEGG analysis among the pyrimidine metabolism-related genes. (F-I) Kaplan-Meier survival analysis between the consensus clusters.
Construction of PMRS
The DEGs between pyrimidine metabolic subgroups were subjected to univariate Cox regression analysis, in which 72 prognostic DEGs were identified (Figure 2A, 2B). To investigate the heterogeneity of pyrimidine metabolic subgroups, an unsupervised consensus clustering was performed on these 72 DEGs. Similarly, LUAD patients were also differentiated into two gene clusters (Figure S2). Following this, an integrated framework of different machine learning and deep learning algorithms was applied to develop a signature associated with pyrimidine metabolism (Figure 2C). Intriguingly, the RSF model showed the best performance, with the highest C-index (0.733). As the number of trees increased, the error rate of this model gradually decreased. Noteworthy, LYPD3 had the highest importance coefficient among all factors, indicating its role in pyrimidine metabolism and meriting further investigation (Figure 2D, Table S7).
Construction of PMRS. (A) The overlapping prognostic DEGs among all cohorts. (B) Expression of top 20 prognostic DEGs between consensus clusters. (C) An integrated framework of 12 different machine learning and deep learning algorithms was utilized, and then the C-index of each model was calculated across all cohorts. (D) The association between error rate and number of trees in the RSF model, and the top 10 most important genes. (E) Normalized PMRS scores of consensus clusters. (F) The relationship among consensus cluster, PMRS stratification and survival status. (G-J) Kaplan-Meier survival analysis between the PMRS subgroups. ***P < 0.001.
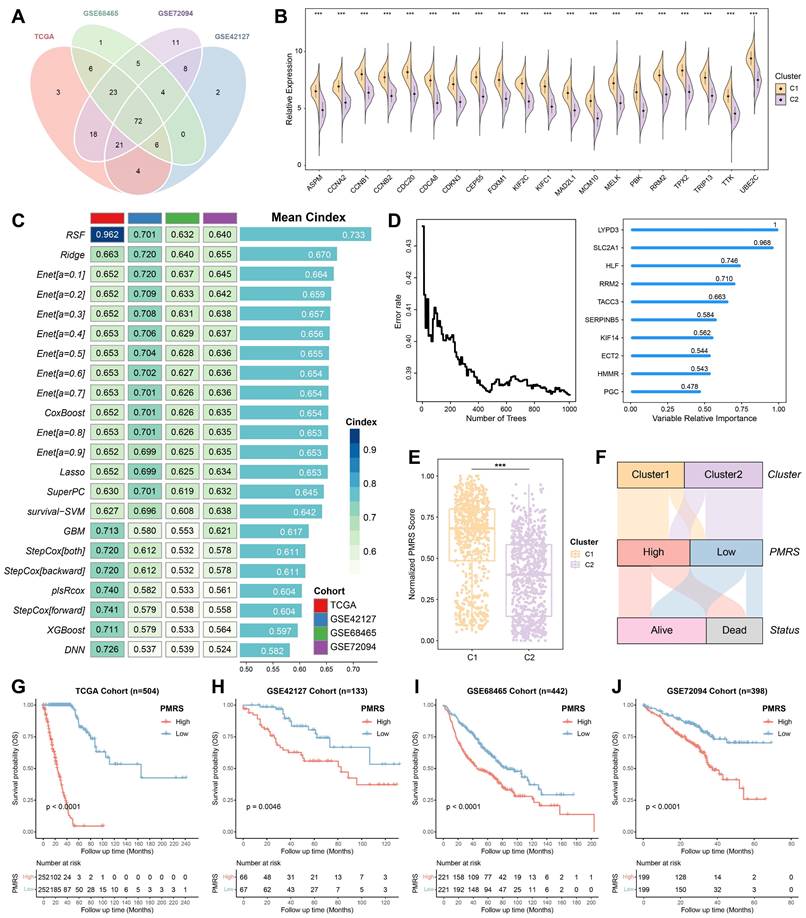
Subsequently, risk scores were calculated based on the importance coefficient of the RSF model. The risk score related to pyrimidine metabolism was termed as PMRS, and all LUAD patients were divided into PMRS-high or -low groups according to the median cutoff. Normalized PMRS scores of different consensus clusters were shown in Figure 2E. Sankey diagram further illustrated the relationship among consensus cluster, PMRS stratification and survival status (Figure 2F). In terms of prognosis prediction, patients with higher PMRS tended to have worse prognoses (Figure 2G-2J).
Evaluation of the PMRS model
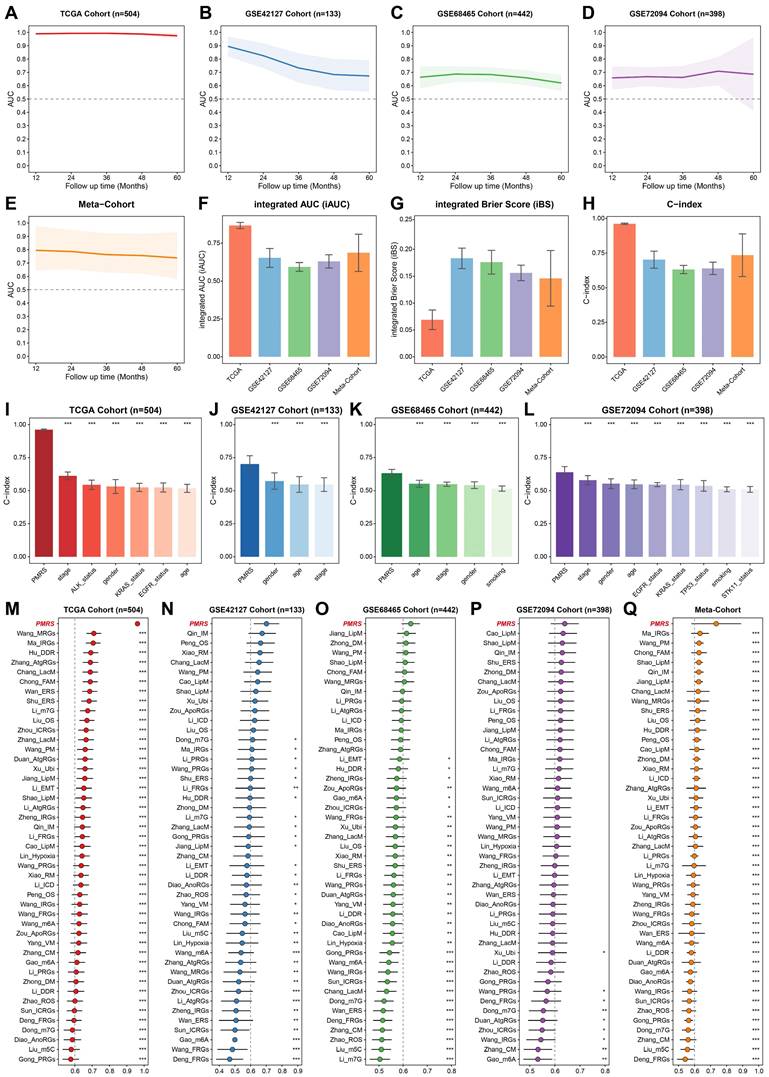
The prognostic predictive capacity of PMRS was initially measured by time-ROC analysis and C-index. Time-ROC curves demonstrated the AUC values of 0.975-0.994 in TCGA-LUAD, 0.673-0.896 in GSE42127, 0.621-0.687 in GSE68465, 0.659-0.709 in GSE72094 and 0.748-0.805 in meta-cohort (Figure 3A-3E). The C-index and 95% confidence interval was 0.962 [0.955-0.968], 0.701 [0.620-0.782], 0.632 [0.594-0.670], 0.640 [0.583-0.696] and 0.735 [0.580-0.891], respectively (Figure 3F). Furthermore, the time-independent indicators, iAUC and iBS, were also employed to evaluate these datasets, demonstrating the excellent predictive accuracy of PMRS (Figure 3G-3H). In addition, we estimated the C-index of common clinical factors, including age, gender, stage and mutation status (Figures 3I-3L). Notably, PMRS exhibited better predictive efficacy than most clinical factors, indicating PMRS was an independent risk factor in all cohorts (Figure S3). To further validate the prognostic efficacy of PMRS, a total of 45 previously published LUAD prognostic models were collected. These models were constructed based on a variety of biological features, including metabolism, immunity, methylation, ubiquitination, autophagy and novel programmed cell deaths (Table S8). As expected, PMRS performed better than the majority of the published models across all LUAD cohorts (Figure 3M-3Q). Taken together, PMRS was a valuable prognostic model for LUAD patients.
Evaluation of the PMRS model. (A-E) Time-dependent ROC curves of PMRS presented with the 1-5-year AUC in TCGA, GSE42127, GSE68465, GSE72094 and Meta-Cohort. (F-H) The iAUC, iBS and C-index of PMRS in TCGA, GSE42127, GSE68465, GSE72094 and Meta-Cohort. (I-L) The C-index of PMRS and common clinical factors in the TCGA, GSE42127, GSE68465 and GSE72094 cohorts. (M-Q) The C-index analysis between PMRS and 45 previously published LUAD prognostic models in TCGA, GSE42127, GSE68465, GSE72094 and Meta-Cohort. Data are presented as mean ± 95% confidence interval [CI]. *P < 0.05; **P < 0.01; ***P < 0.001.
PMRS elevates the genomic instability
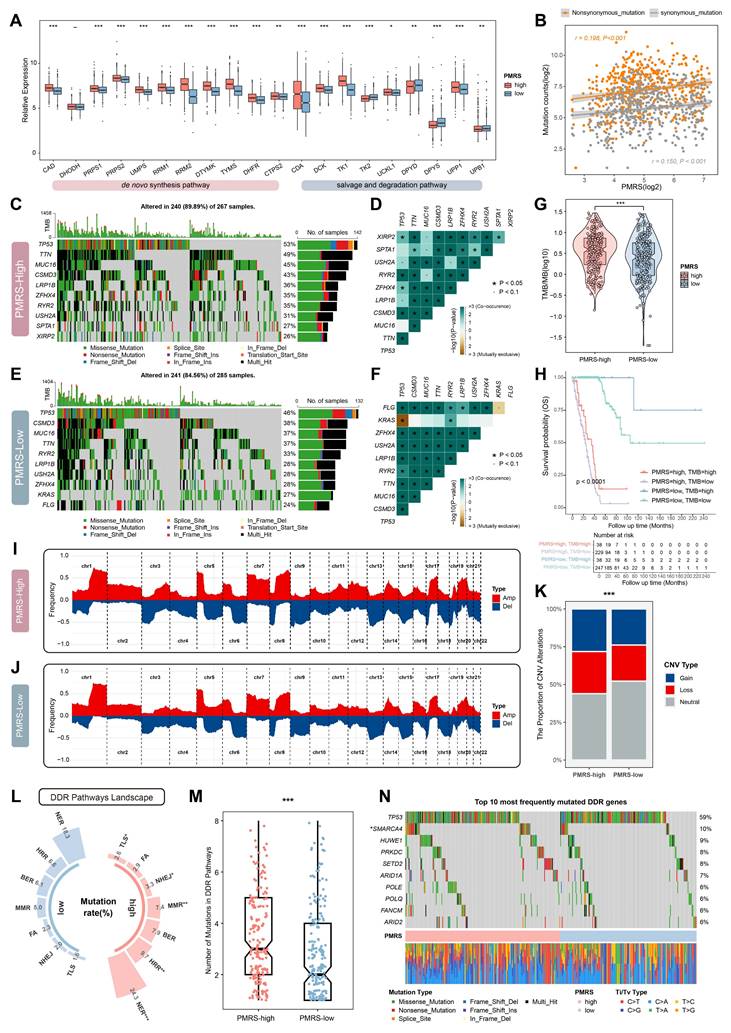
The expression of pyrimidine metabolic enzymes involved in de novo synthesis, salvage and degradation pathways were compared between different PMRS subgroups. The results showed that the majority of key enzymes in de novo synthesis and salvage pathways were significantly upregulated in the PMRS-high subgroup, whereas the key enzymes related to pyrimidine degradation exhibited the decreased expression (Figure 4A). These findings suggested that patients with higher PMRS scores exhibited more active pyrimidine synthesis in tumors, both in de novo synthesis and salvage pathways. Given that pyrimidine was an essential ingredient for DNA synthesis, any abnormalities in the metabolism may affect the DNA replication process adversely, potentially leading to the genomic alterations like somatic mutation and SCNAs (57). Thus, the genomic characterization variants were investigated between PMRS subgroups. The correlation between PMRS scores and non-synonymous (r = 0.198, P < 0.001) and synonymous mutations (r = 0.150, P < 0.001) were revealed in Figure 4B. The results of maftools analysis indicated that there was a higher frequency of mutation and co-mutation in patients with higher PMRS scores (Figure 4C-4F). Coincidentally, TMB analysis also performed the similar result (Figure 4G). Survival analysis further illustrated that those patients with higher PMRS scores and lower TMB levels exhibited worse outcomes (Figure 4H). The CNV profiles of PMRS subgroups were analyzed using GISTIC2.0, which revealed that PMRS-high patients had a higher burden of CNVs (Figure 4I-4K). Furthermore, the landscape of DDR pathways between PMRS subgroups was depicted in Figure 4L. Patients with higher PMRS scores exhibited more mutations in the DDR pathways (Figure 4L, 4M). An oncoplot was utilized to display the 10 most frequently DDR mutations between different PMRS subgroups (Figure 4N). Among them, TP53, SMARCA4, ARID1A, POLE, ARID2A are involved in the NER pathway, HUWE1, PLOQ in BER, PRKDC in NHEJ, SETD2 in MMR, and FANCM in FA.
The genomic characteristics analysis between PMRS subgroups. (A) The expression profiles of pyrimidine metabolic enzymes involved in de novo synthesis, salvage and degradation pathways between PMRS subgroups. (B) The correlation between PMRS and non-synonymous and synonymous mutations. (C-F) The PMRS-high subgroup showed a higher mutation and co-mutation frequency, according to the maftools analysis. (G-H) TMB analysis was conducted for PMRS subgroups, and Kaplan-Meier survival analysis was performed based on the combination of PMRS and TMB stratification. (I-J) The CNV profiles of PMRS subgroups were analyzed using GISTIC2.0. (K) PMRS-high patients exhibited a higher burden of CNVs in terms of “Gain” or “Loss”. (L) Mutation rates of seven DDR pathways (NER, HRR, BER, MMR, FA, NHEJ and TLS) were summarized across different PMRS subgroups. (M) Patients with higher PMRS scores had more mutations in the DDR pathways. (N) An oncoplot was utilized to display the 10 most frequently DDR mutations in different PMRS subgroups. *P < 0.05; **P < 0.01; ***P < 0.001.
Drug sensitivity assessment for LUAD patients with high PMRS scores
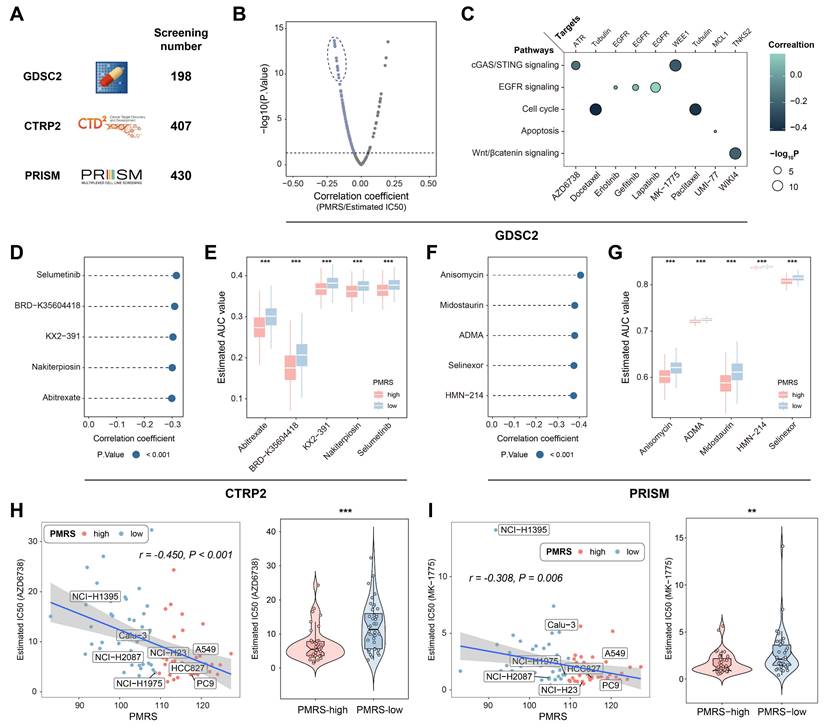
Potential druggable targets and related agents might possess therapeutic values for LUAD patients with high PMRS scores. To identify the sensitive drugs for PMRS-high patients, 1,035 compounds from 3 drug response databases (GDSC, CTRP and PRISM) were screened (Figure 5A). Firstly, IC50 values of 198 compounds from GDSC were estimated in all LUAD patients, and correlation analysis was performed on PMRS and IC50 values. The results showed that AZD6738, docetaxel, erlotinib, gefitinib, lapatinib, MK-1775, paclitaxel, UMI-77 and WIKI4 displayed a very strong negative correlation with PMRS scores (Figure 5B). Their signaling pathways and therapeutic targets were presented in Figure 5C. For both CTRP and PRISM, 5 drugs with the most negative correlation coefficients and expressions were displayed in lollipop plots and boxplots (CTRP: selumetinib, BRD-K35604418, KX2-391, nakiterpiosin, abitrexate; PRISM: anisomycin, midostaurin, asymmetrical-dimethylarginine (ADMA), selinexor, HMN-214) (Figure 5D-5G). Additionally, the relationship between PMRS scores and the chemosensitivity of above mentioned GDSC drugs was analyzed in LUAD cell lines (Figure 5H, 5I). Intriguingly, AZD6738 and MK-1775 exhibited divergent sensitivity in LUAD cell lines as well. Their correlations with PMRS scores were in accordance with those observed in the clinical cohorts.
Drug sensitivity assessment for LUAD patients with high PMRS scores. (A) A total of 1,035 compounds from 3 drug response databases (GDSC, CTRP and PRISM) were screened to identify potential druggable targets. (B) Correlation between PMRS and estimated IC50 values of GDSC drugs. (C) The signaling pathways and therapeutic targets of the candidate compounds from GDSC. (D&F) Correlation between PMRS and estimated AUC values of 5 drugs with the most negative correlation coefficients from CTRP and PRISM, respectively. (E&G) Estimated AUC values of 5 compounds with the most negative correlation coefficients from CTRP and PRISM, respectively. (H-I) Correlation between PMRS and estimated IC50 values for AZD6738 and MK-1775 in the LUAD cell lines. **P < 0.01; ***P < 0.001.
PMRS indicates immunosuppression and immunotherapy resistance
We depicted the immune landscape of LUAD patients to evaluate the potential role of PMRS in guiding immunotherapy. In most algorithms, significant differences were observed in the infiltration abundance of various immune cells (Figure 6A-6B, Figure S4). Moreover, PMRS-high patients suppressed multiple steps in the tumor-immune cycle, including tumor antigen presentation (Step 2), priming and activation (Step 3), trafficking of immune cells to tumors (Step 4) and immune cell infiltration (Step 5), to maintain immunosuppression (Figure 6C). Meanwhile, immune checkpoints such as PD-L1 and LAG3, as well as immune inhibitory molecules like IL-1A and VEGFA, were overexpressed in patients with higher PMRS scores (Figure 6D). Additionally, several immune characteristics, including aneuploidy score, HRD score, BCR richness, TCR richness, non-silent mutation rate and segment number were compared between the subtypes, revealing the tumor immunosuppressive microenvironment (TIME) of PMRS-high patients (Figure 6E-6J).
PMRS indicates immunosuppression and immunotherapy resistance. (A-B) The relationship between PMRS and immune infiltrations across all cohorts, according to the ssGSEA algorithm. (C) Differences in the tumor-immune cycle between PMRS subgroups. (D) The expression profiles of immune-related molecules in different PMRS subgroups. (E-J) The immune characteristics, including aneuploidy score, HRD score, BCR richness, TCR richness, non-silent mutation rate and segment number were compared between PMRS subgroups. (K-L) Correlation between PMRS scores and TIDE scores across all cohorts. (O-R) The distribution of PMRS scores between immunotherapy responders and non-responders in GSE91061 and GSE100797 cohorts. *P < 0.05; **P < 0.01; ***P < 0.001.
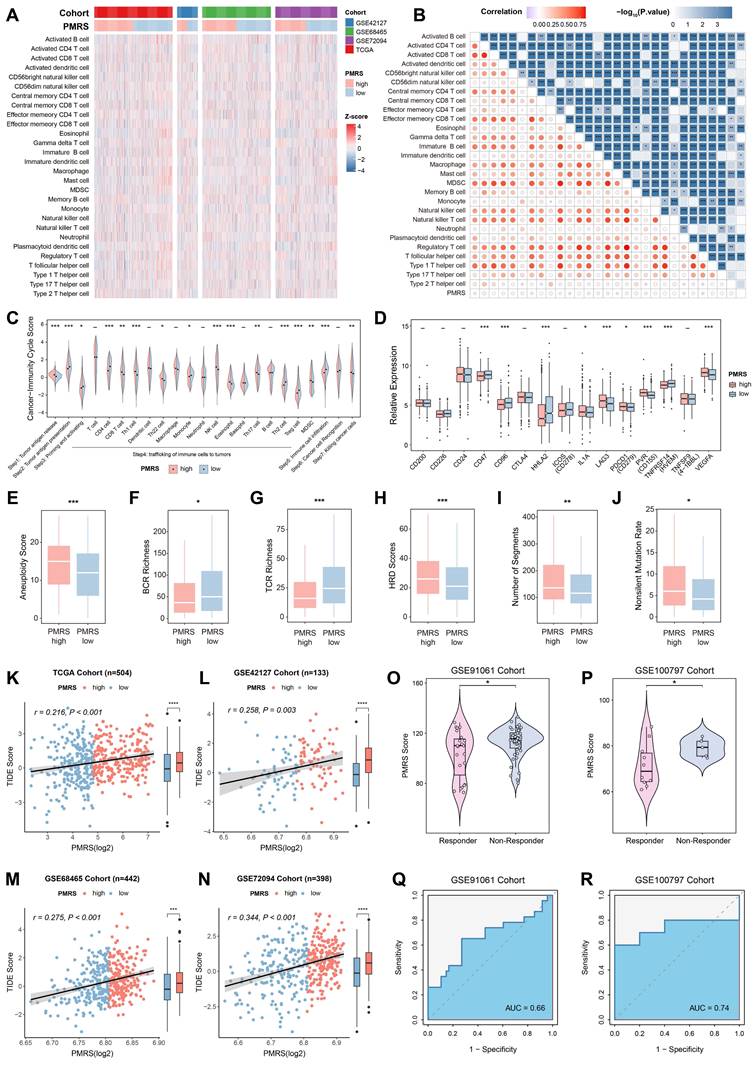
Subsequently, the potential of PMRS in predicting immunotherapy responses was assessed by TIDE scores. The results suggested that PMRS-high patients owned higher TIDE scores, indicating they were less sensitivity to immunotherapy and had worse prognoses (Figure 6K-6N). In immunotherapy cohorts (GSE91061 and GSE100797) received diverse interventions, responders had lower PMRS scores than non-responders, and the AUC values for PMRS in predicting immunotherapy responses were 0.66 and 0.74, respectively, indicating a potential correlation between elevated PMRS scores and an adverse response to immunotherapy (Figure 6O-6R).
PMRS promotes malignant progression of epithelial cells with enhanced pyrimidine metabolism and leads to TIME, from a single-cell perspective
LUAD scRNA-seq dataset (GSE131907) was included in the analysis to elucidate the role of PMRS in the TME. 9 distinct cell subtypes were identified, including T cells, B cells, macrophages, monocytes, natural killer (NK) cells, epithelial cells, endothelial cells, fibroblasts and hematopoietic stem cells (HSC) (Figure 7A, Figure S5A-S5B). Their PMRS scores were subsequently calculated across these subtypes. The findings indicated that immune cells such as T and B cells typically had higher PMRS scores, while the PMRS scores of epithelial cells exhibited an obvious gradient distribution (Figure 7B, Figure S5C). Accordingly, the malignant epithelial cells were separated for subsequent pseudo-time trajectory analysis (Figure S5D). The results revealed that the malignant epithelial cells with higher PMRS scores appeared later than those with lower scores, suggesting that enhanced pyrimidine metabolism might be an acquired hallmark during the malignant differentiation of LUAD cells (Figure 7C, 7D).
Single-cell analysis of PMRS. (A) The tSNE plot displaying the distribution of 9 cell subtypes. (B) Visualization of PMRS scores. (C-D) Pseudotime trajectory analysis colored by pseudotime and PMRS scores. (E) A correlation heatmap illustrated the relationship between PMRS and metabolite concentration or KEGG metabolic scores. (F) The radar chart about metabolite concentrations or KEGG metabolic scores between PMRS subgroups. (G) Differences in the hallmark gene sets between PMRS subgroups based on GSVA. (H) Enrichment of glycolysis in the PMRS-high subgroup. (I-J) The cellular interactions of T cells and macrophages with other cells in different PMRS subgroups. (K-L) The cellular interactions mediated by MHC-II and FN1 ligand receptors.
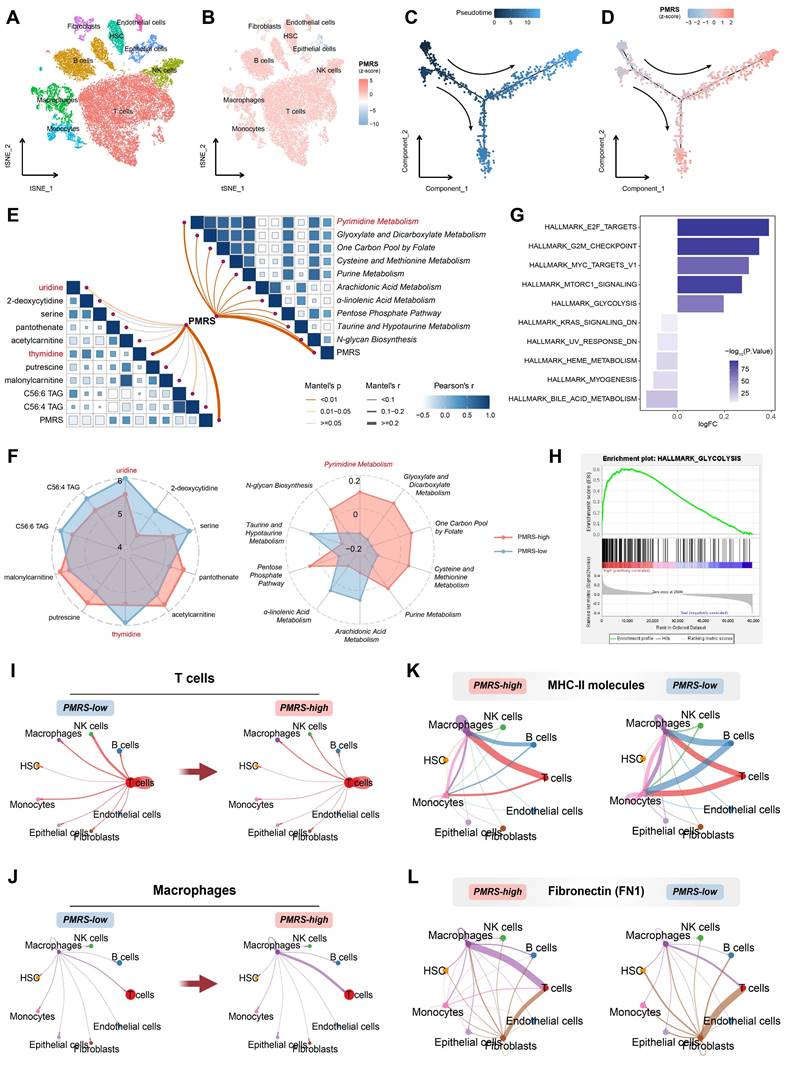
Hence, we performed metabolomics analysis between PMRS subgroups in LUAD cell lines. The results indicated an intimate correlation between PMRS and pyrimidine metabolic scores, as well as thymidine and uridine concentrations (Figure 7E). The lower the PMRS scores patients had, the more uridine and thymidine accumulated in the tumor (Figure 7F). These findings indicated that LUAD patients with high PMRS scores might facilitate the uptake and utilization of thymidine and uridine by activating the salvage synthesis and inhibiting pyrimidine degradation. In addition, the hallmarks of PMRS subgroups were investigated, indicating that multiple carcinogenic pathways were also enriched in the PMRS-high subgroup, such as glycolysis (Figure 7G, 7H).
Furthermore, the immunosuppressive status of PMRS patients was refined from the perspective of single-cell analysis. Cellular interactions of T cells and macrophages with other cells exhibited an attenuation of T cell communication and an enhancement of macrophage communication, as pyrimidine metabolism increased (Figure 7I, 7J). Ligand-receptor comparison analysis revealed the phenomenon of impaired antigen presentation mediated by major histocompatibility complex (MHC) II molecules, as well as increased secretion of inhibitory immune molecules like FN1 in patients with higher PMRS (Figure 7K, 7L).
Experimental validation of LYPD3 in LUAD cell lines
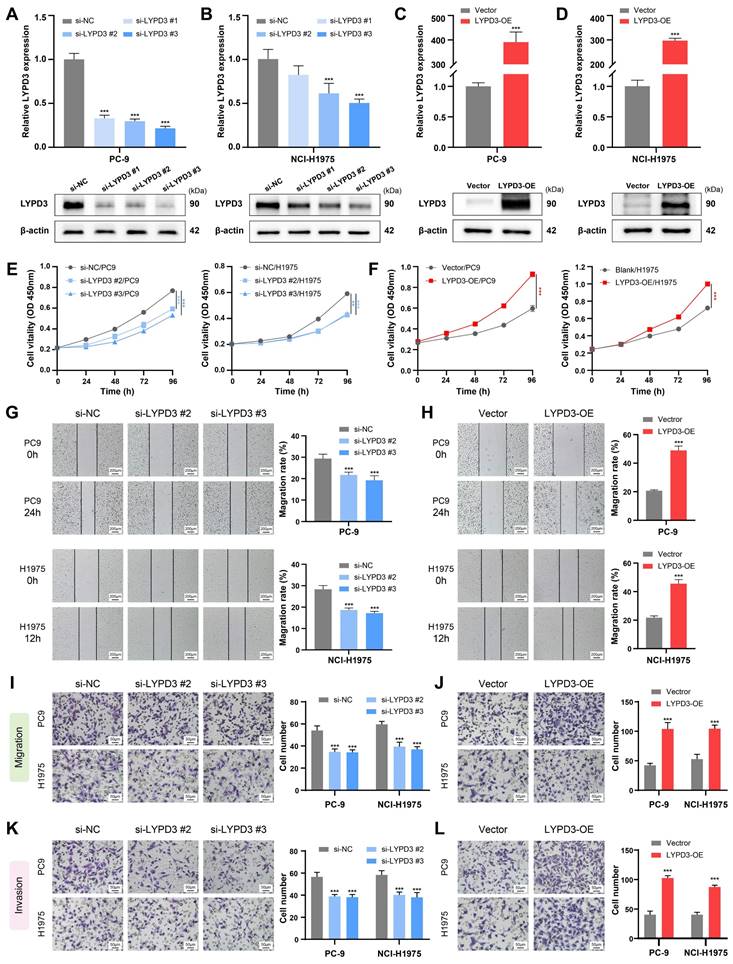
The biological function of LYPD3 was experimentally validated in LUAD cell lines, due to its highest important coefficient in the PMRS model. Two LUAD cell lines PC-9 and NCI-H1975, belonging to PMRS-high and -low subgroups, respectively, were selected for further experiments. RT-qPCR and Western blot demonstrated that siRNA and plasmid successfully regulated LYPD3 expression in PC-9 and NCI-H1975, both at mRNA and protein levels (Figure 8A-8D). si-LYPD3 #2 and #3 were chosen for subsequent functional experiments due to their remarkable knockdown efficiency. The CCK8 assay demonstrated that LYPD3 overexpression promoted the proliferation of LUAD cell lines, while LYPD3 knockdown impeded tumor growth (Figure 8E, 8F). Moreover, the wound healing and Transwell assays elucidated that the overexpression of LYPD3 promoted the migration and invasion of LUAD cell lines, whereas LYPD3 knockdown exerted the opposite effect (Figure 8G-8L). These findings confirmed the pivotal role of LYPD3 in carcinogenesis, as predicted by bioinformatics analysis.
Experimental validation of LYPD3 in LUAD cell lines. (A-D) RT-qPCR and Western blot were applied to assess the expression of LYPD3 in PC-9 and NCI-H1975. (E-F) CCK8 assay was used to determine the proliferation of PC-9 and NCI-H1975 transfected with si-LYPD3 or pcDNA3.1-CMV-LYPD3. (G-H) Wound-healing assay was utilized to analyze the migratory activity of PC-9 and NCI-H1975 with the overexpression or knockdown of LYPD3. (I-J) Transwell migration assay was used to evaluate the migration of transfected A549 and PC9 cells. (K-L) Transwell invasion assay was used to detect invasion after transfection with si-LYPD3 or pcDNA3.1- CMV-LYPD3. Data are presented as mean ± 95% confidence interval [CI]. **P < 0.01; ***P < 0.001.
Discussion
Recently, the phenomenon of tumor metabolic reprogramming has emerged as a prominent area of research. Through altering their metabolic patterns, tumor cells can not only obtain additional energy to sustain survival, but participate in the epigenetic modification or confer immunosuppressive properties to the TME via metabolic by-products (58-60). In this study, we constructed the PMRS model based on pyrimidine metabolism-related genes and evaluated its prognostic value. Our PMRS model worked independently of the existing clinical indicators, and exhibits superior performance in predicting prognosis as assessed by the C-index. Univariate Cox regression also reveals that, apart from PMRS, no other signatures maintain prognostic significance across all cohorts. In addition, we performed corresponding multi-omics analysis, which not only deepened our comprehension of genomic and metabolic landscapes of LUAD patients, but also promoted the development of precision medicine strategies.
Dysregulated pyrimidine metabolism has been reported to result in the potential for DNA damage and mutational bias (57). The PMRS score indicated that there was a notable enhancement in both de novo pyrimidine synthesis and salvage pathways, while the activity of pyrimidine degradation was relatively diminished. Moreover, patients with higher PMRS scores exhibited a higher frequency of somatic mutations, SCNAs, as well as a higher levels of TMB. In KRAS/LKB1 co-mutant lung cancer cells, CPS1 depletion led to the DNA damage with an imbalanced purine/pyrimidine ratio (61). Meanwhile, CAD was involved in the clonal evolution in hepatocellular carcinoma, along with the accumulation of SCNAs (62). Subsequently, the mutation landscape of DDR pathways were analyzed (31,63). It indicated that PMRS-high patients had more DDR mutations. Although recent studies suggest that DDR mutations may enhance the immunotherapy efficacy by increasing the neoantigen load, the rapid accumulation of somatic mutations enabled by the aberrant DDR signaling is also non-negligible. This process significantly promotes tumor heterogeneity and clonal diversification (64,65). This might partially explain why PMRS-high patients have higher TMB but have worse survival compared to those PMRS-low patients.
Drug sensitivity analysis of LUAD patients based on PMRS stratification revealed that patients with higher PMRS were more likely to benefit from AZD6738, docetaxel, erlotinib, gefitinib, lapatinib, MK-1775, paclitaxel, UMI-77 and WIKI4. AZD6738 is an ATR kinase inhibitor with a pyrimidine ring structure that targets DDR pathways. Several clinical trials have reported its potential as a monotherapy or in combination with chemotherapy, PARP inhibitors or immunotherapy (66,67). MK-1775, a novel WEE1 kinase inhibitor, were reported to enhance current chemotherapy for its functions during cell cycle and in DNA damage repair (68,69).
Unlike purine metabolism, directly inhibiting peripheral immune cells through its metabolite adenosine, underlying mechanisms of pyrimidine metabolism in the TIME remains poorly understood (70). Our immune infiltration analysis suggested that the enrichment of pyrimidine metabolism increased macrophage infiltration and inhibited the infiltration of T cells, as well as the antigen presentation process. These findings are supported by similar results observed in recent studies. For example, CDA upregulation promoted the accumulation of extracellular uridine diphosphate (UDP), leading to the immunosuppression via P2Y6 receptors on tumor-associated macrophages (TAMs) (71). While inhibiting DHODH in in de novo synthesis, the antigen presentation process was potentiated in a pyrimidine depletion-dependent manner (72). Similarly, the enrichment of pyrimidine metabolism in immune cells also confers therapeutic resistance to cancer cells. Pancreatic ductal adenocarcinoma programmed TAMs not only facilitated their own uptake of gemcitabine by upregulating CDA expression, but also competitively inhibited the uptake of gemcitabine by tumor cells through deoxycytidine secretion (73,74). Hence, it is reasonable to conclude that increased pyrimidine metabolism leads to immune suppression and thus reduces immunotherapeutic efficacy, as predicted by TIDE and immunotherapy cohorts.
Single-cell sequencing and pseudo-time trajectory analysis revealed that PMRS was significantly enriched in the advanced stage of LUAD differentiation, indicating enhanced pyrimidine metabolism might be an acquired hallmark during the malignant differentiation process. Metabolomic analysis of LUAD cell lines indicated an inverse correlation between PMRS and pyrimidine metabolite abundance, implying the salvage pathway was enriched during LUAD progression. Moreover, our findings also revealed the metabolic crosstalk between pyrimidine metabolism and glucose, as well as its clue to immunosuppression.
Lastly, LYPD3 exhibited its significant correlation with malignant phenotypes in both PMRS-high and -low LUAD cell lines. Previous studies have reported that LYPD3 is associated with a poor prognosis in LUAD patients (75). In addition, blocking the downstream pathways activated by LYPD3 and its ligand AGR2 facilitated the progress of endocrine therapy-resistant breast cancer and pancreatic carcinoma (76,77). Other research also mentioned that LYPD3 was involved in the processes of glycolysis and TIME formation in melanoma (78). Our study here revealed the potential link between LYPD3 and pyrimidine metabolism for the first time, suggesting LYPD3 might be a promising biomarker and/or therapeutic target for individualized precision medicine of LUAD patients.
Despite the excellent accuracy and robustness of the PMRS model, this study still has several limitations. First, our study is based on the retrospective clinical cohorts from public databases, lacking the validation from prospective clinical trials. In addition, in vitro experiments are limited in the preliminary function of LYPD3. Nevertheless, we are in the process of further validation and investigation. These limitations will be addressed in future research.
Conclusion
In summary, our study constructed a prognostic signature of pyrimidine metabolic characteristics for LUAD patients, and systematically revealed the role of PMRS in prognosis, genomic stability, as well as chemotherapy and immunotherapy resistance through multi-omics and single-cell analysis. More clinical and experimental studies are expected to validate these findings in the future.
Supplementary Material
Supplementary figures and tables.
Acknowledgements
We would like to thank the Core Facility of the First Affiliated Hospital of Nanjing Medical University for the help in this work.
Funding
This work was supported by National Natural Science Foundation of China (82172889) and Jiangsu Province Capability Improvement Project through Science, Technology and Education (CXZX202204).
Data availability
All presented datasets in this study are available in public databases. The RNA-seq and WES data of the TCGA-LUAD dataset are downloaded from the GDC Data Portal (https://portal.gdc.cancer.gov/) and the cBioPortal (https://www.cbioportal.org/). The GEO datasets (GSE42127, GSE68465, GSE72094, GSE91061, GSE100797, and GSE131907) are available in the National Center for Biotechnology Information Portal (https://www.ncbi.nlm.nih.gov/geo/). The transcriptome profiles, drug sensitivity data and metabolomic results of LUAD cell lines can be obtained from the DepMap Portal (https://depmap.org/portal/) and the CCLE Portal (https://sites.broadinstitute.org/ccle/).
Author contributions
Y. S. contributed to the conception and design of the study. T. H. and R. S. collected the databases and performed the analysis. T. H., Y. X. and T. X. applied the experiments for validation. T. H. and R. S. wrote the first draft of the manuscript. Y. F., Y. G. and Z. Z. assisted with data analysis and language improvement. All authors read and approved the final manuscript.
Competing Interests
The authors have declared that no competing interest exists.
References
1. Bray F, Laversanne M, Sung H, Ferlay J, Siegel RL, Soerjomataram I. et al. Global cancer statistics 2022: GLOBOCAN estimates of incidence and mortality worldwide for 36 cancers in 185 countries. CA Cancer J Clin. 2024;74(3):229-63
2. Hirsch FR, Scagliotti GV, Mulshine JL, Kwon R, Curran WJ, Wu YL. et al. Lung cancer: current therapies and new targeted treatments. Lancet Lond Engl. 2017Jan21;389(10066):299-311
3. Zhang Y, Vaccarella S, Morgan E, Li M, Etxeberria J, Chokunonga E. et al. Global variations in lung cancer incidence by histological subtype in 2020: a population-based study. Lancet Oncol. 2023Nov;24(11):1206-18
4. Shi DD, Savani MR, Abdullah KG, McBrayer SK. Emerging roles of nucleotide metabolism in cancer. Trends Cancer. 2023Aug;9(8):624-35
5. Mullen NJ, Singh PK. Nucleotide metabolism: a pan-cancer metabolic dependency. Nat Rev Cancer. 2023May;23(5):275-94
6. Ariav Y, Ch'ng JH, Christofk HR, Ron-Harel N, Erez A. Targeting nucleotide metabolism as the nexus of viral infections, cancer, and the immune response. Sci Adv. 2021May;7(21):eabg6165
7. Siddiqui A, Ceppi P. A non-proliferative role of pyrimidine metabolism in cancer. Mol Metab. 2020May;35:100962
8. Tang H, Xiao G, Behrens C, Schiller J, Allen J, Chow CW. et al. A 12-gene set predicts survival benefits from adjuvant chemotherapy in non-small cell lung cancer patients. Clin Cancer Res Off J Am Assoc Cancer Res. 2013Mar15;19(6):1577-86
9. Director's Challenge Consortium for the Molecular Classification of Lung Adenocarcinoma, Shedden K, Taylor JMG, Enkemann SA, Tsao MS, Yeatman TJ. et al. Gene expression-based survival prediction in lung adenocarcinoma: a multi-site, blinded validation study. Nat Med. 2008Aug;14(8):822-7
10. Schabath MB, Welsh EA, Fulp WJ, Chen L, Teer JK, Thompson ZJ. et al. Differential association of STK11 and TP53 with KRAS mutation-associated gene expression, proliferation and immune surveillance in lung adenocarcinoma. Oncogene. 2016Jun16;35(24):3209-16
11. de Bruijn I, Kundra R, Mastrogiacomo B, Tran TN, Sikina L, Mazor T. et al. Analysis and Visualization of Longitudinal Genomic and Clinical Data from the AACR Project GENIE Biopharma Collaborative in cBioPortal. Cancer Res. 2023Dec1;83(23):3861-7
12. Hänzelmann S, Castelo R, Guinney J. GSVA: gene set variation analysis for microarray and RNA-seq data. BMC Bioinformatics. 2013Jan16;14:7
13. Liberzon A, Birger C, Thorvaldsdóttir H, Ghandi M, Mesirov JP, Tamayo P. The Molecular Signatures Database (MSigDB) hallmark gene set collection. Cell Syst. 2015Dec23;1(6):417-25
14. Lin H, Zelterman D. Modeling Survival Data: Extending the Cox Model. Technometrics. 2002Feb1;44(1):85-6
15. Wilkerson MD, Hayes DN. ConsensusClusterPlus: a class discovery tool with confidence assessments and item tracking. Bioinforma Oxf Engl. 2010Jun15;26(12):1572-3
16. Ritchie ME, Phipson B, Wu D, Hu Y, Law CW, Shi W. et al. limma powers differential expression analyses for RNA-sequencing and microarray studies. Nucleic Acids Res. 2015Apr20;43(7):e47
17. Wu T, Hu E, Xu S, Chen M, Guo P, Dai Z. et al. clusterProfiler 4.0: A universal enrichment tool for interpreting omics data. Innov Camb Mass. 2021Aug28;2(3):100141
18. Ishwaran H, Kogalur UB, Blackstone EH, Lauer MS. Random survival forests. Ann Appl Stat. 2008Sep;2(3):841-60
19. Friedman J, Hastie T, Tibshirani R. Regularization Paths for Generalized Linear Models via Coordinate Descent. J Stat Softw. 2010;33(1):1-22
20. Binder H, Allignol A, Schumacher M, Beyersmann J. Boosting for high-dimensional time-to-event data with competing risks. Bioinforma Oxf Engl. 2009Apr1;25(7):890-6
21. Bair E, Hastie T, Paul D, Tibshirani R. Prediction by Supervised Principal Components. J Am Stat Assoc. 2006Mar1;101(473):119-37
22. Bastien P, Bertrand F, Meyer N, Maumy-Bertrand M. Deviance residuals-based sparse PLS and sparse kernel PLS regression for censored data. Bioinforma Oxf Engl. 2015Feb1;31(3):397-404
23. Ridgeway G. Generalized Boosted Models: A guide to the gbm package. Update. 2007;1(1):2007
24. Fouodo CJ, König IR, Weihs C, Ziegler A, Wright MN. Support Vector Machines for Survival Analysis with R. R J. 2018 10(1)
25. Chen T, Guestrin C. XGBoost: A Scalable Tree Boosting System. In: Proceedings of the 22nd ACM SIGKDD International Conference on Knowledge Discovery and Data Mining. New York, NY, USA: Association for Computing Machinery. 2016 p. 785-94
26. Candel A, LeDell E. Deep Learning with H2O. 2016.
27. Shi R, Wang X, Wu Y, Xu B, Zhao T, Trapp C. et al. APOBEC-mediated mutagenesis is a favorable predictor of prognosis and immunotherapy for bladder cancer patients: evidence from pan-cancer analysis and multiple databases. Theranostics. 2022;12(9):4181-99
28. Mayakonda A, Lin DC, Assenov Y, Plass C, Koeffler HP. Maftools: efficient and comprehensive analysis of somatic variants in cancer. Genome Res. 2018Nov;28(11):1747-56
29. Chalmers ZR, Connelly CF, Fabrizio D, Gay L, Ali SM, Ennis R. et al. Analysis of 100,000 human cancer genomes reveals the landscape of tumor mutational burden. Genome Med. 2017Apr19;9(1):34
30. Mermel CH, Schumacher SE, Hill B, Meyerson ML, Beroukhim R, Getz G. GISTIC2.0 facilitates sensitive and confident localization of the targets of focal somatic copy-number alteration in human cancers. Genome Biol. 2011;12(4):R41
31. Jiang M, Jia K, Wang L, Li W, Chen B, Liu Y. et al. Alterations of DNA damage response pathway: Biomarker and therapeutic strategy for cancer immunotherapy. Acta Pharm Sin B. 2021Oct;11(10):2983-94
32. Olaussen KA, Dunant A, Fouret P, Brambilla E, André F, Haddad V. et al. DNA repair by ERCC1 in non-small-cell lung cancer and cisplatin-based adjuvant chemotherapy. N Engl J Med. 2006Sep7;355(10):983-91
33. Tsherniak A, Vazquez F, Montgomery PG, Weir BA, Kryukov G, Cowley GS. et al. Defining a Cancer Dependency Map. Cell. 2017Jul27;170(3):564-576.e16
34. Nusinow DP, Szpyt J, Ghandi M, Rose CM, McDonald ER, Kalocsay M. et al. Quantitative Proteomics of the Cancer Cell Line Encyclopedia. Cell. 2020Jan23;180(2):387-402.e16
35. Maeser D, Gruener RF, Huang RS. oncoPredict: an R package for predicting in vivo or cancer patient drug response and biomarkers from cell line screening data. Brief Bioinform. 2021Nov5;22(6):bbab260
36. Barbie DA, Tamayo P, Boehm JS, Kim SY, Moody SE, Dunn IF. et al. Systematic RNA interference reveals that oncogenic KRAS-driven cancers require TBK1. Nature. 2009Nov5;462(7269):108-12
37. Newman AM, Liu CL, Green MR, Gentles AJ, Feng W, Xu Y. et al. Robust enumeration of cell subsets from tissue expression profiles. Nat Methods. 2015May;12(5):453-7
38. Yoshihara K, Shahmoradgoli M, Martínez E, Vegesna R, Kim H, Torres-Garcia W. et al. Inferring tumour purity and stromal and immune cell admixture from expression data. Nat Commun. 2013;4:2612
39. Finotello F, Mayer C, Plattner C, Laschober G, Rieder D, Hackl H. et al. Molecular and pharmacological modulators of the tumor immune contexture revealed by deconvolution of RNA-seq data. Genome Med. 2019May24;11(1):34
40. Li B, Liu JS, Liu XS. Revisit linear regression-based deconvolution methods for tumor gene expression data. Genome Biol. 2017Jul5;18(1):127
41. Charoentong P, Finotello F, Angelova M, Mayer C, Efremova M, Rieder D. et al. Pan-cancer Immunogenomic Analyses Reveal Genotype-Immunophenotype Relationships and Predictors of Response to Checkpoint Blockade. Cell Rep. 2017Jan3;18(1):248-62
42. Becht E, Giraldo NA, Lacroix L, Buttard B, Elarouci N, Petitprez F. et al. Estimating the population abundance of tissue-infiltrating immune and stromal cell populations using gene expression. Genome Biol. 2016Oct20;17(1):218
43. Aran D, Hu Z, Butte AJ. xCell: digitally portraying the tissue cellular heterogeneity landscape. Genome Biol. 2017Nov15;18(1):220
44. Racle J, de Jonge K, Baumgaertner P, Speiser DE, Gfeller D. Simultaneous enumeration of cancer and immune cell types from bulk tumor gene expression data. eLife. 2017Nov13;6:e26476
45. Xu L, Deng C, Pang B, Zhang X, Liu W, Liao G. et al. TIP: A Web Server for Resolving Tumor Immunophenotype Profiling. Cancer Res. 2018Dec1;78(23):6575-80
46. Mariathasan S, Turley SJ, Nickles D, Castiglioni A, Yuen K, Wang Y. et al. TGFβ attenuates tumour response to PD-L1 blockade by contributing to exclusion of T cells. Nature. 2018Feb22;554(7693):544-8
47. Thorsson V, Gibbs DL, Brown SD, Wolf D, Bortone DS, Ou Yang TH. et al. The Immune Landscape of Cancer. Immunity. 2018Apr17;48(4):812-830.e14
48. Fu J, Li K, Zhang W, Wan C, Zhang J, Jiang P. et al. Large-scale public data reuse to model immunotherapy response and resistance. Genome Med. 2020Feb26;12(1):21
49. Riaz N, Havel JJ, Makarov V, Desrichard A, Urba WJ, Sims JS. et al. Tumor and Microenvironment Evolution during Immunotherapy with Nivolumab. Cell. 2017Nov2;171(4):934-949.e16
50. Lauss M, Donia M, Harbst K, Andersen R, Mitra S, Rosengren F. et al. Mutational and putative neoantigen load predict clinical benefit of adoptive T cell therapy in melanoma. Nat Commun. 2017Nov23;8(1):1738
51. Hao Y, Hao S, Andersen-Nissen E, Mauck WM, Zheng S, Butler A. et al. Integrated analysis of multimodal single-cell data. Cell. 2021Jun24;184(13):3573-3587.e29
52. Aran D, Looney AP, Liu L, Wu E, Fong V, Hsu A. et al. Reference-based analysis of lung single-cell sequencing reveals a transitional profibrotic macrophage. Nat Immunol. 2019Feb;20(2):163-72
53. ENCODE Project Consortium. An integrated encyclopedia of DNA elements in the human genome. Nature. 2012Sep6;489(7414):57-74
54. Puram SV, Tirosh I, Parikh AS, Patel AP, Yizhak K, Gillespie S. et al. Single-Cell Transcriptomic Analysis of Primary and Metastatic Tumor Ecosystems in Head and Neck Cancer. Cell. 2017Dec14;171(7):1611-1624.e24
55. Qiu X, Hill A, Packer J, Lin D, Ma YA, Trapnell C. Single-cell mRNA quantification and differential analysis with Census. Nat Methods. 2017Mar;14(3):309-15
56. Jin S, Guerrero-Juarez CF, Zhang L, Chang I, Ramos R, Kuan CH. et al. Inference and analysis of cell-cell communication using CellChat. Nat Commun. 2021Feb17;12(1):1088
57. Lee JS, Adler L, Karathia H, Carmel N, Rabinovich S, Auslander N. et al. Urea Cycle Dysregulation Generates Clinically Relevant Genomic and Biochemical Signatures. Cell. 2018Sep6;174(6):1559-1570.e22
58. Hanahan D, Weinberg RA. Hallmarks of cancer: the next generation. Cell. 2011Mar4;144(5):646-74
59. Sun L, Zhang H, Gao P. Metabolic reprogramming and epigenetic modifications on the path to cancer. Protein Cell. 2022Dec;13(12):877-919
60. Xia L, Oyang L, Lin J, Tan S, Han Y, Wu N. et al. The cancer metabolic reprogramming and immune response. Mol Cancer. 2021Feb5;20(1):28
61. Kim J, Hu Z, Cai L, Li K, Choi E, Faubert B. et al. CPS1 maintains pyrimidine pools and DNA synthesis in KRAS/LKB1-mutant lung cancer cells. Nature. 2017Jun1;546(7656):168-72
62. Guo L, Yi X, Chen L, Zhang T, Guo H, Chen Z. et al. Single-Cell DNA Sequencing Reveals Punctuated and Gradual Clonal Evolution in Hepatocellular Carcinoma. Gastroenterology. 2022Jan;162(1):238-52
63. Huang R, Zhou PK. DNA damage repair: historical perspectives, mechanistic pathways and clinical translation for targeted cancer therapy. Signal Transduct Target Ther. 2021Jul9;6(1):254
64. Vitale I, Shema E, Loi S, Galluzzi L. Intratumoral heterogeneity in cancer progression and response to immunotherapy. Nat Med. 2021Feb;27(2):212-24
65. Klapp V, Álvarez-Abril B, Leuzzi G, Kroemer G, Ciccia A, Galluzzi L. The DNA Damage Response and Inflammation in Cancer. Cancer Discov. 2023Jul7;13(7):1521-45
66. Wilson Z, Odedra R, Wallez Y, Wijnhoven PWG, Hughes AM, Gerrard J. et al. ATR Inhibitor AZD6738 (Ceralasertib) Exerts Antitumor Activity as a Monotherapy and in Combination with Chemotherapy and the PARP Inhibitor Olaparib. Cancer Res. 2022Mar15;82(6):1140-52
67. Kim R, Kwon M, An M, Kim ST, Smith SA, Loembé AB. et al. Phase II study of ceralasertib (AZD6738) in combination with durvalumab in patients with advanced/metastatic melanoma who have failed prior anti-PD-1 therapy. Ann Oncol Off J Eur Soc Med Oncol. 2022Feb;33(2):193-203
68. Ghelli Luserna di Rorà A, Cerchione C, Martinelli G, Simonetti G. A WEE1 family business: regulation of mitosis, cancer progression, and therapeutic target. J Hematol OncolJ Hematol Oncol. 2020Sep21;13(1):126
69. Hirai H, Arai T, Okada M, Nishibata T, Kobayashi M, Sakai N. et al. MK-1775, a small molecule Wee1 inhibitor, enhances anti-tumor efficacy of various DNA-damaging agents, including 5-fluorouracil. Cancer Biol Ther. 2010Apr1;9(7):514-22
70. Madsen HB, Peeters MJ, Straten PT, Desler C. Nucleotide metabolism in the regulation of tumor microenvironment and immune cell function. Curr Opin Biotechnol. 2023Dec;84:103008
71. Scolaro T, Manco M, Pecqueux M, Amorim R, Trotta R, Van Acker HH. et al. Nucleotide metabolism in cancer cells fuels a UDP-driven macrophage cross-talk, promoting immunosuppression and immunotherapy resistance. Nat Cancer. 2024Aug;5(8):1206-26
72. Mullen NJ, Shukla SK, Thakur R, Kollala SS, Wang D, Chaika N. et al. DHODH inhibition enhances the efficacy of immune checkpoint blockade by increasing cancer cell antigen presentation. eLife. 2024Jul8;12:RP87292
73. Halbrook CJ, Pontious C, Kovalenko I, Lapienyte L, Dreyer S, Lee HJ. et al. Macrophage-Released Pyrimidines Inhibit Gemcitabine Therapy in Pancreatic Cancer. Cell Metab. 2019Jun4;29(6):1390-1399.e6
74. Weizman N, Krelin Y, Shabtay-Orbach A, Amit M, Binenbaum Y, Wong RJ. et al. Macrophages mediate gemcitabine resistance of pancreatic adenocarcinoma by upregulating cytidine deaminase. Oncogene. 2014Jul17;33(29):3812-9
75. Jacobsen B, Muley T, Meister M, Dienemann H, Christensen IJ, Santoni-Rugiu E. et al. Ly6/uPAR-related protein C4.4A as a marker of solid growth pattern and poor prognosis in lung adenocarcinoma. J Thorac Oncol Off Publ Int Assoc Study Lung Cancer. 2013Feb;8(2):152-60
76. Cocce KJ, Jasper JS, Desautels TK, Everett L, Wardell S, Westerling T. et al. The Lineage Determining Factor GRHL2 Collaborates with FOXA1 to Establish a Targetable Pathway in Endocrine Therapy-Resistant Breast Cancer. Cell Rep. 2019Oct22;29(4):889-903.e10
77. Arumugam T, Deng D, Bover L, Wang H, Logsdon CD, Ramachandran V. New Blocking Antibodies against Novel AGR2-C4.4A Pathway Reduce Growth and Metastasis of Pancreatic Tumors and Increase Survival in Mice. Mol Cancer Ther. 2015Apr;14(4):941-51
78. Hu YD, Wu K, Liu YJ, Zhang Q, Shen H, Ji J. et al. LY6/PLAUR domain containing 3 (LYPD3) maintains melanoma cell stemness and mediates an immunosuppressive microenvironment. Biol Direct. 2023Nov3;18(1):72
79. Gu Y, Lin S, Li JL, Nakagawa H, Chen Z, Jin B. et al. Altered LKB1/CREB-regulated transcription co-activator (CRTC) signaling axis promotes esophageal cancer cell migration and invasion. Oncogene. 2012Jan26;31(4):469-79
Author contact
![]() Corresponding author: shuyongqianorg.cn.
Corresponding author: shuyongqianorg.cn.