Impact Factor ISSN: 1449-1907
- Issue 9; 2026
- Issue 8; 2026
- Issue 7; 2026
- Issue 6; 2026
- Issue 5; 2026
- Volume 23; 2026
- Past Issues
- Editorial Board
- Cover Images
- Index & Coverage
- Cover Suggestion
- Special Issues
Introduction
Materials and Methods
Results
Discussion
Conclusion
Supplementary Material
Acknowledgements
References

 Global reach, higher impact
Int J Med Sci 2025; 22(10):2318-2332. doi:10.7150/ijms.109721 This issue Cite
Research Paper
Cracking Chordoma's Conundrum: Immune Checkpoints Provide a Potential Modality
Weihai Liu1,2,#, Moksada Regmi1,2,3,#, Xiaodong Chen1,2,#, Shikun Liu1,2, Ying Xiong1,2, Yuwei Dai1,2, Yingjie Wang1,2, Jun Yang1,2, ![]() , Chenlong Yang1,2,
, Chenlong Yang1,2, ![]()
1. State Key Laboratory of Vascular Homeostasis and Remodeling, Department of Neurosurgery, Peking University Third Hospital, Peking University, Beijing 100191, China.
2. Center for Precision Neurosurgery and Oncology of Peking University Health Science Center, Peking University, Beijing 100191, China.
3. Peking University Health Science Center, Beijing 100191, China.
#These authors have contributed equally to this work and are considered co-first authors.
Received 2025-1-1; Accepted 2025-4-3; Published 2025-4-22
Abstract

Objectives: Chordoma, a rare malignant tumor, is notably resistant to conventional treatments including chemotherapy, radiotherapy, and targeted approaches. Immunotherapy, successful in treating other cancer types, presents a promising avenue. However, the immune microenvironment of chordoma is poorly understood, highlighting the need to investigate immune checkpoints and their potential as therapeutic targets in this context.
Methods: We performed an integrated analysis of chordoma using public datasets (GSE224776, GSE56183, GSE239531) and our RNA-seq data (11 samples). Differential expression analysis (limma), gene set enrichment analysis (GSEA, clusterProfiler), immune cell infiltration assessment (ESTIMATE, immunedeconv), weighted gene co-expression network analysis (WGCNA), consensus clustering, and machine learning were employed to identify key immune-related gene modules, immunogenic subtypes, and central immune regulators.
Results: Hierarchical clustering and principal component analysis segregated chordoma from control samples post quality control. Differential expression analysis identified 2825 upregulated and 1693 downregulated genes, with significant upregulation of immune checkpoints, including PD-1 and CTLA-4. GSEA highlighted enhanced immune-related processes, particularly inflammatory responses, antigen presentation, and immune cell activation. Immune cell deconvolution demonstrated selective enrichment of memory T cells and macrophages, alongside downregulation of neutrophils and decreased effector cell scores. Consensus clustering identified a highly immunogenic chordoma subtype (Cluster 1), and WGCNA and machine learning converged on CCR7 as a central immune regulator, with core T cell-associated genes correlating with immune cell distribution patterns.
Conclusion: This study characterizes the chordoma immune landscape, highlighting elevated immune checkpoints, distinct immunogenic subtypes, and a T cell-centered regulatory network. These findings support immune checkpoint inhibitors and other immunotherapies as promising treatments.
Keywords: chordoma, differential expression, immune checkpoints, immune checkpoint inhibitors
Introduction
Chordoma is a rare, aggressive bone tumor from notochord remnants, affecting about 0.1 per 100,000 people, and poses major treatment challenges [1, 2]. These tumors predominantly occur in the sacrococcygeal region and skull base, often leading to debilitating compression of adjacent neurovascular structures [3]. Despite being rare, chordomas are notorious for their aggressive nature, high recurrence rates, and resistance to conventional treatments, including radical resection and high-dose irradiation, resulting in substantial morbidity and mortality [4].
Surgical intervention remains the primary treatment for chordoma, offering benefits in long-term survival and local control. However, the tumor's close proximity to critical neural structures complicates complete removal. In many cases, surgeons are unable to excise the entire tumor, and around 30% of patients experience distant spread, necessitating additional surgeries that may not always be effective [5, 6]. Even with macroscopic complete resections, more than 50% of patients face locoregional recurrence, with five-year survival rates typically ranging from 65% to 70% [7-11]. Unfortunately, surgery can also cause severe pain, loss of function, and, in some cases, death [12].
Radiotherapy, while offering local control and providing therapeutic and palliative benefits, is limited in dosage escalation due to the proximity to brainstem and spinal cord. Patients with recurrent or metastatic chordoma face limited systemic therapy options, and the prognosis remains dismal with a median overall survival of 6-9 months [13, 14]. Chordoma is resistant to chemotherapy, potentially due to a low proliferation pool of cells. Only a few targeted drugs, such as imatinib and dasatinib, are recommended, based on small-sample studies [15, 16]. Despite aggressive treatment, the 10-year overall survival rate for skull base lesions is approximately 60%, and significantly lower for sacral tumors [17]. These factors underscore the urgent need for more effective systemic therapies.
The lack of effective curative options for chordoma has necessitated the exploration of alternative strategies. Immune checkpoint inhibitors (ICIs), which have revolutionized treatment across multiple tumor histologies, offer a potential new approach. Antibodies targeting CTLA-4, PD-1 and PD-L1 have been approved for the treatment of melanoma, lung cancer, renal cell carcinoma, and several other malignancies [18-21]. Pre-clinical data indicate a complex interaction between chordomas and the immune system, particularly involving PD-1/PD-L1 interactions that may promote chordoma's locally aggressive behavior and immune evasion [22-24]. An analysis of 78 chordoma tumor samples revealed a PD-L1 positivity rate of 94.9%, and another study on 58 spinal chordoma samples showed PD-L1 expression in 68.1% of tumors, with a 70.4% expression rate in tumor-infiltrating lymphocytes [22, 23]. High PD-L1 expression, linked with poor prognosis in various cases, supports the rationale for testing ICIs in chordoma [25].
In our study, we investigate the molecular characteristics of chordoma using a combination of transcriptomic and computational analyses, including differential expression analysis, gene set enrichment analysis (GSEA), immune cell deconvolution, and weighted gene co-expression network analysis. We hypothesize that chordoma exhibits elevated expression of key immune checkpoints, such as PD-1 and CTLA-4, compared to normal tissue. Additionally, we aim to characterize the immune cell composition within chordoma tumors, with a focus on T cells and macrophages, and identify potential immunogenic subtypes that may respond to immunotherapy. If confirmed, our findings could open up novel avenues for employing ICIs and immunotherapeutic strategies in the treatment of chordoma, an approach that has revolutionized the management of various other types of cancer but remains unexplored in this context [26-30].
Materials and Methods
Public data collection and preparation
GSE224776 [31], GSE56183 [32], and GSE239531 [33] were downloaded from the Gene Expression Omnibus (GEO) database. GSE224776 was generated using the Affymetrix Human Genome U133 Plus 2.0 Array, GSE56183 was generated using the Affymetrix Human Gene 1.0 ST Array [probe set (exon) version], and GSE239531 data were generated using the Illumina NovaSeq 6000 platform. For the microarray data, we obtained raw count data, standardized the data using the rma() function in the affy R package [34], annotated the probes in GSE224776 using the hgu133plus2.db R package [35], and annotated the probes in GSE56183 using GPL10739. After merging the two GEO datasets, we performed principal component analysis (PCA) using ggbiplot [36], and corrected batch effects using the removeBatchEffect() function in the limma R package [37]. For GSE239531, after acquiring the raw count expression matrix from GEO and merging it with our self-tested RNA-seq dataset, we annotated probes using the biomaRt package based on Homo_sapiens.GRCh38.112 [38, 39]. Batch correction was performed using Combat-seq in the sva R package [40].
Sample collection and preparation
Chordoma tissue specimens (n=11) were preserved in RNAlater prior to RNA sequencing at Berry Genomics. Total RNA (1 µg per sample) served as input material for library preparation using NEBNext® Ultra™ RNA Library Prep Kit for Illumina® (NEB, USA) according to manufacturer's protocol. Sequencing was performed on an Illumina NovaSeq platform with paired-end reading strategy. Raw data quality assessment was conducted using FastQC [41], followed by adapter sequence removal using Trim Galore [42]. Reads were mapped to the human reference genome using HISAT2, and subsequent quantification was conducted using featureCounts [43, 44].
Differential expression analysis
Differential expression analysis between chordoma and muscle tissue samples was conducted using the limma R package [37]. Genes with adjusted P-value < 0.05 and |log2 fold change| > 1 were identified as differentially expressed genes (DEGs). Volcano plots of DEGs were visualized using the EnhancedVolcano R package [45]. DEGs with log2 fold change < -1 and adjusted P-value < 0.05 were considered downregulated, while those with log2 fold change > 1 and adjusted P-value < 0.05 were considered upregulated. The top 5 up- and down-regulated genes are labeled in the figure.
Gene set enrichment analysis
GSEA was performed using the clusterProfiler R package based on MSigDB collections [46, 47] to investigate potential signaling pathways and biological functions associated with chordoma. Differential transcriptional profiles were identified and sorted by log2 fold change using limma, followed by GSEA enrichment assessment using normalized enrichment score (NES). Results with false discovery rate (FDR) < 0.25 and adjusted P-value < 0.05 were considered statistically significant. The network of interconnected clusters was visualized using the aPEAR package [48], and GSEA enrichment analysis results were visualized using the GseaVis R package [49].
Immune cell analysis
After merging GSE224776 and GSE56183 datasets, immune and stromal scores were calculated for normal and chordoma samples using the ESTIMATE R package [50]. Immune infiltration was assessed using the immunedeconv R package [51] with multiple algorithms: CIBERSORT [52], xCell [53], quanTIseq [54], ABIS [55], EPIC [56], and MCPcounter [57]. Immune-related gene sets and immune checkpoint gene sets were obtained from the literature. The ssGSEA algorithm in the GSVA R package was used to score immune genes and immune checkpoints across samples [58]. Immunophenotypic scoring was calculated using the IOBR R package [59]. Immune infiltration stacked and box plots were generated using the ggplot2 R package, and violin plots were created using the ggpubr R package [60, 61].
Weighted gene co-expression network analysis
Weighted Gene Co-expression Network Analysis (WGCNA) was used to cluster genes with similar expression patterns and identify gene groups associated with specific traits [62]. The coefficient of variation (CV = standard deviation/mean) of 30 samples was used for gene screening. We selected 6,296 genes with CV > 0.1 for WGCNA analysis. Network construction used a soft threshold parameter (β), determined by the lowest power when the scale-free topological model fit reached 0.85. A cluster tree was plotted with different colors representing modules, and highly similar dynamic modules were merged when the tangent was 0.25. Pearson correlation analysis examined relationships between gene modules to identify those most strongly associated with cluster classification. Gene significance (GS) and module membership (MM) values were generated. Genes with GS > 0.8 and MM > 0.4 were selected as key module genes.
Consensus clustering
Consensus clustering was used to identify molecular subtypes through multiple data subset analysis and comprehensive clustering. We set the maximum number of categories to 6 and performed 1,000 iterations for each k. Pearson's coefficient was used as the clustering distance. Cluster number was determined using the ConsensusClusterPlus R package [63]. Dimensionality reduction clustering and sample distribution visualization were performed using the Rtsne R package [64, 65].
Protein-protein interaction
Protein-protein interaction (PPI) networks were constructed using STRING (http://string-db.org) [66]. WGCNA-identified candidate genes were entered into STRING, and genes with interaction scores > 0.4 were selected to construct a network model using Cytoscape [67]. The MCODE plugin identified core genes, and only interacting genes were selected for further analysis [68].
Machine learning
Hub gene evaluation employed four distinct machine learning approaches, each selected for their specific strengths in feature selection and ability to manage high-dimensional transcriptomic data: (1) Least Absolute Shrinkage and Selection Operator (LASSO) was chosen for its capacity to perform feature selection through L1 regularization, shrinking coefficients of less important genes to zero, reducing overfitting, and highlighting the most relevant genes; (2) Boruta, a random forest-based method, was selected for its robustness in distinguishing truly predictive genes by comparing them to artificially created shadow features, ensuring only significant contributors are retained; (3) Support Vector Machine - Recursive Feature Elimination (SVM-RFE) was employed due to its effectiveness in ranking genes based on their impact on classification accuracy, iteratively removing less important features to refine the gene set; and (4) eXtreme Gradient Boosting (XGBoost) was included for its superior performance in ranking feature importance via iterative gradient boosting, capturing complex gene interactions and optimizing predictive models. These analyses were implemented using the R packages glmnet [69], caret [70], Boruta [71], and xgboost [72], respectively. The final set of hub genes was determined by intersecting the results from all four algorithms, achieving a consensus on the most critical genes.
Statistical analysis
All statistical analyses were performed using R software (Version 4.3.1) [31]. Spearman's rank correlation test assessed relationships between gene expression and immune cell infiltration. The Wilcoxon test evaluated differences between groups. Results with P-value < 0.05 were considered statistically significant.
Results
Chordoma microenvironment exhibits marked upregulation of immune checkpoints
Analysis of normal tissue and chordoma samples (6 cases each) from GSE224776 and GSE56183 datasets, with batch effect removal using removeBatchEffect from the limma package (Figure S1), revealed distinct differential gene expression patterns as visualized by volcano plots (Figure 1A). The expression analysis identified significant downregulation of SPOCK3, NRK, MYH8, DLK1 and SLN, alongside upregulation of HLA-DQA1, GDA, CXCL11, CXCL9 and ADAMDEC1 in chordomas. To elucidate the biological processes associated with these DEGs, pathway enrichment analysis was performed using GSEA with HallMark, C2 and C5 gene sets from the MSigDB database. These three gene sets provided comprehensive coverage of biological process alterations in chordoma, encompassing tumor hallmarks and common pathway databases including GO, KEGG, Biocarta and Reactome. The analysis revealed enhanced immune-related processes in chordomas compared to normal tissues (Figure 1B-D, Figure S2, Table S1), suggesting crucial involvement of the immune system in chordoma progression through inflammatory responses, antigen presentation and immune cell activation.
Transcriptional and immunological profiling reveals enhanced immune signatures in chordoma. (A) Volcano plot showing differential gene expression between chordoma and normal tissues. Significantly dysregulated genes (|log2 fold change| > 1, P < 0.05) are highlighted, with key upregulated genes (HLA-DQA1, GDA, CXCL11, CXCL9, ADAMDEC1) shown in red and downregulated genes (SPOCK3, NRK, MYH8, DLK1, SLN) in blue. (B-D) Gene Set Enrichment Analysis (GSEA) demonstrating enrichment of immune-related pathways in chordoma using different gene set collections: (B) Hallmark gene sets, (C) GO Biological Process, and (D) KEGG pathways. Running enrichment scores (top) and gene set member positions (bottom) are shown for each analysis. (E-G) Box plots comparing immune-related scores between normal and tumor tissues (n=6 per group): (E) ImmuneScore, (F) StromalScore, and (G) ESTIMATEScore. Center lines show medians; box limits indicate 25th and 75th percentiles; whiskers extend to 1.5× interquartile range. (H) Violin plots showing enrichment scores of seven immune-related gene sets in normal versus tumor samples. (I) Distribution of immune checkpoint scores across three categories: TC-ICGs, IC-ICGs, and TIC-ICGs. (J-L) Violin plots comparing (J) immunophenoscore, (K) MHC score, and (L) effector cell score between normal and tumor tissues. For all statistical comparisons: *P < 0.05, **P < 0.01, ***P < 0.001.
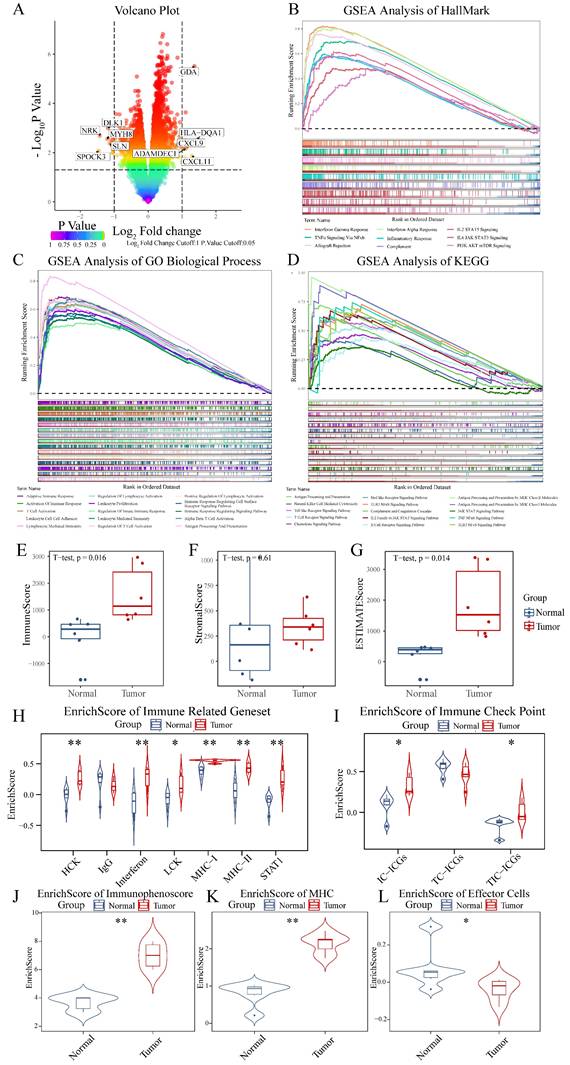
The ESTIMATE algorithm was employed for precise assessment of immune system involvement, demonstrating elevated immune scores and Estimate scores in chordoma versus normal tissues (Figure 1E-G, Table S2) [50]. Comparison of seven types of immune-related gene sets revealed high enrichment scores for HCK, Interferon, LCK, MHC-I and STAT1 in chordoma (Figure 1H, Table S2) [73]. Cancer cells often exploit immune checkpoint mechanisms to escape immune surveillance, with checkpoint expression in the tumor microenvironment classified as tumor cell-dominant (TC-ICGs), immune cell-dominant (IC-ICGs) and tumor and immune cell balanced (TIC-ICGs) [74]. Comparative analysis of immune checkpoint scores revealed elevated IC-ICG and TC-ICG scores in the chordoma microenvironment relative to normal tissue (Figure 1I, Table S2). Immunophenotype analysis [75] revealed elevated immune and MHC scores in chordoma tissue, although effector cell scores, which include activated and memory effector CD4 and CD8 cells, were paradoxically decreased (Figure 1J-L, Table S2).
Chordoma displays selective enrichment of memory T cells and macrophage populations
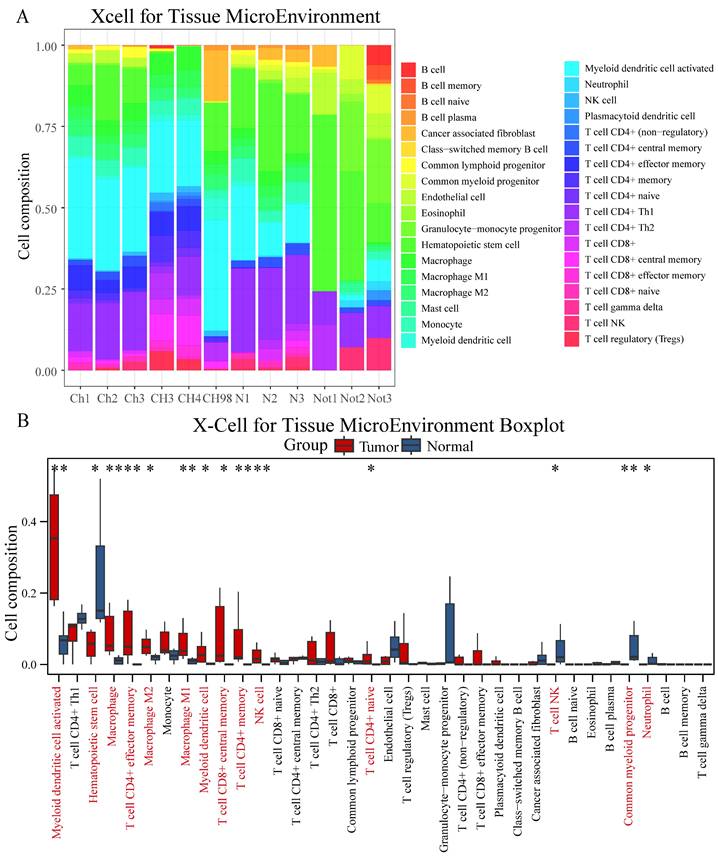
Comprehensive immune cell profiling using six distinct algorithms revealed specific patterns of immune cell infiltration in chordoma. XCell analysis demonstrated significantly higher infiltration of multiple immune cell populations in chordoma compared to normal tissue, particularly myeloid dendritic cells, macrophages (M1 and M2), NK cells, and various T cell subsets (CD8+ central memory, CD4+ memory, CD4+ effector memory, and CD4+ naive) (Figure 2A-B, Table S2). These findings were corroborated by multiple alternative algorithms: Cibersort confirmed increased M1 and M2 macrophage infiltration; Abis showed elevated monocyte and memory T cell populations; MCP Counter indicated enhanced monocyte lineages; and Epic demonstrated increased CD4+ T cell and macrophage presence (Figure S3, Table S2).
Comprehensive immune cell profiling reveals distinct infiltration patterns in chordoma. (A) Stacked bar plot showing the relative proportions of immune cell populations in chordoma (Ch1-CH98) and normal (N1-Not3) samples as determined by XCell algorithm. Colors represent different immune cell types. (B) Box plot comparison of immune cell type abundances between normal and tumor tissues. Red bars indicate tumor samples; blue bars indicate normal samples. Significant differences are marked with asterisks (*P < 0.05, **P < 0.01, ***P < 0.001, ****P < 0.0001). Box plot elements as in Figure 1.
Distinct immune cell clustering reveals a highly immunogenic chordoma subtype
Integration of RNA sequencing data from 12 chordoma patients with the GSE239531 dataset (20 chordoma tissues) enabled comprehensive immune cell profiling. Following outlier removal through tree-based clustering and batch effect correction (Figure S4A-D), XCell-based immune cell profiling and consensus cluster analysis (Figure 3A-C) identified three distinct clusters, clearly differentiated in tSNE visualization (Figure S4E).
Consensus clustering identifies a distinct immune-enriched chordoma subtype. (A) Heatmap showing immune cell composition across 32 chordoma samples based on XCell analysis. (B) Consensus matrix for k=3 clustering shows robust cluster separation. (C) Cumulative distribution function (CDF) curves validating optimal cluster number selection. (D) Violin plots comparing immune-related gene set enrichment scores across three identified clusters. Cluster1 shows distinctly higher scores for multiple immune signatures. Statistical significance indicated as in Figure 1. (E) Bar plot showing the most enriched GO terms in Cluster1, categorized by biological process (red), cellular component (blue), and molecular function (green). Length of bars indicates gene count for each term.
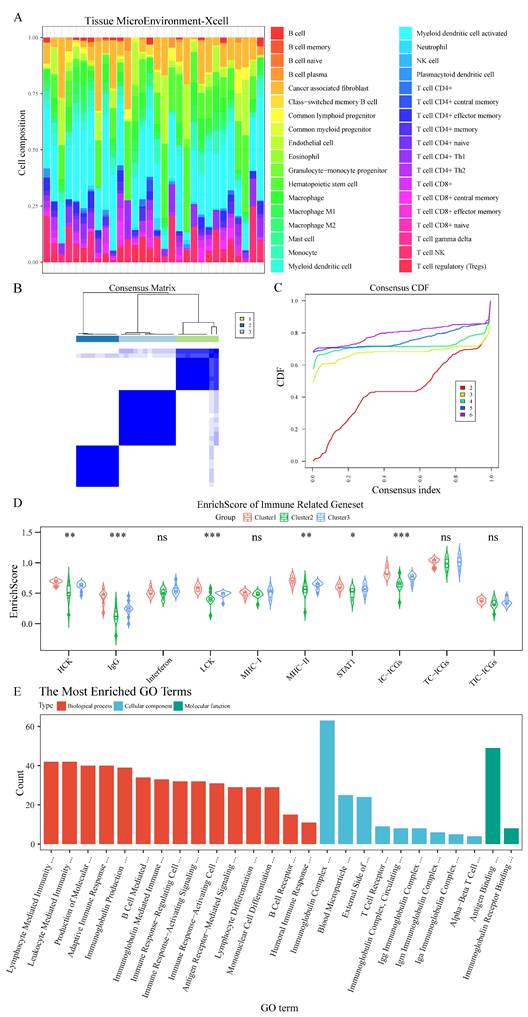
Cluster1 demonstrated significantly higher scores for immune-related genes (HCK, IgG, LCK, MHC-II, STAT1) and enhanced immune checkpoint expression by immune cells (Figure 3D, Table S3). Differential gene analysis (Figure S4F) followed by GO enrichment analysis revealed Cluster1's enhanced involvement in immune system regulation (Figure 3E, Table S4), particularly in lymphocyte-mediated immunity, antigen receptor signaling, and immune response pathways. GSEA further confirmed Cluster1's enrichment in lymphocyte-mediated immunity regulation and immunoglobulin-mediated immune response (Figure S5A, Table S4), with significant involvement in TCR and IL-12 signaling pathways demonstrated through KEGG, Biocarta, and PID datasets (Figure S5B-D, Table S4).
WGCNA identifies discrete gene modules governing immune response in chordoma
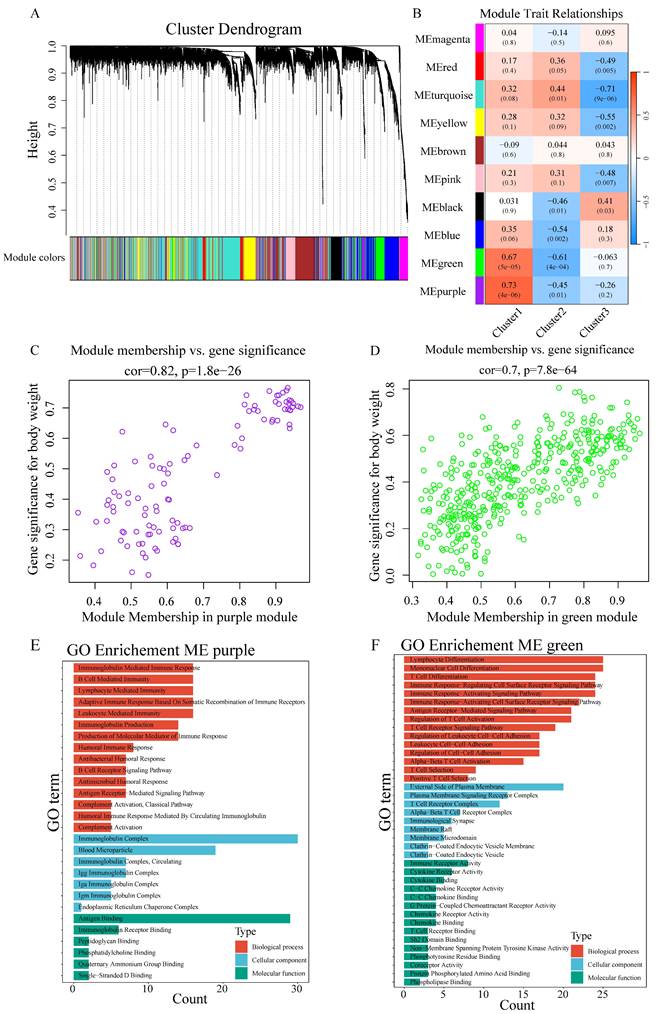
WGCNA-based scale-free network construction was performed to identify immune infiltration-associated gene modules using immune cell cluster classification (Figure S6A). To ensure the network adhered to scale-free topology, a soft-thresholding power of β=7 was selected, achieving R² > 0.85 (Figure S6B). The analysis workflow involved transforming the gene expression matrix into an adjacency matrix, followed by topological matrix conversion. Gene modules were identified using hierarchical clustering based on average connectivity, and dynamic tree cutting was applied with a minimum module size threshold of 50 genes. Dynamic pruning methodology identified 10 distinct modules through characteristic gene value calculation (Figure 4A), with MEpurple (R=0.73, p=4e-06) and MEgreen (R=0.67, p=5e-05) showing strong Cluster1 correlation (Figure 4B). Gene significance (GS>0.6) and module membership (MM>0.8) analysis identified key Cluster1-associated genes (Figure 4C-D). GO enrichment analysis revealed MEpurple module's association with B cell function, particularly immunoglobulin-mediated immune response and B cell receptor signaling, while MEgreen module demonstrated involvement in T cell-related processes, including differentiation and receptor signaling (Figure 4E-F).
WGCNA identifies immune-related gene modules in chordoma. (A) Cluster dendrogram showing gene modules identified by WGCNA. Different colors represent distinct modules. (B) Heatmap showing module-trait relationships. Colors indicate correlation strength (red = positive, blue = negative); numbers in parentheses show P-values. (C,D) Scatter plots showing correlation between module membership and gene significance for (C) MEpurple module (cor=0.82, P=1.8e-26) and (D) MEgreen module (cor=0.7, P=7.8e-64). (E,F) GO enrichment analysis of significant genes in (E) MEpurple and (F) MEgreen modules, categorized by biological process (red), cellular component (blue), and molecular function (green).
Integrated network analysis and machine learning converge on CCR7 as a central immune regulator
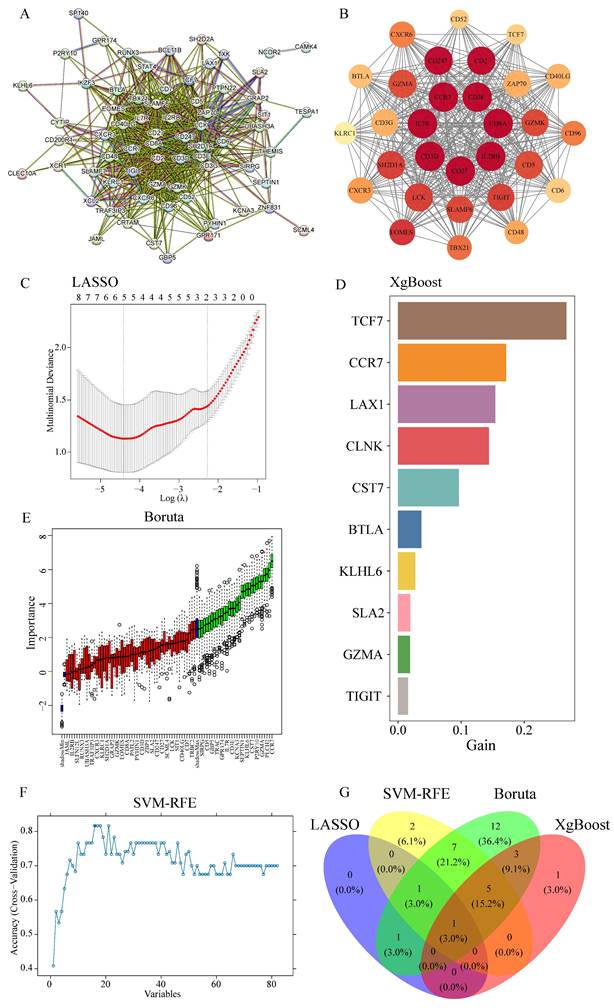
Given the crucial role of T cells in tumor-directed cytotoxicity [76], PPI network analysis of MEgreen module genes using the MCODE algorithm in Cytoscape identified core network components (Figure 5A). The highest-scoring cluster (score: 27,448) yielded seven key genes through connectivity degree analysis: IL2RB, CD8A, CD3E, IL7R, CD27, CD3D and CCR7 (Figure 5B). Parallel analysis employing four machine learning algorithms provided complementary candidate gene identification: LASSO algorithm identified three candidates (Figure 5C); XGBoost analysis yielded 30 candidates, with the top 10 designated as key genes (Figure 5D); Boruta algorithm identified 30 candidates (Figure 5E); and SVM-RFE analysis produced 16 candidate genes (Figure 5F). Integration of results across all four algorithms identified CCR7 as the sole common candidate gene (Figure 5G).
Integration of PPI network analysis and machine learning identifies CCR7 as a key immune regulator. (A) PPI network of MEgreen module genes. Node size reflects connectivity degree. (B) High-scoring cluster identified by MCODE algorithm showing core immune-related genes. Node color intensity indicates degree of connectivity. (C) LASSO regression analysis showing optimal parameter selection. (D) Top 10 genes identified by XGBoost algorithm, ranked by importance score (gain). (E) Boruta algorithm results showing confirmed (green), tentative (red), and rejected (black) features. (F) SVM-RFE performance curve showing classification accuracy across different numbers of features. (G) Venn diagram showing overlap of genes identified by four machine learning approaches, highlighting CCR7 as the common candidate.
Core T cell-associated genes correlate with immune cell distribution patterns
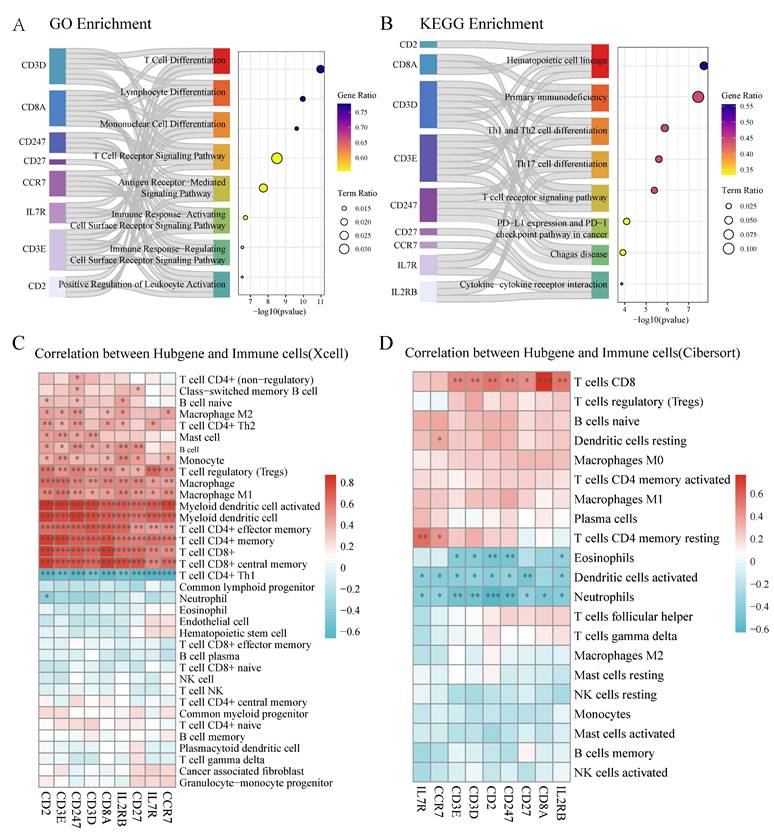
Functional analysis of the identified core genes revealed significant enrichment in T cell differentiation, lymphocyte differentiation, and T cell receptor signaling pathways (Figure 6A, Table S5). KEGG pathway analysis highlighted their involvement in hematopoietic cell lineage, primary immunodeficiency, and PD-L1/PD-1 checkpoint pathways (Figure 6B, Table S5). Correlation analysis demonstrated strong positive associations between most core genes and CD4+/CD8+ T cell populations in XCell analysis (Figure 6C), while Cibersort analysis showed positive correlations between most core genes (except CCR7 and IL7R) and CD8+ T cell distribution (Figure 6D).
Core T cell-associated genes demonstrate significant correlation with immune cell populations. (A) GO enrichment analysis of core genes showing significant pathways related to T cell function. Left bars indicate gene sets, with bar lengths representing gene ratios. Circle size indicates term ratio, and color gradient shows gene ratio. (B) KEGG pathway enrichment analysis highlighting involvement in hematopoietic and immune-related pathways. Circle size and color coding follow the same scheme as in (A). (C) Correlation heatmap between hub genes and immune cell populations based on XCell algorithm. Color intensity indicates correlation strength (red = positive, blue = negative); asterisks denote statistical significance (*P < 0.05, **P < 0.01). (D) Correlation heatmap between hub genes and immune cell populations based on Cibersort algorithm, showing distinct correlation patterns particularly with T cell subsets.
Discussion
The present study provides novel insights into the immune landscape of chordoma, a rare and challenging malignancy. Our findings reveal a complex interplay of immune checkpoints and immune cell populations within the chordoma microenvironment. Most notably, we observed elevated expression levels of key immune checkpoints, including PD-1 and CTLA-4, suggesting the potential for immunotherapeutic interventions targeting these pathways.
The upregulation of immune checkpoints in chordoma is consistent with the immune evasion strategies employed by many cancers. These checkpoints serve as "brakes" on the immune system, preventing excessive immune activation and autoimmunity under normal conditions. However, in the context of cancer, they can be co-opted to suppress anti-tumor immune responses. The high expression of PD-1 and CTLA-4 in our chordoma samples suggests that these tumors may be particularly adept at exploiting these pathways to evade immune surveillance.
Despite the elevated immune checkpoint levels, the efficacy of ICIs in chordoma treatment remains uncertain. Several factors may influence the response to ICIs, including tumor mutational burden (TMB), PD-L1 expression, and the composition of the immune microenvironment. Chordomas typically exhibit a low TMB, which has been associated with reduced responsiveness to ICIs in other cancers [77, 78]. However, recent evidence suggests that even low-TMB tumors, such as pancreatic and ovarian cancers, can respond to ICIs under certain conditions [79, 80]. Therefore, the low TMB of chordomas does not necessarily preclude the use of ICIs in their treatment.
Recent clinical trials exploring immunotherapy in chordoma have focused on ICIs like nivolumab and pembrolizumab, especially after vaccine therapies targeting brachyury were proved ineffective [81, 82]. Advances in targeting the PD-1/PD-L1 pathway have led to significant and sustained clinical improvements in several types of advanced human cancers. PD-1/PD-L1 ICIs are also the most commonly used drugs in chordoma patients [83-85].
In addition to the immune checkpoint landscape, our study also sheds light on the immune cell composition within chordoma tumors. We observed a downregulation of neutrophils and an increased presence of resting NK cells compared to normal muscle tissue. Neutrophils play a complex role in the tumor microenvironment, with both pro- and anti-tumor effects depending on the context. The downregulation of neutrophils in chordoma may reflect an immunosuppressive microenvironment that limits their recruitment and activation. Conversely, the increased presence of resting NK cells suggests a potential reservoir of cytotoxic effector cells that could be harnessed for anti-tumor immunity. However, the functional status of these NK cells and their ability to mount an effective response against chordoma cells remain to be determined.
The identification of distinct immune cell clusters within chordoma tumors further highlights the heterogeneity of the immune microenvironment. Cluster 1, characterized by elevated expression of immune-related genes and immune checkpoints, represents a highly immunogenic subtype of chordoma. This finding aligns with the concept of "hot" tumors, which are more likely to respond to immunotherapies due to their pre-existing immune infiltration and activation. The enrichment of lymphocyte-mediated immunity and immunoglobulin-mediated immune response pathways in Cluster 1 suggests a potential role for B cell-mediated anti-tumor immunity in this subtype.
The application of weighted gene co-expression network analysis (WGCNA) and machine learning approaches in our study allowed for the identification of key immune-related gene modules and hub genes associated with the immunogenic Cluster 1. The MEpurple module, enriched in B cell receptor signaling and immunoglobulin-mediated immune response, and the MEgreen module, involved in T cell differentiation and receptor signaling, provide potential targets for future investigations into the molecular mechanisms underlying the immune response in chordoma. The convergence of network analysis and machine learning on CCR7 as a central immune regulator in chordoma is particularly intriguing. CCR7 is a chemokine receptor involved in lymphocyte migration and homing to secondary lymphoid organs. Its upregulation in chordoma may reflect an active immune response and the recruitment of immune cells to the tumor site. The correlation of CCR7 and other core T cell-associated genes with CD4+ and CD8+ T cell infiltration further supports their functional relevance in the chordoma immune microenvironment.
Our study faced several limitations inherent to the study of rare cancers like chordoma. The limited availability of tissue samples necessitated the use of adjacent muscle tissue as a proxy for normal controls, which may not perfectly mirror the properties of peritumoral tissue. Additionally, the small sample size, while statistically justified, may not fully capture the heterogeneity within chordomas. Despite these limitations, our findings provide valuable insights into the immune landscape of chordoma and lay the groundwork for future investigations.
Moving forward, several avenues of research could build upon our findings. First, the functional significance of the elevated immune checkpoints and the immunogenic Cluster 1 subtype should be investigated using in vitro and in vivo models. Blocking these checkpoints with ICIs and assessing the impact on tumor growth and immune cell activation could provide direct evidence of their role in chordoma immune evasion. Second, the mechanisms underlying the recruitment and activation of macrophages and memory T cells in chordoma warrant further exploration. Understanding the factors that shape the immune cell composition within these tumors could inform strategies to modulate the microenvironment and enhance anti-tumor immunity.
Third, clinical trials evaluating the safety and efficacy of ICIs in chordoma patients are needed to translate our findings into potential therapeutic applications. While recent trials have explored ICIs like nivolumab and pembrolizumab in chordoma, the factors influencing response remain unclear. Bishop et al. noted that 88% of chordoma patients treated with ICIs experienced clinical benefits, including about a quarter who achieved partial or complete responses. However, the factors behind these improved outcomes have remained unclear - whether it's the type of ICI used, expression of tumor checkpoints, genetic characteristics of the tumor, the immune microenvironment, or other patient- and tumor-specific variables. Future trials should incorporate comprehensive immune profiling, including assessment of immune checkpoint expression, TMB, and immune cell infiltration, to identify predictors of response and guide patient selection. Additionally, combination therapies targeting multiple immune checkpoints or combining ICIs with other treatment modalities, such as radiation or targeted therapies, should be explored in chordoma. The complex immunosuppressive strategies employed by these tumors may require a multi-faceted approach to effectively overcome immune evasion and promote anti-tumor immunity.
The application of ICIs in chordoma treatment presents with a unique set of challenges. Due to the rarity of chordomas, they often are not prioritized in drug development [12]. Furthermore, the effectiveness of ICIs often varies among patients, necessitating further research to identify the factors influencing response in this context [4, 86]. Bishop et al. noted that 88% of chordoma patients treated with ICIs experienced clinical benefits, including about a quarter who achieved partial or complete responses [86]. However, the factors behind these improved outcomes have remained unclear - whether it's the type of ICI used, expression of tumor checkpoints, genetic characteristics of the tumor, the immune microenvironment, or other patient- and tumor-specific variables.
Historically, chordoma research has been centered on tumor cell mechanisms, with limited insights into the tumor's immune microenvironment. Only recently, studies have highlighted the prominence of macrophages and T cells in chordoma. Our research contributes to this evolving understanding, including by demonstrating neutrophil downregulation and increased presence of resting NK cells within chordoma tumors. In tumors, neutrophils attack and modulate the microenvironment, while resting NK cells surveil and eliminate tumor cells through cytotoxic responses. Yet, their effectiveness is likely compromised by chordoma's complex immunosuppressive strategies. However, the more specific mechanisms of immune evasion and suppression in chordomas are not well defined. Thus, exploring the molecular mechanisms of the tumor microenvironment and assessing the effectiveness of dual-target immunotherapy are critical next steps in chordoma research. This approach may offer improved outcomes over treatments focusing solely on ICIs.
Conclusion
This study reveals a complex immune microenvironment in chordoma, characterized by elevated immune checkpoint expression (e.g., PD-1, CTLA-4), a highly immunogenic subtype (Cluster 1), and a T cell-centric regulatory network with CCR7 as a key modulator. These findings highlight the potential of immune checkpoint inhibitors (ICIs) and T cell-targeted therapies as viable strategies for chordoma treatment. By identifying actionable immune signatures, this work paves the way for personalized immunotherapeutic approaches, offering hope for improved outcomes in this challenging malignancy where conventional therapies fall short. Future efforts should focus on validating these targets in clinical trials to translate these insights into effective treatments.
Supplementary Material
Supplementary figures and tables.
Acknowledgements
We thank the Center of Basic Medical Research at Peking University Third Hospital's Institute of Medical Innovation and Research for providing the necessary equipment and research space essential for part of this study. Additionally, we express our gratitude to Professor Peipei Zhang's research group at Peking University Health Science Center for their valuable support and collaboration.
Funding
This work was supported by the National Natural Science Foundation of China (82371319 to CY, 82272675 to JY), Beijing Nova Program (20230484356 to CY), Beijing Natural Science Foundation (7222217 and L246046 to CY, QY24070 to MR), Peking University Clinical Scientist Training Program supported by "The Fundamental Research Funds for the Central Universities" (BMU2024-PYJH017 to CY), Capital Health Research and Development of Special Fund (2022-4-40918 to CY), Research Project of Peking University Third Hospital in State Key Laboratory of Vascular Homeostasis and Remodeling (2024-VHR-SY-06 to CY), Digital and Humanities Project supported by "The Fundamental Research Funds for the Central Universities" (7101503232 to CY), and Peking University Third Hospital Clinical Key Project (BYSYZD2021023 to CY).
Author contributions
Study conception and design: CY. Writing- Original draft preparation: WL, MR, XC. Data collection, analysis, and visualization: WL, MR, XC, SL, YX, YD, YW. Writing- Reviewing and Editing: WL, MR, CY. Supervision: CY, JY.
Ethics statement
The study was conducted in accordance with the Declaration of Helsinki and was approved by the Peking University Third Hospital Medical Science Research Ethics Committee.
Informed consent statement
Informed Consent was obtained from all the participants involved in the study.
Data availability statement
All data generated or analyzed during this study are included in this published article and its supplementary information files.
Competing interests
The authors have declared that no competing interest exists.
References
1. Chambers KJ, Lin DT, Meier J, Remenschneider A, Herr M, Gray ST. Incidence and survival patterns of cranial chordoma in the United States. Laryngoscope. 2014;124:1097-102
2. Stiller CA, Trama A, Serraino D, Rossi S, Navarro C, Chirlaque MD. et al. Descriptive epidemiology of sarcomas in Europe: report from the RARECARE project. Eur J Cancer. 2013;49:684-95
3. Sebro R, DeLaney T, Hornicek F, Schwab J, Choy E, Nielsen GP. et al. Differences in sex distribution, anatomic location and MR imaging appearance of pediatric compared to adult chordomas. BMC Med Imaging. 2016;16:53
4. Shinojima N, Ozono K, Yamamoto H, Abe S, Sasaki R, Tomita Y. et al. Lynch syndrome-associated chordoma with high tumor mutational burden and significant response to immune checkpoint inhibitors. Brain Tumor Pathol. 2023;40:185-90
5. Aguiar Júnior S, Andrade WP, Baiocchi G, Guimarães GC, Cunha IW, Estrada DA. et al. Natural history and surgical treatment of chordoma: a retrospective cohort study. Sao Paulo Med J. 2014;132:297-302
6. Frezza AM, Botta L, Trama A, Dei Tos AP, Stacchiotti S. Chordoma: update on disease, epidemiology, biology and medical therapies. Curr Opin Oncol. 2019;31:114-20
7. Stacchiotti S, Gronchi A, Fossati P, Akiyama T, Alapetite C, Baumann M. et al. Best practices for the management of local-regional recurrent chordoma: a position paper by the Chordoma Global Consensus Group. Ann Oncol. 2017;28:1230-42
8. Karpathiou G, Dumollard JM, Dridi M, Dal Col P, Barral FG, Boutonnat J. et al. Chordomas: A review with emphasis on their pathophysiology, pathology, molecular biology, and genetics. Pathol Res Pract. 2020;216:153089
9. Jones PS, Aghi MK, Muzikansky A, Shih HA, Barker FG 2nd, Curry WT Jr. Outcomes and patterns of care in adult skull base chordomas from the Surveillance, Epidemiology, and End Results (SEER) database. J Clin Neurosci. 2014;21:1490-6
10. Bohman LE, Koch M, Bailey RL, Alonso-Basanta M, Lee JY. Skull base chordoma and chondrosarcoma: influence of clinical and demographic factors on prognosis: a SEER analysis. World Neurosurg. 2014;82:806-14
11. Pan Y, Lu L, Chen J, Zhong Y, Dai Z. Analysis of prognostic factors for survival in patients with primary spinal chordoma using the SEER Registry from 1973 to 2014. J Orthop Surg Res. 2018;13:76
12. Morawietz L. CORR Insights®: Defective HLA Class I Expression and Patterns of Lymphocyte Infiltration in Chordoma Tumors. Clin Orthop Relat Res. 2021;479:1383-5
13. Edén D, Ieong KIA, Cook NL, Raykova D, Wicher AZ. Abstract 6372: In situ detection of various activated immune checkpoints via next-generation proximity ligation assays in tumor tissue. Cancer Research. 2023
14. Lim S-Y, Koh J, Song SG, Yim J, Han B, Kim YA. et al. Abstract 6656: Expression pattern and clinicopathological implication of B7 family immune checkpoints, VTCN1 and HHLA2, in non-small cell lung cancer. Cancer Research. 2023
15. Stacchiotti S, Morosi C, Lo Vullo S, Casale A, Palassini E, Frezza AM. et al. Imatinib and everolimus in patients with progressing advanced chordoma: A phase 2 clinical study. Cancer. 2018;124:4056-63
16. Schuetze SM, Bolejack V, Choy E, Ganjoo KN, Staddon AP, Chow WA. et al. Phase 2 study of dasatinib in patients with alveolar soft part sarcoma, chondrosarcoma, chordoma, epithelioid sarcoma, or solitary fibrous tumor. Cancer. 2017;123:90-7
17. Yang X, Li P, Kang Z, Li W. Targeted therapy, immunotherapy, and chemotherapy for chordoma. Current Medicine. 2023 2
18. Li Y, Li F, Jiang F, Lv X, Zhang R, Lu A. et al. A Mini-Review for Cancer Immunotherapy: Molecular Understanding of PD-1/PD-L1 Pathway & Translational Blockade of Immune Checkpoints. Int J Mol Sci. 2016;17:1151
19. Mejía-Guarnizo LV, Monroy-Camacho PS, Turizo-Smith AD, Rodríguez-García JA. The role of immune checkpoints in antitumor response: a potential antitumor immunotherapy. Front Immunol. 2023;14:1298571
20. Sudan K, Michels T, Amerhauser C, Tschulik C, Majunke L, Albert L. et al. Abstract 3471: A function-based high-throughput discovery platform, myeloid iOTarg, identifies novel immune checkpoints of the tumor microenvironment. Cancer Research. 2023
21. Duan W, Zhang B, Li X, Chen W, Jia S, Xin Z. et al. Single-cell transcriptome profiling reveals intra-tumoral heterogeneity in human chordomas. Cancer Immunol Immunother. 2022;71:2185-95
22. Zou MX, Peng AB, Lv GH, Wang XB, Li J, She XL. et al. Expression of programmed death-1 ligand (PD-L1) in tumor-infiltrating lymphocytes is associated with favorable spinal chordoma prognosis. Am J Transl Res. 2016;8:3274-87
23. Feng Y, Shen J, Gao Y, Liao Y, Cote G, Choy E. et al. Expression of programmed cell death ligand 1 (PD-L1) and prevalence of tumor-infiltrating lymphocytes (TILs) in chordoma. Oncotarget. 2015;6:11139-49
24. Zou MX, Guo KM, Lv GH, Huang W, Li J, Wang XB. et al. Clinicopathologic implications of CD8(+)/Foxp3(+) ratio and miR-574-3p/PD-L1 axis in spinal chordoma patients. Cancer Immunol Immunother. 2018;67:209-24
25. Li X, Li M, Lian Z, Zhu H, Kong L, Wang P. et al. Prognostic Role of Programmed Death Ligand-1 Expression in Breast Cancer: A Systematic Review and Meta-Analysis. Target Oncol. 2016;11:753-61
26. Hill BL, Graf RP, Shah K, Danziger N, Lin DI, Quintanilha J. et al. Mismatch repair deficiency, next-generation sequencing-based microsatellite instability, and tumor mutational burden as predictive biomarkers for immune checkpoint inhibitor effectiveness in frontline treatment of advanced stage endometrial cancer. Int J Gynecol Cancer. 2023;33:504-13
27. Conforti F, Pala L, Bagnardi V, De Pas T, Martinetti M, Viale G. et al. Cancer immunotherapy efficacy and patients' sex: a systematic review and meta-analysis. Lancet Oncol. 2018;19:737-46
28. Zheng SY, Cui HJ, Duan H, Peng YM, Li Q, Sun CY. et al. The efficacy and safety of immune checkpoint inhibitors in non-small cell lung cancer patients of different age groups: a meta-analysis. Clin Transl Oncol. 2020;22:1146-54
29. Hsu JC, Lin JY, Hsu MY, Lin PC. Effectiveness and safety of immune checkpoint inhibitors: A retrospective study in Taiwan. PLoS One. 2018;13:e0202725
30. Zeng T, Fang X, Lu J, Zhong Y, Lin X, Lin Z. et al. Efficacy and safety of immune checkpoint inhibitors in colorectal cancer: a systematic review and meta-analysis. Int J Colorectal Dis. 2022;37:251-8
31. Halvorsen SC, Benita Y, Hopton M, Hoppe B, Gunnlaugsson HO, Korgaonkar P. et al. Transcriptional Profiling Supports the Notochordal Origin of Chordoma and Its Dependence on a TGFB1-TBXT Network. The American Journal of Pathology. 2023;193:532-47
32. Long C, Jiang L, Wei F, Ma C, Zhou H, Yang S. et al. Integrated miRNA-mRNA Analysis Revealing the Potential Roles of miRNAs in Chordomas. PLoS ONE. 2013;8:e66676
33. van Oost S, Meijer DM, Ijsselsteijn ME, Roelands JP, van den Akker BEMW, van der Breggen R. et al. Multimodal profiling of chordoma immunity reveals distinct immune contextures. J Immunother Cancer. 2024;12:e008138
34. Gautier L, Cope L, Bolstad BM, Irizarry RA. affy—analysis of <i>Affymetrix GeneChip</i> data at the probe level. Bioinformatics. 2004;20:307-15
35. Carlson M. hgu133plus2.db: Affymetrix Affymetrix HG-U133_Plus_2 Array annotation data (chip hgu133plus2). 2021
36. Vu VQ. ggbiplot: A ggplot2 based biplot. 2011.
37. Ritchie ME, Phipson B, Wu D, Hu Y, Law CW, Shi W. et al. limma powers differential expression analyses for RNA-sequencing and microarray studies. Nucleic Acids Res. 2015;43:e47-e
38. Durinck S, Moreau Y, Kasprzyk A, Davis S, De Moor B, Brazma A. et al. BioMart and Bioconductor: a powerful link between biological databases and microarray data analysis. Bioinformatics. 2005;21:3439-40
39. Durinck S, Spellman PT, Birney E, Huber W. Mapping identifiers for the integration of genomic datasets with the R/Bioconductor package biomaRt. Nat Protoc. 2009;4:1184-91
40. Leek JT, Johnson WE, Parker HS, Fertig EJ, Jaffe AE, Zhang Y. et al. sva: Surrogate Variable Analysis. 2024.
41. Andrews S. (2010). FastQC: a quality control tool for high throughput sequence data. Available online at: http://www.bioinformatics.babraham.ac.uk/projects/fastqc.
42. Simon Andrews LB, Sarah Inglesfield, Hayley Carr, Jo Montgomery. Trim Galore!. https://github.com/FelixKrueger/TrimGalore.
43. Liao Y, Smyth GK, Shi W. featureCounts: an efficient general purpose program for assigning sequence reads to genomic features. Bioinformatics. 2014;30:923-30
44. Kim D, Paggi JM, Park C, Bennett C, Salzberg SL. Graph-based genome alignment and genotyping with HISAT2 and HISAT-genotype. Nat Biotechnol. 2019;37:907-15
45. Blighe K, Rana S, Lewis M. EnhancedVolcano: Publication-ready volcano plots with enhanced colouring and labeling. 2024.
46. Wu T, Hu E, Xu S, Chen M, Guo P, Dai Z. et al. clusterProfiler 4.0: A universal enrichment tool for interpreting omics data. Innovation (Camb). 2021;2:100141
47. Yu G, Wang L-G, Han Y, He Q-Y. clusterProfiler: an R Package for Comparing Biological Themes Among Gene Clusters. OMICS: A Journal of Integrative Biology. 2012;16:284-7
48. Kerseviciute I, Gordevicius J. <i>aPEAR</i>: an R package for autonomous visualization of pathway enrichment networks. Bioinformatics. 2023;39:btad672
49. Zhang J. GseaVis: Implement for 'GSEA' Enrichment Visualization. 2024.
50. Yoshihara K, Kim H, Verhaak RGW. estimate: Estimate of Stromal and Immune Cells in Malignant Tumor Tissues from Expression Data. 2016.
51. Merotto L, Sturm G. immunedeconv: Methods for immune cell deconvolution
52. Newman AM, Liu CL, Green MR, Gentles AJ, Feng W, Xu Y. et al. Robust enumeration of cell subsets from tissue expression profiles. Nat Methods. 2015;12:453-7
53. Aran D, Hu Z, Butte AJ. xCell: digitally portraying the tissue cellular heterogeneity landscape. Genome Biol. 2017;18:220
54. Finotello F, Mayer C, Plattner C, Laschober G, Rieder D, Hackl H. et al. Molecular and pharmacological modulators of the tumor immune contexture revealed by deconvolution of RNA-seq data. Genome Med. 2019;11:34
55. Monaco G, Lee B, Xu W, Mustafah S, Hwang YY, Carré C. et al. RNA-Seq Signatures Normalized by mRNA Abundance Allow Absolute Deconvolution of Human Immune Cell Types. Cell Reports. 2019;26:1627-40.e7
56. Racle J, de Jonge K, Baumgaertner P, Speiser DE, Gfeller D. Simultaneous enumeration of cancer and immune cell types from bulk tumor gene expression data. eLife. 2017;6:e26476
57. Becht E, Giraldo NA, Lacroix L, Buttard B, Elarouci N, Petitprez F. et al. Estimating the population abundance of tissue-infiltrating immune and stromal cell populations using gene expression. Genome Biol. 2016;17:218
58. Hänzelmann S, Castelo R, Guinney J. GSVA: gene set variation analysis for microarray and RNA-seq data. BMC Bioinformatics. 2013;14:7
59. Zeng D, Ye Z, Shen R, Yu G, Wu J, Xiong Y. et al. IOBR: Multi-Omics Immuno-Oncology Biological Research to Decode Tumor Microenvironment and Signatures. Front Immunol. 2021;12:687975
60. Wickham H. ggplot2: Elegant Graphics for Data Analysis: Springer-Verlag New York. 2016.
61. Kassambara A. ggpubr: 'ggplot2' Based Publication Ready Plots. 2023.
62. Langfelder P, Horvath S. WGCNA: an R package for weighted correlation network analysis. BMC Bioinformatics. 2008;9:1-13
63. Wilkerson MD, Hayes DN. ConsensusClusterPlus: a class discovery tool with confidence assessments and item tracking. Bioinformatics. 2010;26:1572-3
64. Krijthe JH. Rtsne: T-Distributed Stochastic Neighbor Embedding using Barnes-Hut Implementation. 2015.
65. Maaten Lvd. Accelerating t-SNE using Tree-Based Algorithms. Journal of Machine Learning Research. 2014;15:3221-45
66. Szklarczyk D, Kirsch R, Koutrouli M, Nastou K, Mehryary F, Hachilif R. et al. The STRING database in 2023: protein-protein association networks and functional enrichment analyses for any sequenced genome of interest. Nucleic Acids Res. 2023;51:D638-D46
67. Shannon P, Markiel A, Ozier O, Baliga NS, Wang JT, Ramage D. et al. Cytoscape: A Software Environment for Integrated Models of Biomolecular Interaction Networks. Genome Res. 2003;13:2498-504
68. Bader GD, Hogue CWV. An automated method for finding molecular complexes in large protein interaction networks. BMC Bioinformatics. 2003;4:2
69. Friedman J, Hastie T, Tibshirani R. Regularization Paths for Generalized Linear Models via Coordinate Descent. Journal of Statistical Software. 2010;33:1-22
70. Kuhn M. Building Predictive Models in<i>R</i>Using the<b>caret</b>Package. Journal of Statistical Software. 2008;28:1-26
71. Kursa MB, Rudnicki WR. Feature Selection with the<b>Boruta</b>Package. Journal of Statistical Software. 2010;36:1-13
72. Chen T, He T, Benesty M, Khotilovich V, Tang Y, Cho H. et al. xgboost: Extreme Gradient Boosting. 2024.
73. Rody A, Holtrich U, Pusztai L, Liedtke C, Gaetje R, Ruckhaeberle E. et al. T-cell metagene predicts a favorable prognosis in estrogen receptor-negative and HER2-positive breast cancers. Breast Cancer Res. 2009;11:R15
74. Hu F-F, Liu C-J, Liu L-L, Zhang Q, Guo A-Y. Expression profile of immune checkpoint genes and their roles in predicting immunotherapy response. Briefings in Bioinformatics. 2021;22:bbaa176
75. Charoentong P, Finotello F, Angelova M, Mayer C, Efremova M, Rieder D. et al. Pan-cancer Immunogenomic Analyses Reveal Genotype-Immunophenotype Relationships and Predictors of Response to Checkpoint Blockade. Cell Reports. 2017;18:248-62
76. van der Leun AM, Thommen DS, Schumacher TN. CD8+ T cell states in human cancer: insights from single-cell analysis. Nat Rev Cancer. 2020;20:218-32
77. Marabelle A, Fakih M, Lopez J, Shah M, Shapira-Frommer R, Nakagawa K. et al. Association of tumour mutational burden with outcomes in patients with advanced solid tumours treated with pembrolizumab: prospective biomarker analysis of the multicohort, open-label, phase 2 KEYNOTE-158 study. Lancet Oncol. 2020;21:1353-65
78. Valero C, Lee M, Hoen D, Zehir A, Berger MF, Seshan VE. et al. Response Rates to Anti-PD-1 Immunotherapy in Microsatellite-Stable Solid Tumors With 10 or More Mutations per Megabase. JAMA Oncol. 2021;7:739-43
79. Sia TY, Manning-Geist B, Gordhandas S, Murali R, Marra A, Liu YL. et al. Treatment of ovarian clear cell carcinoma with immune checkpoint blockade: a case series. Int J Gynecol Cancer. 2022;32:1017-24
80. Collienne M, Loghmani H, Heineman TC, Arnold D. GOBLET: a phase I/II study of pelareorep and atezolizumab +/- chemo in advanced or metastatic gastrointestinal cancers. Future Oncol. 2022;18:2871-8
81. DeMaria PJ, Bilusic M, Park DM, Heery CR, Donahue RN, Madan RA. et al. Randomized, Double-Blind, Placebo-Controlled Phase II Study of Yeast-Brachyury Vaccine (GI-6301) in Combination with Standard-of-Care Radiotherapy in Locally Advanced, Unresectable Chordoma. Oncologist. 2021;26:e847-e58
82. Traylor JI, Pernik MN, Plitt AR, Lim M, Garzon-Muvdi T. Immunotherapy for Chordoma and Chondrosarcoma: Current Evidence. Cancers (Basel). 2021;13:2408
83. Topalian SL, Hodi FS, Brahmer JR, Gettinger SN, Smith DC, McDermott DF. et al. Safety, activity, and immune correlates of anti-PD-1 antibody in cancer. N Engl J Med. 2012;366:2443-54
84. Brahmer JR, Tykodi SS, Chow LQ, Hwu WJ, Topalian SL, Hwu P. et al. Safety and activity of anti-PD-L1 antibody in patients with advanced cancer. N Engl J Med. 2012;366:2455-65
85. Wang X, Chen Z, Li B, Fan J, Xu W, Xiao J. Immunotherapy as a Promising Option for the Treatment of Advanced Chordoma: A Systemic Review. Cancers (Basel). 2022;15:264
86. Bishop AJ, Amini B, Lin H, Raza SM, Patel S, Grosshans DR. et al. Immune Checkpoint Inhibitors Have Clinical Activity in Patients With Recurrent Chordoma. J Immunother. 2022;45:374-8
Author contact
![]() Corresponding authors: Prof. Chenlong Yang, Address: State Key Laboratory of Vascular Homeostasis and Remodeling, Department of Neurosurgery, Peking University Third Hospital, Peking University, Beijing 100191, P.R. China; Email: vik.yangedu.cn or vik.yangedu.cn. Prof. Jun Yang, Address: No. 49, Garden North Road, Haidian District, Beijing 100191, P.R. China; Email: yangjbysyedu.cn.
Corresponding authors: Prof. Chenlong Yang, Address: State Key Laboratory of Vascular Homeostasis and Remodeling, Department of Neurosurgery, Peking University Third Hospital, Peking University, Beijing 100191, P.R. China; Email: vik.yangedu.cn or vik.yangedu.cn. Prof. Jun Yang, Address: No. 49, Garden North Road, Haidian District, Beijing 100191, P.R. China; Email: yangjbysyedu.cn.