Impact Factor ISSN: 1449-1907
- Issue 9; 2026
- Issue 8; 2026
- Issue 7; 2026
- Issue 6; 2026
- Issue 5; 2026
- Volume 23; 2026
- Past Issues
- Editorial Board
- Cover Images
- Index & Coverage
- Cover Suggestion
- Special Issues
Introduction
Materials and Methods
Results
Discussion
Conclusion
Supplementary Material
Acknowledgements
References

 Global reach, higher impact
Int J Med Sci 2025; 22(4):940-954. doi:10.7150/ijms.103444 This issue Cite
Research Paper
NCAPH Promotes the Proliferation of Prostate Cancer Cells Via Modulating the E2F1 Mediated PI3K/AKT/mTOR Axis
Qing Shi1#, Jinpeng Ma1#, Xiang Pan1, Te Liu2, Kailai Chen1, Meiqi Xu1, Zhichong Wu3, Bin Sun2, Manjie Zhang2 ![]() , Yakun Luo1,4
, Yakun Luo1,4 ![]()
1. NHC Key Laboratory of Molecular Probes and Targeted Diagnosis and Therapy, Harbin Medical University, Harbin 150001, China.
2. Research Center for Pharmacoinformatics, College of Pharmacy, Harbin Medical University, Harbin 150081, China.
3. Department of General Surgery, Ruijin Hospital, Shanghai Jiao Tong University School of Medicine, Shanghai 200025, China.
4. Department of Urology, The Fourth Affiliated Hospital of Harbin Medical University, Harbin 150001, China.
# These authors contributed equally to this work.
Received 2024-9-9; Accepted 2025-1-9; Published 2025-1-27
Abstract

Prostate cancer (PCa) remains a major challenge in oncology, driving the need for continuous exploration and development of innovative treatment strategies. NCAPH plays a critical role in tumorigenesis and progression across multiple cancer types; however, its specific role in PCa has yet to be fully understood. This study aims to elucidate the biological functions of NCAPH in PCa. Our findings reveal that NCAPH gene expression is upregulated in PCa patients and correlates with poor prognosis. Enrichment analysis, flow cytometry, and correlation analysis demonstrate that NCAPH promotes the PI3K/AKT/mTOR pathway and facilitates cell cycle transition in PCa cells. Additionally, we identified E2F1 as a novel downstream target of NCAPH in PCa cells. Mechanistically, ChIP analysis showed that NCAPH regulates E2F1 transcription by binding to the proximal promoter of E2F1, subsequently stimulating the PI3K/AKT/mTOR pathway and activating downstream targets for cell cycle progression in PCa cells. Notably, combining NCAPH knockdown with an mTOR inhibitor (Everolimus) or a cyclin-dependent kinase inhibitor (Flavopiridol) demonstrated promising anti-tumor effects both in vitro and in vivo. This study highlights the significant pro-tumor role of NCAPH in PCa and suggests its potential as a therapeutic target.
Keywords: prostate cancer, NCAPH, E2F1, PI3K/AKT/mTOR, therapeutic strategy
Introduction
Prostate cancer (PCa) is a major health problem affecting men worldwide. It is the second most common cancer in men and the fifth leading cause of cancer-related death worldwide [1,2]. Despite advances in diagnostic techniques and treatment modalities, the molecular processes driving PCa progression remain poorly understood. It is imperative to identify key genes and pathways associated with PCa cell proliferation to pave the way for targeted therapeutic intervention and improved patient outcomes [3,4].
The NCAPH gene, also known as non-SMC condensin I complex subunit H, encodes the NCAPH protein, which plays a key role in chromosome condensation and organization during cell division [5,6]. It is a component of the condensin I complex and is essential for ensuring proper chromosome segregation during mitosis and meiosis [7]. Aberrant expression of the NCAPH gene has been found in multiple cancer types, including breast [8], lung [9], and bladder cancer [10]. Notably, in cervical cancer, upregulated NCAPH binds to human papillomavirus E7 (HPV E7) and enhances cell proliferation by activating the PI3K/AKT/SGK pathway [11].
In colon cancer, NCAPH depletion inhibits tumor growth and migration and induces apoptosis and cell cycle arrest [12]. Additionally, NCAPH plays a role in gastric cancer progression by regulating the DNA damage response [13]. In prostate cancer, Arai et al. reported that NCAPH upregulation is associated with increased invasion and migration of PCa cells [14]. However, the specific mechanism through which NCAPH influences PCa cell malignancy remains unclear.
Our study demonstrates that high NCAPH expression is positively correlated with poor prognosis in PCa patients. We show that NCAPH promotes cell cycle progression in PCa cells by activating the E2F1-mediated PI3K/AKT/mTOR pathway in vitro. Furthermore, NCAPH gene silencing (NCAPH-KD) significantly inhibits tumor growth in a xenograft nude mouse model of PCa in vivo. Combining NCAPH-KD with an mTOR inhibitor (Everolimus, Eve) or a cyclin-dependent kinase inhibitor (Flavopiridol, Flav) shows a promising anti-tumor effect in PCa cells both in vitro and in vivo. These findings suggest that NCAPH plays a pro-tumor role in PCa and could serve as a potential therapeutic target.
Materials and Methods
Patients and specimens
Tissue specimens were procured from patients undergoing surgical procedures at the Department of Urology, Fourth Hospital of Harbin Medical University, spanning the period from January 2022 to January 2023, were diagnosed with prostate cancer. Ethical clearance for all investigations involving human specimens was obtained from the Ethics Committee of Fourth Affiliated Hospital of Harbin Medical University (2021-WZYSLLSC-31). The study was conducted in accordance with the guidelines in the Declaration of Helsinki.
Cell culture
The utilized cell lines encompassed human normal prostate cells (RWPE-1) along with three distinct prostate cancer cell lines (LNCaP, PC3, and DU145), all procured from ATCC. LNCaP and PC3 cell lines were propagated in RPMI 1640 medium (A1049101, Gibco, USA), while the DU145 cell line was maintained in DMEM medium (21013024, Gibco, USA). The RWPE-1 cell line was cultured in K-SFM medium (17005042, Invitrogen, USA). Each medium variant was supplemented with 10% heat-inactivated fetal bovine serum (16140071, Gibco, USA) and 1% penicillin-streptomycin (C0222, Beyotime, China). The cell lines were maintained in an incubator with a humidified atmosphere of 5% CO2 at 37 °C. Additionally, PCR testing validated the absence of mycoplasma contamination in all cell lines.
RNA interfering and transfection
The siRNAs utilized comprised of siNCAPH#1 (siG000029781A-1-5), siNCAPH#2 (siG000029781B-1-5), siE2F1#1 (siG14101792341-1-5), siE2F1#2 (siG14101792354-1-5), and the negative control siRNA (siCtrl, siN00000001), all sourced from Ribo Biotechnology Company (Guangzhou, China). Transient transfection of the cells was facilitated using Lipofectamine 2000 (11668019, Invitrogen, USA). Subsequently, protein and RNA were extracted to validate the efficacy of the knockout.
RNA extraction, cDNA synthesis, and real-time PCR analysis
Total RNA from both tissues and cells was extracted using the Trizol reagent, with subsequent quantification accomplished via the NanoDrop 2000 spectrophotometer. Reverse transcription of RNA utilized the Reverse Ace qPCR RT Master Mix kit, specifically designed for messenger RNA (mRNA). Real-time quantitative PCR (RT-qPCR) assays were conducted on the StepOne Plus Real-time PCR system employing the TaqMan Gene Expression Assay kit. Gene expression levels were evaluated utilizing the 2-ΔΔCT method, with β-actin employed as the internal reference gene. Each RT-qPCR experiment set was performed in triplicate and independently replicated three times. The primers utilized are detailed in Supplementary Table S1.
Transwell assay
The cell migration assay was conducted by seeding cells onto the upper surface of a transwell chamber. Following a 24-hour incubation period, the invaded cells were fixed using 4% paraformaldehyde and subsequently stained with 0.5% crystal violet. The invasive cell populations were photographed by microscope and counted by ImageJ.
Cell proliferation assay
CCK-8 analysis (Cell Counting Kit-8, HY-K0301, MCE) was employed to assess cell proliferation. Cells were seeded into wells of a 96-well plate at a density of 3,000 cells per well. Following inoculation, cells were subjected to continuous incubation for 0, 24, 48, 72, and 96 hours post-treatment. Subsequently, CCK-8 reagent was introduced into each well, followed by a 2 hours incubation period at 37 °C, after which absorbance measurements were taken to determine cell viability.
Cell colony formation assay
In colony formation assay, cells were plated in 6-well culture plates at a density of 5×10² cells per well for prostate cancer cells and cultured for 2 weeks. After the incubation period, colonies were stained with 0.5% crystal violet. Plate images were subsequently analyzed utilizing ImageJ software. Each experiment was conducted independently in triplicate, and statistical analyses were conducted using Prism software.
Protein extraction and western blotting
Cell lysates were obtained by incubating cells for 30 minutes on ice with RIPA lysis buffer. Subsequently, the cell lysates were centrifuged at 12,000 g for 15 minutes at 4 °C. Protein concentration in the lysates was determined using the BCA Protein Assay kit. The proteins were then separated by SDS-PAGE and transferred to PVDF membranes. The membranes were blocked with 5% BSA in PBS and incubated with primary antibodies overnight at 4 °C. The next day, the membranes were incubated with the corresponding secondary antibody for 2 hours at 25 °C. Protein bands were visualized using chemiluminescence substrates. Details of the antibodies used are provided in Supplementary Table S2.
Flow cytometric assay
Cell cycle and apoptosis analysis were performed by flow cytometry. For cell cycle analysis, cells were immobilized with 70% ethanol at 4°C for 2 hours and then incubated with propyl iodide (PI) and RNase A (C1052, Beyotime) for 30 minutes. For apoptosis analysis, cells were incubated with Annexin V-FITC and PI (C1062, Beyotime) at room temperature for 30 minutes. Subsequently, cell cycle and apoptotic rates were measured using flow cytometry (EPICS, Xl-4; Beckman Coulter, Inc., Brea, CA, USA).
Co-immunoprecipitation (Co-IP) Assay
The Co-IP assay was performed according to the manufacturer's protocol as previously described. Briefly, cellular lysis was conducted, and protein extraction was carried out using Cell Lysis Buffer for Immunoprecipitation (#9803, Cell Signaling Technology). Anti-NCAPH (11515-1-AP, Proteintech) or anti-E2F1 (66515-1-Ig, Proteintech) antibodies were utilized for the pull-down assay, which was conducted overnight at 4°C with gentle agitation at 30 rpm. Following this, Protein A + G Agarose (20423, Thermo Scientific) was added and gently mixed at 4 °C for 2 hours at 20 rpm. The resultant precipitate was then centrifuged, washed, and combined with SDS-PAGE sample loading buffer (#3401, Merck). Denaturation was achieved by heating at 100°C for 15 minutes. Rabbit-purified IgG was employed as the negative control.
Chromatin immunoprecipitation assay
The Chromatin Immunoprecipitation (ChIP) assay was conducted following the previous manufacturer protocol [15]. Initially, a total of 2×10⁷ cells were processed using the ChIP assay kit (17-295, Millipore, Massachusetts, USA) in accordance with the manufacturer's instructions. The cross-linked chromatin underwent sonication to generate fragments ranging from 200 to 500 base pairs in length. Subsequently, the chromatin was subjected to immunoprecipitation using antibodies specific to NCAPH (11515-1-AP, Proteintech), E2F1 (66515-1-Ig, Proteintech), CDK1 (19532-1-AP, Proteintech) or CyclinB1 (55004-1-AP, Proteintech). The resulting DNA fragments were purified using the QIAquick PCR purification kit (28104, Qiagen, Hilden, Germany) and employed for RT-qPCR reactions with iTaq Universal SYBR Green (1725124, Bio-Rad). Each ChIP assay was independently repeated at least three times. Details regarding the primers used for ChIP-qPCR can be found in Supplementary Table S1.
Immunohistochemistry (IHC) assay
Paraffin-embedded human PCa tumor tissues and adjacent tissues and xenograft tumor tissues from nude mice were processed for the protein analysis. Specifically, the tissue slices were cut to a thickness of 4 μm, spread at 42 °C water temperature, and subsequently baked in a 60 °C oven for 30 minutes. Following dewaxing in xylene solution, the sections were rehydrated using different alcohol concentrations (100%, 90%, 80%, 75%). Subsequently, they were blocked with 1% BSA and incubated overnight with primary antibody at 4 °C. The secondary antibody was applied at room temperature for 2 hours. The signals were detected with DAB (DA1010, Solarbio). Finally, nuclear staining was performed, followed by dehydration and sealing with a neutral adhesive, enabling observation of tissue staining under a microscope.
Hematoxylin-eosin (HE) staining assay
HE staining assays were conducted utilizing the HE staining kit (G1120, Solarbio, China), following the supplier's guidelines. Briefly, after the samples underwent deparaffinization and hydration, they were subjected to hematoxylin staining for 2 minutes, followed by rinsing with PBS. Subsequently, eosin staining was performed for 1 minute, followed by PBS washing for 5 minutes. Finally, the samples were dehydrated, permeated, sealed with neutral resin, dried, and photographed under a microscope.
Molecular docking
The AlphaFold-predicted protein structures of NCAPH and E2F1 were obtained from the UniProt database, with access codes O00255 and Q08050, respectively. These structures underwent 50 ns production molecular dynamics (MD) simulations using the Amber 20 package to refine their structures. The Amber ff19SB force field was employed for the MD simulations. The final frame of the MD trajectory refinement was extracted to serve as input structures for protein-protein docking. Free protein-protein docking was carried out using the online ZDOCK server without specifying any contacting constraints. The top ten highest-ranked docking poses were selected for further analyses. Structure renderings were generated using the ChimeraX software.
Xenograft tumor model
Athymic nude BALB/c male mice aged 6 weeks were procured from Beijing Vital River Laboratory Animal Technology Co., China. The mice were randomly assigned to 7 groups, each containing 5 mice. LNCaP cells (1×10⁷ cells/mice) were suspended in a 200 μL mixture of 50% PBS and 50% Matrigel (BD Biosciences) and injected subcutaneously into the right lower limb back of the mice to establish a xenograft model. After 15 days of acclimatization, when the subcutaneous tumors reached a size of 50 mm3, various treatment methods were initiated. Tumor size was monitored using vernier calipers every week following the initial injection of siCtrl, siNCAPH, DMSO, Everolimus (20 nM/mice), or Flavopiridol (100 nM/mice) as indicated. Tumor volumes were determined using the following formula: (length × width2)/2. After 42 days, the nude mice were euthanized, and the subcutaneous tumors were excised, photographed, weighed, and immediately fixed in 4% paraformaldehyde for further analysis. All animal studies were conducted in accordance with the National Institute of Health guidelines for the Care and Use of Laboratory Animals and approved by the Ethics Committee of Harbin Medical University.
Data mining analysis
Gene expression data (measured in transcripts per million, TPM) and relevant prostate cancer prognostic and clinical data were sourced from The Cancer Genome Atlas (TCGA) databases (https://portal.gdc.cancer.gov/). GSVA enrichment analysis was conducted using the "GSVA" R package (23323831). The identification of differentially expressed genes (DEGs) was performed using the “limma” package (25605792). DEGs were selected based on an adjusted p-value less than 0.05 and an absolute value of log2 Fold Change greater than or equal to 0.1. Pearson correlation analysis was employed for assessing correlations.
Statistical analyses
All statistical analyses were conducted using GraphPad Prism 8.0 (GraphPad Software Inc., San Diego, CA, USA), and data were presented as mean ± standard deviation (SD). Differences between two groups were assessed using Student's t-test, while comparisons among three or more groups were initially evaluated using one-way analysis of variance (ANOVA). Cut-off values for survival analysis were determined using the Maxstat (R package). Results with a p-value of 0.05 or less were deemed statistically significant.
Results
NCAPH plays an oncogenic role in PCa
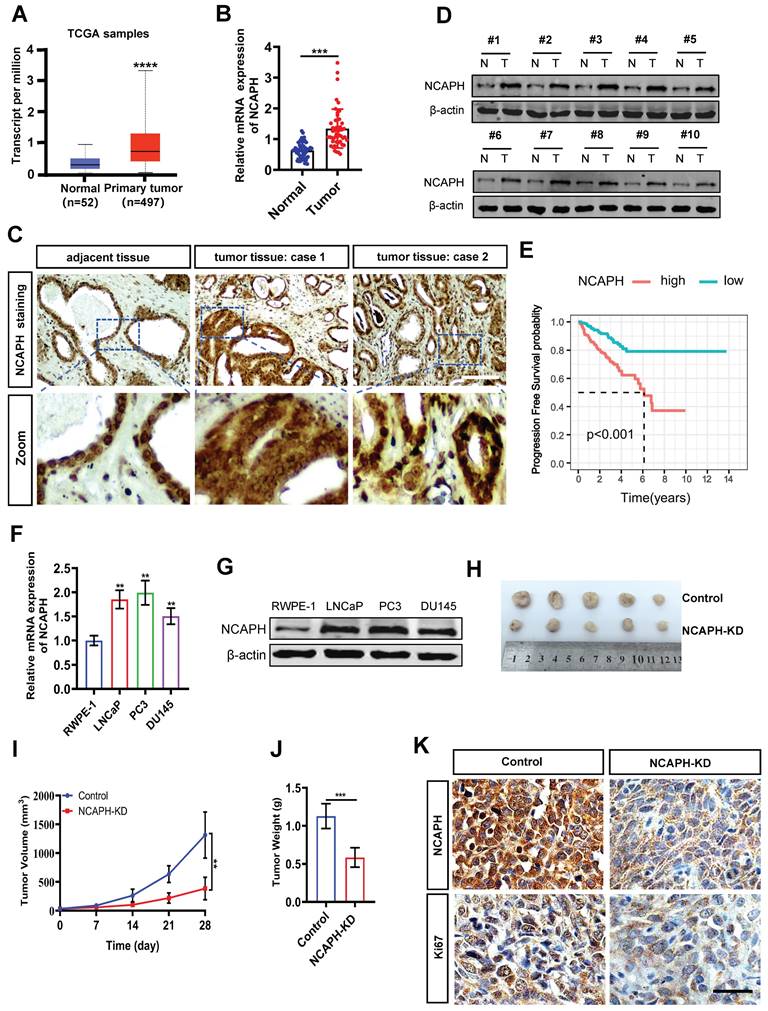
To determine the role of the NCAPH gene in PCa, we first analyzed NCAPH mRNA levels in human PCa tissues using data from The Cancer Genome Atlas (TCGA). As shown in Figure 1A, NCAPH was significantly upregulated in PCa tissues (n=497) compared to normal tissues (n=52). We further examined NCAPH expression in 24 pairs of clinical prostate cancer tissues (tumor tissues, n=24; adjacent tissues, n=24) using real-time quantitative PCR (RT-qPCR) and immunohistochemistry (IHC). Compared to adjacent tissues (n=24), NCAPH mRNA was significantly elevated in PCa tissues (Figure 1B). The IHC results also showed upregulated NCAPH expression in clinical PCa tissues, with representative IHC images displayed in Figure 1C. To confirm these findings, we assessed NCAPH expression in 10 pairs of PCa tissues using western blot analysis. Consistent with the IHC results, NCAPH levels were higher in prostate tumor tissues than in adjacent tissues (Figure 1D). Importantly, we found that the overall survival (OS) rate of patients with high NCAPH expression was significantly lower than that of patients with low NCAPH expression, based on TCGA data (Figure 1E). We then investigated the function of NCAPH in PCa cells and found a notable upregulation of NCAPH at both mRNA and protein levels in the PCa cell lines LNCaP, PC3 and DU145 compared to normal human prostate epithelial cells (RWPE-1) (Figure 1F and G). Moreover, In vivo studies using the LNCaP-xenografted nude mouse model showed that NCAPH knockdown (NCAPH-KD) via RNA interference significantly reduced the size of xenograft tumors (Figure 1H-J). We also observed a substantial decrease in NCAPH and Ki67 expression in NCAPH-KD xenograft tumor tissues (Figure 1K). These findings suggest that NCAPH acts as an oncogenic factor in PCa cells both in vitro and in vivo.
The expression of NCAPH is considered to be upregulated in prostate cancer tissues and prostate cancer cells. (A) The expression status of the NCAPH gene in PCa based on TCGA database. (B) NCAPH mRNA expression was upregulated in PCa compared with adjacent normal tissues. (C and D) NCAPH protein expression was upregulated in PCa tumor tissues than that in adjacent normal tissues as determined by IHC and western bloting. (E) The survival analysis indicated that the NCAPH gene was a risk factor and was related to the survival and prognosis of PCa tissues based on GEO database. (F and G) The mRNA and protein levels of NCAPH in PCa cell lines are determined by RT-qPCR and western bloting. (H) Images of representative nude mouse xenograft model tumor. LNCaP tumor xenografts excised from male BALB/c (nu/nu) nude mice after 28 days treatments with the in vivo RNA interfering of knockdown the NCAPH gene (NCAPH-KD group) or control group. (I and J) Days versus tumor volume curves and tumor weight for LNCaP tumor xenografts show that NCAPH-KD inhibited tumor growth compared with control group. (K) Representative IHC staining images of NCAPH and Ki67 were presented in NCAPH-KD-treated or control-treated LNCaP xenograft nude mice tissues. Scale bar, 50 µm. ns, non-significant, * P < 0.05, ** P < 0.01, *** P < 0.001, **** P < 0.0001 vs control.
NCAPH-KD inhibits cell proliferation and induces apoptosis in PCa cells
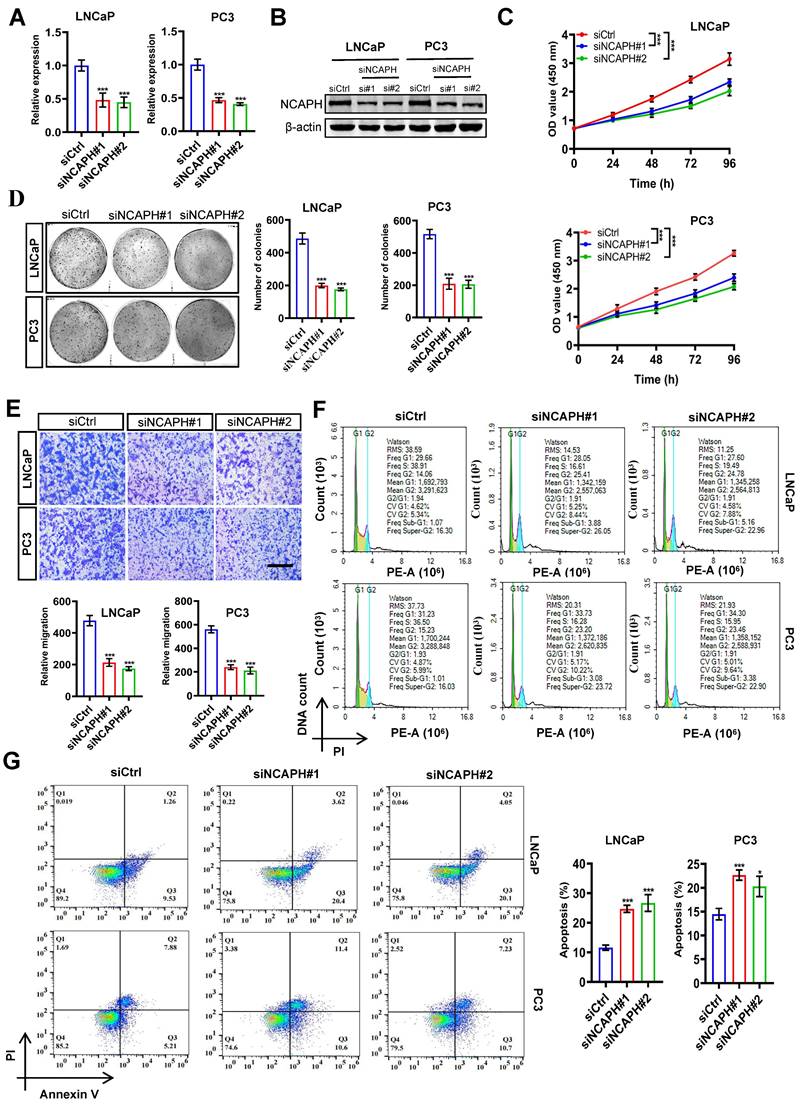
To further evaluate the function of the NCAPH gene in PCa cells, we conducted RNA interference (siNCAPH: siNCAPH#1 or siNCAPH#2) to induce NCAPH knockdown (NCAPH-KD) in PCa cells, using non-targeting siRNA as a negative control (siCtrl). The efficiency of NCAPH-KD in PCa cells was assessed by RT-qPCR and western blotting. As shown in Figure 2A and B, both NCAPH gene expression and NCAPH protein levels were significantly reduced in NCAPH-KD LNCaP and PC3 cells compared to siCtrl-treated cells at 72 hours post-transfection. To assess cell proliferation, we then performed CCK-8 and colony formation assays in NCAPH-KD and siCtrl-treated LNCaP and PC3 cells. The results showed that proliferation of LNCaP and PC3 cells was significantly inhibited following NCAPH-KD treatment (Figure 2C and D). Next, we performed transwell analysis to examine whether NCAPH affects the migrational capacity of PCa cells. Our findings revealed that NCAPH-KD significantly inhibited the migration of LNCaP and PC3 cells (Figure 2E). Furthermore, we confirmed that NCAPH-KD induced cell cycle arrest at the G2/M phase in PCa cells (Figure 2F). In addition, we found that NCAPH-KD induced increased apoptosis in LNCaP and PC3 cells (Figure 2G). Overall, our current results indicated that NCAPH is a key factor regulating PCa cell proliferation and apoptosis.
NCAPH depletion inhibits the maligant potentials of PCa cells. (A) RT-qPCR analysis of NCAPH transcription in siCtrl-, siNCAPH#1- or siNCAPH#2-treated LNCaP and PC3 PCa cells. Data were normalized against ACTB and represented as fold change. (B) Western blotting showing NCAPH expression in siCtrl-, siNCAPH#1- or siNCAPH#2-treated LNCaP and PC3 PCa cells. (C) CCK-8 analysis showing the effect of NCAPH-KD (siNCAPH#1, siNCAPH#2) on the cell proliferation of the tested PCa cell lines. (D) Representative images of colony formation assays and their quantification in NCAPH-KD LNCaP and PC3 PCa cells. (E) NCAPH-KD in LNCaP and PC3 cells significantly inhibited cell migrational capacity. (F) NCAPH-KD with siNCAPH#1 or siNCAPH#2 induced cell cycle arrest at the G2/M phase in LNCaP and PC3 PCa cells, compared to the cells transfected with siCtrl-by flow cytometry. (G) NCAPH-KD with siNCAPH#1 or siNCAPH#2 induced cell apoptosis in LNCaP and PC3 PCa cells. Scale bar, 100 µm. ns, non-significant, * P < 0.05, ** P < 0.01, *** P < 0.001 vs control.
NCAPH promotes the proliferation of PCa cells via modulating E2F1/PI3K/AKT/mTOR axis
To further investigate the mechanism by which the NCAPH gene regulates PCa cell proliferation, we next explored differentially enriched pathways in the NCAPH high- and low-expression clinical groups from the TCGA database. Based on GSVA (gene set variation analysis), we found that NCAPH was associated with proliferation pathways such as the E2F1-related pathway, the G2/M checkpoint, and the PI3K/AKT/mTORC1 signaling pathway. At the same time, we noticed that NCAPH was associated with Gleason score, tumor stage, and lymph node metastasis (Figure 3A). We also found a strong correlation between the NCAPH gene and several other genes: CDK1 (cor = 0.85), E2F1 (cor = 0.66), CCNB1 (cor = 0.72), PTEN (cor = -0.10), MYC (cor = 0.20), and AKT1 (cor = 0.21) (Figure 3B). These findings suggested that NCAPH is a critical driver of cell proliferation through the activation of the PI3K/AKT/mTORC1 pathway mediated by E2F1 in PCa. Importantly, the transcription factor E2F1 is widely recognized for its role in controlling cell cycle progression [16]. Previous studies have revealed that E2F1 is a key gene in PCa progression [17,18]. More intriguingly, E2F1 plays a crucial role in activating the PI3K/AKT/mTOR signaling pathway in hepatocellular carcinoma cells [19]. However, the relationship between NCAPH and the E2F1/PI3K/AKT/mTOR axis remains unclear.
NCAPH is a vital regulator of PI3K/AKT/mTOR axis. (A) Differential enrichment pathways and Gleason grades in high - and low-expression of the NCAPH gene clinical groups from the TCGA database. (B) The correlation between the NCAPH gene and cell cycle related markers, PI3K/AKT/mTOR markers in PCa which based on TCGA database. (C) NCAPH-KD reduced the protein expression of PI3K/AKT/mTOR signaling related markers and cell cycle related markers in LNCaP and PC3 cells. (D) The relationship between NCAPH gene and E2F family genes was analyzed by TCGA database. ns, non-significant, * P < 0.05, ** P < 0.01, *** P < 0.001 vs control.
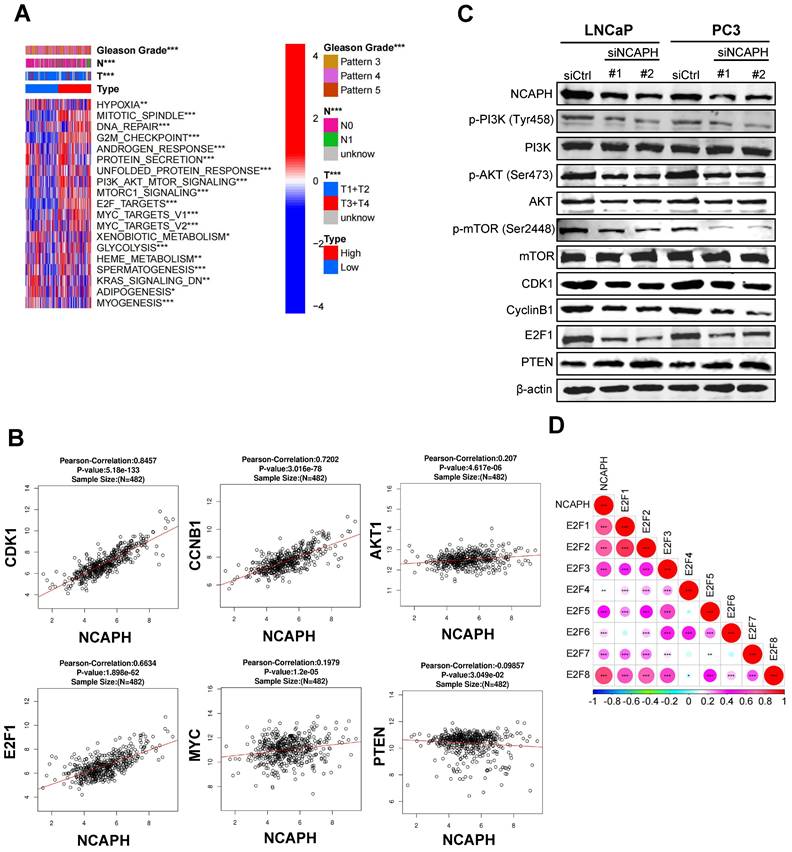
Next, we sought to determine whether NCAPH promotes the proliferation of PCa cells by activating the PI3K/AKT/mTOR pathway. In LNCaP and PC3 cells treated with NCAPH-KD, we found that NCAPH-KD reduced the expression levels of E2F1, CDK1, Cyclin B1, phosphorylated PI3K, phosphorylated AKT, and phosphorylated mTOR (Figure 3C). Furthermore, our exploration of the relationships among E2F family genes revealed that E2F1 had the highest correlation with NCAPH, suggesting that E2F1 may be a downstream target gene of NCAPH (Figure 3D). Our data demonstrate that NCAPH plays an oncogenic role in PCa cells by activating the E2F1/PI3K/AKT/mTOR pathway.
NCAPH regulates E2F1 transcription in PCa cells
To further investigate the mechanism by which NCAPH regulates proliferation through E2F1 in PCa cells, we analyzed E2F1 expression in NCAPH-KD PCa cells using RT-qPCR and Western blotting. Our results showed that NCAPH-KD significantly reduced E2F1 expression at both the mRNA and protein levels in LNCaP and PC3 cells (Figure 4A and B). Next, we explored the interaction between NCAPH and E2F1 in PCa cells. The AlphaFold-predicted structures of NCAPH and E2F1 were obtained from the Uniprot database with access IDs of O00255 and Q08050, respectively. These structures were then subject to 50 ns long implicit solvent MD simulations to refine their structures.
NCAPH favorably regulates the expression of E2F1. (A) RT-qPCR analysis showing down-regulated E2F1 expression in NCAPH-KD LNCaP and PC3 cells. (B) Western blotting analysis showing NCAPH-KD caused a strong reduction of E2F1 expression in LNCaP and PC3 cells. (C) The RMSD of NCAPH and E2F1 during the 50 ns MD refinement simulations. (D) Histograms of the top 10 ZDOCK binding scores of NCAPH-E2F1 poses. (E) Molecular docking patterns for NCAPH and E2F1. (F) The physical interaction between NCAPH and E2F1 in LNCaP and PC3 cells were detected by Co-IP. (G) Schematic representation of the position of ChIP-qPCR primers along the E2F1 promoter. ChIP-qPCR analyzing the NCAPH recruitment to the E2F1 promoter in siNCAPH#1- or siNCAPH#2-treated LNCaP and PC3 cells. ns, non-significant, * P < 0.05, ** P < 0.01, *** P < 0.001 vs control.
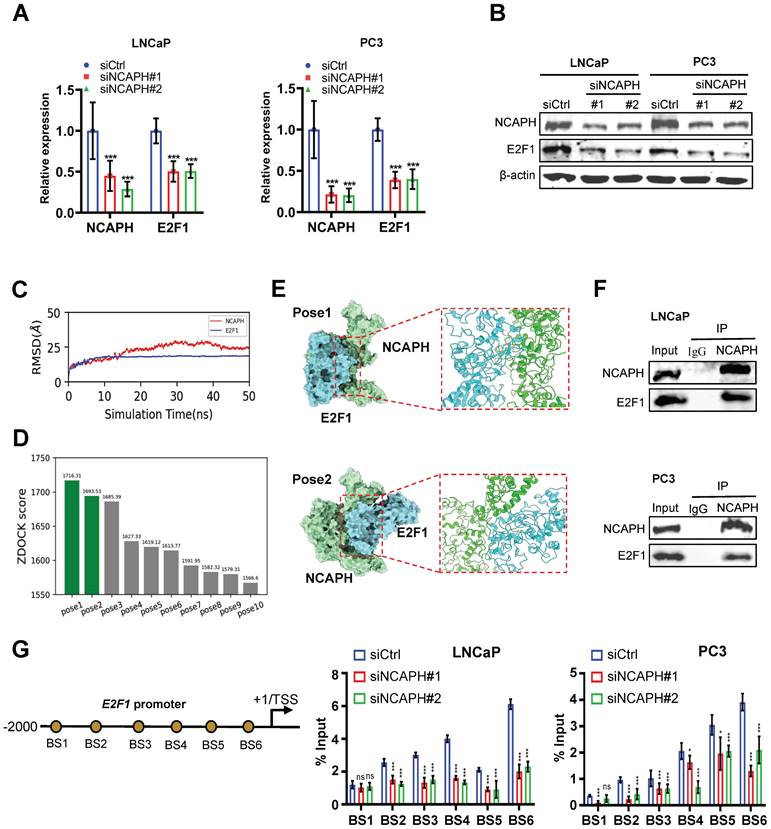
The MD refinement consists of three sequential stages: a. 20000 steps of energy minimization (first 200 steps using the steepest descent algorithm and the rest using the conjugate gradient algorithm). b. Heating the system up to 300 K over 1 ns, with 5 kcal/mol/Å2 harmonic restraints applied on the heavy atoms (no-hydrogen atoms) of the protein. After reaching 300 K, a 50 ns production MD was conducted with all restraints removed. The Amber ff19SB force field was used [20], and the non-bonded interaction cutoff was 10 Å, and the time step was 2 fs. The MD simulations were performed via the Amber20 package [21]. For the 50 ns long MD refinement simulations, we calculated the RMSD (root mean square deviation) relative to the starting structure to justify if the structures have become stable. As shown in Figure 4C, the RMSD curves of both proteins became plateaued, meaning that the structures are stable. For each protein, the last frame of the 50 ns MD trajectory was used as input to the ZDOCK server for unbiased docking (without specifying any contacting or repulsion residues) [22]. For the top ten docked NCAPH-E2F1 poses, we showed their ZDOCK docking scores in Figure 4D. Poses 1 and 2 are the representative poses and are also having similar protein-protein binding interfaces. Structure were rendered using the ChimeraX software [23,24]. Visual representation of top 2 of ZDOCK score for the binding of E2F1 to the NCAPH was provided in the 3D map illustrated in Figure 4E. Furthermore, co-immunoprecipitation (Co-IP) results confirmed that NCAPH interacts with E2F1 in PCa cells (Figure 4F).
To further investigate the regulation of the E2F1 gene by NCAPH in PCa cells, we assessed NCAPH occupancy on the E2F1 promoter using ChIP analysis. Our analysis demonstrated that NCAPH binds to the proximal promoter of the E2F1 gene, covering the region from -2000 to -10 relative to its transcription start site (TSS). Notably, the signal for NCAPH enrichment decreased significantly when cells were treated with siNCAPH (Figure 4G). Collectively, these findings reveal that NCAPH interacts with E2F1 and promotes E2F1 transcription by binding to the proximal promoter of the E2F1 gene in PCa cells.
NCAPH is essential for E2F1 mediated cell cycle transition in PCa cells
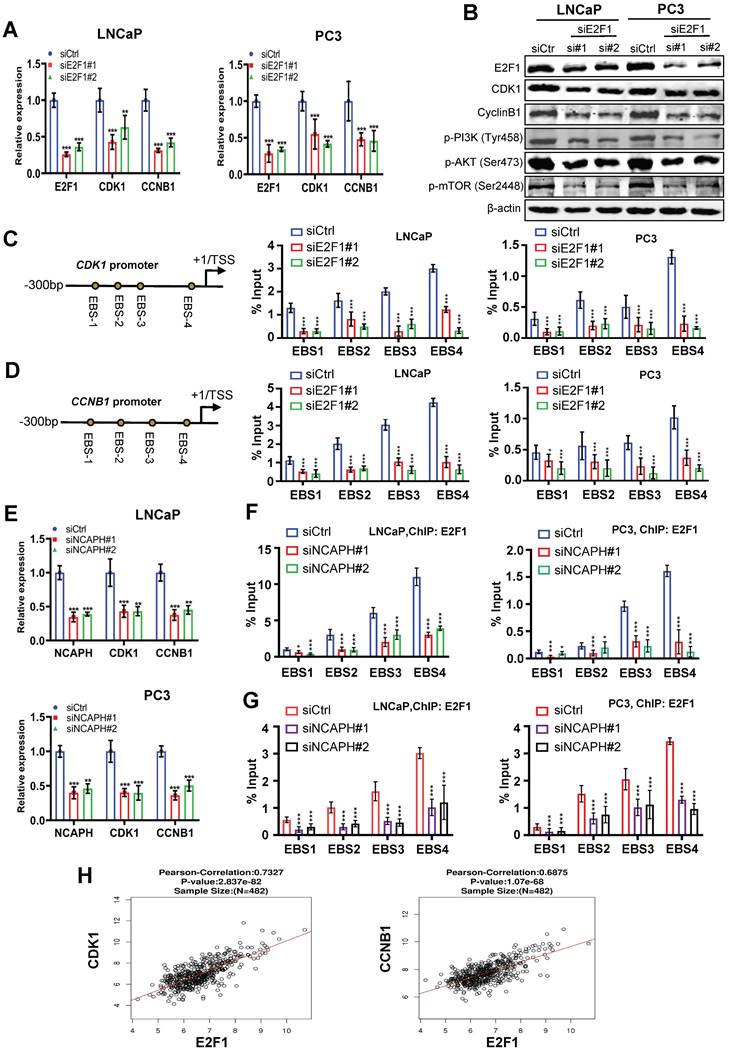
E2F1 is a key promoter regulating cell cycle transitions in PCa cells [25], therefore, we sought to determine whether NCAPH is involved in the cell cycle transitions controlled by E2F1 in PCa cells. Firstly, we found that E2F1-KD significantly reduced the mRNA expression of cell cycle-related markers such as CDK1 and CCNB1 (Figure 5A). In addition, the protein expression of CDK1, Cyclin B1, phosphorylated-PI3K, phosphorylated-AKT or phosphorylated-mTOR was inhibited in LNCaP and PC3 cells treated with E2F1-KD (Figure 5B). These results indicated that E2F1 is a key regulator of cell cycle transitions and PI3K/AKT/mTOR pathway in PCa cells, consistent with previous studies [26,27]. We then investigated the mechanism by which E2F1 activates CDK1 and CCNB1 in PCa cells. ChIP-qPCR results showed that E2F1 binds to the proximal promoter of CDK1 or CCNB1 genes and subsequently regulates their transcription in LNCaP and PC3 cells (Figures 5C and D). On the other hand, we also demonstrated that NCAPH-KD significantly reduced the mRNA expression of CDK1 and CCNB1 (Figures 5E). More interestingly, ChIP-qPCR results showed that NCAPH-KD significantly reduced the binding efficiency of E2F1 to the proximal promoters of CDK1 and CCNB1, thereby reducing the transcription of CDK1 and CCNB1 genes in these PCa cells (Figures 5F and G). These results indicate that NCAPH is involved in the regulation of CDK1 and CCNB1 gene transcription by E2F1 in PCa cells. Finally, we also observed that the expression of E2F1 mRNA in PCa clinical samples based on the TCGA dataset was positively correlated with the expression of CDK1 and CCNB1 mRNA (Figure 5H). Our data indicate that NCAPH is essential for E2F1 to activate CDK1 and CCNB1 transcription in PCa cells.
NCAPH promotes the transcription of CDK1 and CCNB1 mediated by E2F1 in PCa cells. (A) RT-qPCR analysis showing down-regulated CDK1 and CCNB1 expression in E2F1-KD LNCaP and PC3 cells. (B) Western blotting analysis showing E2F1-KD caused a strong reduction of CDK1 and Cyclin B1 expression in LNCaP and PC3 cells. (C and D) Schematic representation of the position of ChIP-qPCR primers along the CDK1 and CCNB1 promoter. ChIP-qPCR analyzing the E2F1 recruitment to the CDK1 and CCNB1 promoter in siE2F1#1- or siE2F1#2-treated LNCaP and PC3 cells. (E) RT-qPCR analysis showing down-regulated CDK1 and CCNB1 expression in NCAPH-KD LNCaP and PC3 cells. (F and G) ChIP-qPCR analyzing the E2F1 recruitment to the CDK1 and CCNB1 promoter in siNCAPH#1- or siNCAPH#2-treated LNCaP and PC3 cells. (H) The correlation between the E2F1 gene and CDK1 and CCNB1 in PCa based on TCGA database. ns, non-significant, * P < 0.05, ** P < 0.01, *** P < 0.001 vs control.
NCAPH-KD combined with mTOR inhibitor or CDK inhibitor inhibits the growth of PCa cells in vitro and in vivo
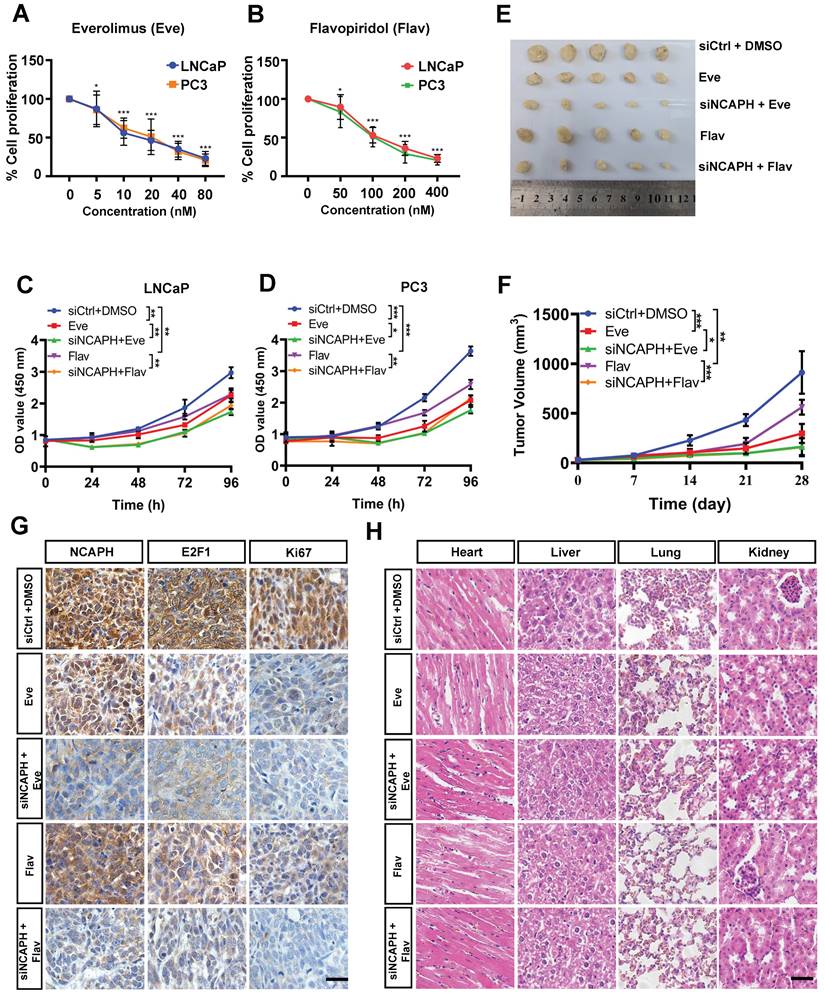
Given our findings that NCAPH promotes the proliferation of PCa cells by activating multiple pathways, such as mTOR and cell cycle transition, we next aimed to investigate the synergistic anti-tumor effects of NCAPH in combination with the mTOR inhibitor Everolimus (Eve) (MedChemExpress, HY-10218) and the cyclin-dependent kinase inhibitor Flavopiridol (Flav) (MedChemExpress, HY-10005). As shown in Figures 6A and B, we observed dose-dependent growth inhibition in LNCaP and PC3 cells treated with either Eve or Flav. These results indicated that both Eve and Flav effectively inhibit the proliferation of PCa cells. Notably, we found that the combination of NCAPH knockdown (NCAPH-KD) with Eve (20 nM) or NCAPH-KD with Flav (100 nM) exhibited significantly stronger anti-proliferative effects on PCa cells compared to the individual treatments (Figures 6C and D). Furthermore, we administered DMSO, Eve, Flav, NCAPH-KD combined with Eve, or NCAPH-KD combined with Flav in a LNCaP cell xenograft nude mouse model. We discovered that NCAPH-KD combined with these two inhibitors significantly reduced the size of xenograft tumors in nude mice compared to the use of either treatment alone (Figures 6E and F). Additionally, we observed that NCAPH-KD combined with these inhibitors resulted in a substantial reduction in the expression of NCAPH, E2F1, and Ki67 in the xenografted tumor tissues when compared to single treatments with Eve or Flav (Figure 6G). Meanwhile, Hematoxylin and Eosin (HE) staining analysis demonstrated that the treatments with NCAPH-KD, Eve, or Flav did not cause any damage to the organs of xenografted nude mice, including the heart, liver, kidney, and lung (Figure 6H). In conclusion, our results indicate that NCAPH-KD can synergistically enhance the anti-proliferative effects of Eve or Flav on PCa cells both in vitro and in vivo, suggesting that NCAPH is a potential therapeutic target for PCa treatment.
Combination NCAPH-KD and mTOR inhibitor or CDK inhibitor is an effective strategy for inhibiting the growth of PCa cells. (A and B) Growth inhibitory effects of different concentrations of Everolimus (Eve) and Flavopiridol (Flav) were determined 48 h after treatment on LNCaP and PC3 cells by CCK-8 assay. (C and D) NCAPH-KD combined with Eve or Flav showed synergistic inhibition on LNCaP and PC3 cells which was determined by CCK8 assay. (E and F) NCAPH-KD combined with Eve or Flav significantly reduced xenografted tumor volume and the xenografted LNCaP cells' growth. (G) Representative IHC staining images for NCAPH, E2F1 and Ki67 in xenografted tumor tissues upon NCAPH-KD combined with Eve or Flav treatment. (H) HE analysis the situation of the heart, liver, kidney and lung in NCAPH-KD combined with Eve or Flav treated-xenografted nude mice. Scale bar, 50 µm. ns, non-significant, * P < 0.05, ** P < 0.01, *** P < 0.001 vs control.
Discussion
Prostate cancer remains a major contributor to cancer-related mortality in males, particularly in Western countries, with its global incidence on the rise. Despite extensive research efforts, the precise mechanisms underlying the initiation and progression of prostate cancer are not yet fully understood.
Consequently, a thorough investigation into the molecular pathways involved in prostate cancer progression is essential for identifying novel drug targets and therapeutic strategies.
Effective treatment strategies for patients with advanced prostate cancer, including castration-resistant prostate cancer (CRPC) and metastatic castration-resistant prostate cancer (mCRPC), remain elusive because the mechanisms of progression of these diseases are not well understood. Our results suggest that the oncogene NCAPH plays an important role in both AR-positive prostate cancer and CRPC cells. NCAPH encodes a member of the Barr protein family that plays a crucial role in the condensin complex. Condensin is an important protein complex responsible for organizing interphase chromatin into chromosomes and promoting their proper segregation during mitosis and meiosis [28]. There are two known condensin complexes [29], of which the condensin II complex is mainly located in the nucleus during interphase and binds to chromosomes during mitosis [30]. Many studies have shown that increased NCAPH expression levels are associated with the development and prognosis of various types of tumors [31].
While previous research has highlighted the oncogenic role of NCAPH in PCa [14,32], our current study builds upon these findings, revealing a substantial increase in NCAPH levels that correlates positively with disease progression. These results suggest that NCAPH overexpression could serve as a primary oncogenic driver in prostate cancer. However, the exact mechanisms by which NCAPH promotes malignancy in prostate cancer cells remain unclear. Interestingly, data mining analysis indicated associations between NCAPH and E2F1-related pathways, PI3K/AKT/mTORC1 signaling, and other pathways related to cell proliferation, as identified through Gene Set Variation Analysis. Recent studies have demonstrated that NCAPH silencing significantly downregulates the AKT/mTOR signaling pathway, thereby inhibiting proliferation, migration, and invasion in breast cancer cells [33]. Our findings revealed that silencing the NCAPH gene effectively suppressed proliferation, reduced cell cycle progression in prostate cancer cells by directly inhibiting the PI3K/AKT/mTOR pathway, and decreased the expression of the transcription factor E2F1.
E2F1 is the most classical member of the E2F family and plays a multifaceted role in regulating tumor development by targeting various signaling pathways, including the Wnt/β-catenin pathway [34], the Notch pathway [35], and the PI3K/AKT/mTOR pathway [36]. In this study, we demonstrated that knockdown of the NCAPH gene resulted in a decrease in both the mRNA and protein levels of E2F1, suggesting that E2F1 may be a potential target of NCAPH in PCa cells. By ChIP analysis, we observed the binding affinity of NCAPH to the proximal promoter of E2F1 and identified E2F1 as a direct downstream target of NCAPH, mediating its oncogenic function to enhance PI3K/AKT/mTORC1 activity. In addition, our study elucidated for the first time the role of E2F1 as an interacting protein associated with NCAPH in PCa cells. Using molecular docking prediction and Co-IP analysis, we confirmed the interaction between NCAPH and E2F1. The intriguing interaction between NCAPH and E2F1 warrants further investigation of its underlying mechanisms, which will be the focus of our future studies.
Our findings above confirmed that NCAPH promotes cell cycle transitions by activating the PI3K/AKT/mTOR signaling pathway in PCa cells. Therefore, our next goal was to investigate whether silencing the NCAPH gene could enhance the sensitivity of PCa cells to PI3K/AKT/mTOR or cyclin-dependent kinase (CDK) inhibitors. We specifically chose to study the mTORC1 inhibitor everolimus (RAD001) [37], which is approved for resensitizing PCa cells to docetaxel [38]. In addition, we selected Flavonoids as the first CDK inhibitors to undergo phase I/II clinical trials [39]. Flavonoids are pan-cyclin-dependent kinase inhibitors known for their potent efficacy in inducing apoptosis in cancer cells [40]. Our data showed that silencing the NCAPH gene combined with everolimus or flavonoids significantly inhibits the malignant progression of PCa cells in vitro and in vivo and is superior to everolimus or flavonoids alone. These results are particularly noteworthy given our limited understanding of the molecular mechanisms of prostate cancer. The identification of NCAPH as a novel tumor promoter represents a promising new therapeutic target.
Conclusion
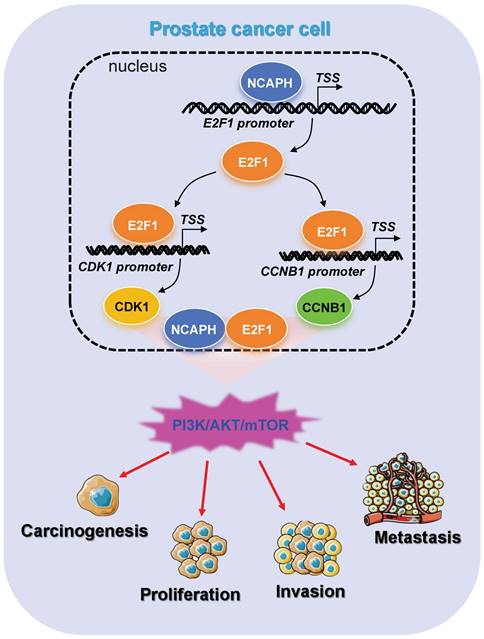
The present study revealed the oncogenic role and regulatory mechanism of NCAPH in the prostate cancer cells (Figure 7). Overall, the results of the present study have provided novel insights into the progression of prostate cancer cells to cancer therapeutics, which may be used to prevent and treat prostate cancer in the future.
Schematic representation of NCAPH promotes the progression of prostate cancer through activating E2F1 mediated PI3K/AKT/mTOR signaling pathway.
Supplementary Material
Supplementary tables.
Acknowledgements
We are grateful to Prof Wanhai Xu for his scientific input.
Funding
This research was funded by National Key Research and Development Program of China, grant number 2022YFA1205704; the Natural Science Foundation of Heilongjiang Province, grant number YQ2023H015; the Fundamental Research Funds for the Provincial Universities of Heilongjiang, grant number 2022KYYWF-0298; the Research Fund of the Fourth Affiliated Hospital of Harbin Medical University, grant number HYDSYRCYJ02; the Research Fund of Chongqing Key Laboratory of Development and Utilization of Genuine Medicinal in Three Gorges Reservoir Area, grant number KFKT2022011.
Availability of data and materials
The data generated in the present study may be requested from the corresponding author on reasonable request.
Ethics approval and consent to participate
All procedures were in accordance with the ethical standards of Fourth Affiliated Hospital of Harbin Medical University (approval number 2021-WZYSLLSC-31) and with the 1964 Helsinki declaration and its later amendments or comparable ethical standards. Written informed consent was obtained from all the participants prior to participation in the study. All animal experiments were performed in accordance with the Guide for the Care and Use of Laboratory Animals (NIH publication No. 85 - 23, revised 1985) and were approved by the Institutional Animal Care and Use Committee of Harbin Medical University.
Author contributions
Conceptualization, Y.L. and Q.S.; methodology, J.M.; software, T.L. And B.S.; validation, X.P., K.C. and M.X.; formal analysis, Q.S. and J.M.; investigation, Q.S.; writing—original draft preparation, Y.L. and Q.S.; writing—review and editing, Z.W.; supervision, M.Z. and Y.L.; project administration, M.Z. and Y.L.; funding acquisition, Y.L. All authors have read and agreed to the published version of the manuscript.
Competing Interests
The authors have declared that no competing interest exists.
References
1. Siegel RL, Giaquinto AN, Jemal A. Cancer statistics, 2024. CA Cancer J Clin. 2024;74:12-49
2. Sekhoacha M, Riet K, Motloung P. et al. Prostate Cancer Review: Genetics, Diagnosis, Treatment Options, and Alternative Approaches. Molecules. 2022;27:5730
3. Yamada Y, Beltran H. The treatment landscape of metastatic prostate cancer. Cancer Lett. 2021;519:20-29
4. Liu S, Alabi BR, Yin Q. et al. Molecular mechanisms underlying the development of neuroendocrine prostate cancer. Semin Cancer Biol. 2022;86:57-68
5. Kagami Y, Yoshida K. The functional role for condensin in the regulation of chromosomal organization during the cell cycle. Cell Mol Life Sci. 2016;73:4591-4598
6. Lei Y, Wang D, Chen W. et al. FOXM1/NCAPH activates glycolysis to promote colon adenocarcinoma stemness and 5-FU resistance. Anticancer Drugs. 2023;34:929-938
7. Oliveira RA, Coelho PA, Sunkel CE. The condensin I subunit Barren/CAP-H is essential for the structural integrity of centromeric heterochromatin during mitosis. Mol Cell Biol. 2005;25:8971-8984
8. Mendiburu-Eliçabe M, García-Sancha N, Corchado-Cobos R. et al. NCAPH drives breast cancer progression and identifies a gene signature that predicts luminal a tumour recurrence. Clin Transl Med. 2024;14:e1554
9. Xiong Q, Fan S, Duan L. et al. NCAPH is negatively associated with Mcl-1 in non-small cell lung cancer. Mol Med Rep. 2020;22:2916-2924
10. Li B, Xiao Q, Shan L. et al. NCAPH promotes cell proliferation and inhibits cell apoptosis of bladder cancer cells through MEK/ERK signaling pathway. Cell Cycle. 2022;21:427-438
11. Wang M, Qiao X, Cooper T. et al. HPV E7-mediated NCAPH ectopic expression regulates the carcinogenesis of cervical carcinoma via PI3K/AKT/SGK pathway. Cell Death Dis. 2020;11:1049
12. Yin L, Jiang LP, Shen QS. et al. NCAPH plays important roles in human colon cancer. Cell Death Dis. 2017;8:e2680
13. Wang Y, Li JQ, Yang ZL. et al. NCAPH regulates gastric cancer progression through DNA damage response. Neoplasma. 2022;69:283-291
14. Arai T, Kojima S, Yamada Y. et al. Micro-ribonucleic acid expression signature of metastatic castration-resistant prostate cancer: Regulation of NCAPH by antitumor miR-199a/b-3p. Int J Urol. 2019;26:506-520
15. Luo Y, Vlaeminck-Guillem V, Teinturier R. et al. The scaffold protein menin is essential for activating the MYC locus and MYC-mediated androgen receptor transcription in androgen receptor-dependent prostate cancer cells. Cancer Commun (Lond). 2021;41:1427-1430
16. Stanelle J, Stiewe T, Theseling CC. et al. Gene expression changes in response to E2F1 activation. Nucleic Acids Res. 2002;30:1859-1867
17. Ramos-Montoya A, Lamb AD, Russell R. et al. HES6 drives a critical AR transcriptional programme to induce castration-resistant prostate cancer through activation of an E2F1-mediated cell cycle network. EMBO Mol Med. 2014;6:651-661
18. Valdez CD, Kunju L, Daignault S. et al. The E2F1/DNMT1 axis is associated with the development of AR negative castration resistant prostate cancer. Prostate. 2013;73:1776-1785
19. Yu Y, Zhao D, Li K. et al. E2F1 mediated DDX11 transcriptional activation promotes hepatocellular carcinoma progression through PI3K/AKT/mTOR pathway. Cell Death Dis. 2020;11:273
20. Tian C, Kasavajhala K, Belfon K. et al. ff19SB: Amino-Acid-Specific Protein Backbone Parameters Trained against Quantum Mechanics Energy Surfaces in Solution. J Chem Theory Comput. 2020;16:528-552
21. Case DA, Belfon K, Ben-Shalom IY. et al. AMBER2020, university of California, San Fransisco J. Amer. Chem. Soc. 2020;142:3823-3825
22. Pierce BG, Wiehe K, Hwang H. et al. ZDOCK server: interactive docking prediction of protein-protein complexes and symmetric multimers. Bioinformatics. 2014;30:1771-1773
23. Goddard TD, Huang CC, Meng EC. et al. UCSF ChimeraX: Meeting modern challenges in visualization and analysis. Protein Sci. 2018;27:14-25
24. Pettersen EF, Goddard TD, Huang CC. et al. UCSF ChimeraX: Structure visualization for researchers, educators, and developers. Protein Sci. 2021;30:70-82
25. Chun JN, Cho M, Park S. et al. The conflicting role of E2F1 in prostate cancer: A matter of cell context or interpretational flexibility. Biochim Biophys Acta Rev Cancer. 2020;1873:188336
26. Liang YX, Lu JM, Mo RJ. et al. E2F1 promotes tumor cell invasion and migration through regulating CD147 in prostate cancer. Int J Oncol. 2016;48:1650-1658
27. Huang L, Chen K, Cai ZP. et al. DEPDC1 promotes cell proliferation and tumor growth via activation of E2F signaling in prostate cancer. Biochem Biophys Res Commun. 2017;490:707-712
28. Hirano T. Condensins: universal organizers of chromosomes with diverse functions. Genes Dev. 2012;26:1659-1678
29. Ono T, Losada A, Hirano M. et al. Differential contributions of condensin I and condensin II to mitotic chromosome architecture in vertebrate cells. Cell. 2003;115:109-121
30. Ono T, Fang Y, Spector DL. et al. Spatial and temporal regulation of Condensins I and II in mitotic chromosome assembly in human cells. Mol Biol Cell. 2004;15:3296-3308
31. Liu C, Han X, Zhang S. et al. The role of NCAPH in cancer treatment. Cell Signal. 2024;121:111262
32. Cui F, Hu J, Xu Z. et al. Overexpression of NCAPH is upregulated and predicts a poor prognosis in prostate cancer. Oncol Lett. 2019;17:5768-5776
33. Liao L, Cheng H, Liu S. Non-SMC condensin I complex subunit H promotes the malignant progression and cisplatin resistance of breast cancer MCF-7 cells. Oncol Lett. 2022;24:317
34. Qiang G, Yu Q, Su K. et al. E2F1-activated LINC01224 drives esophageal squamous cell carcinoma cell malignant behaviors via targeting miR-6884-5p/DVL3 axis and activating Wnt/β-catenin signaling pathway. Pathol Res Pract. 2022;235:153873
35. Zhang L, Shi L. The E2F1/MELTF axis fosters the progression of lung adenocarcinoma by regulating the Notch signaling pathway. Mutat Res. 2023;827:111837
36. Zhang Y, Hao X, Han G. et al. E2F1-mediated GINS2 transcriptional activation promotes tumor progression through PI3K/AKT/mTOR pathway in hepatocellular carcinoma. Am J Cancer Res. 2022;12:1707-1726
37. Dancey J. mTOR signaling and drug development in cancer. Nat Rev Clin Oncol. 2010;7:209-219
38. Alshaker H, Wang Q, Kawano Y. et al. Everolimus (RAD001) sensitizes prostate cancer cells to docetaxel by down-regulation of HIF-1α and sphingosine kinase 1. Oncotarget. 2016;7:80943-80956
39. Kelland LR. Flavopiridol, the first cyclin-dependent kinase inhibitor to enter the clinic: current status. Expert Opin Investig Drugs. 2000;9:2903-2911
40. Zhang M, Zhang L, Hei R. et al. CDK inhibitors in cancer therapy, an overview of recent development. Am J Cancer Res. 2021;11:1913-1935
Author contact
![]() Corresponding authors: Prof. Manjie Zhang, Address: No. 157 Baojian Road, Nan Gang District, Harbin, China, 150081; Email: zhangmj454edu.cn; Prof. Yakun Luo, Address: No. 37 Yi Yuan Street, Nan Gang District, Harbin, China, 150001; Email: luoyankunedu.cn.
Corresponding authors: Prof. Manjie Zhang, Address: No. 157 Baojian Road, Nan Gang District, Harbin, China, 150081; Email: zhangmj454edu.cn; Prof. Yakun Luo, Address: No. 37 Yi Yuan Street, Nan Gang District, Harbin, China, 150001; Email: luoyankunedu.cn.