Impact Factor ISSN: 1449-1907

 Global reach, higher impact
Int J Med Sci 2020; 17(13):2002-2012. doi:10.7150/ijms.47076 This issue Cite
Research Paper
Comparison of three classification systems of Prepregnancy Body Mass Index with Perinatal Outcomes in Japanese Obese Pregnant Women: A retrospective study at a single center
Ryo Sugimura1, Yukiko Kohmura-Kobayashi1 ![]() , Megumi Narumi1, Naomi Furuta-Isomura1, Tomoaki Oda1, Naoaki Tamura1, Toshiyuki Uchida1, Kazunao Suzuki1, Motoi Sugimura2, Naohiro Kanayama1, Hiroaki Itoh1
, Megumi Narumi1, Naomi Furuta-Isomura1, Tomoaki Oda1, Naoaki Tamura1, Toshiyuki Uchida1, Kazunao Suzuki1, Motoi Sugimura2, Naohiro Kanayama1, Hiroaki Itoh1
1. Department of Obstetrics and Gynecology, Hamamatsu University School of Medicine, Hamamatsu, Shizuoka, Japan.
2. Department of Obstetrics, Gynecology and Family Medicine, Hamamatsu University School of Medicine, Hamamatsu, Shizuoka, Japan.
Received 2020-4-16; Accepted 2020-7-10; Published 2020-7-25
Abstract
In Japan, pregnant women are diagnosed as obese if the prepregnancy body mass index (BMI) is ≥25 kg/m2. However, this is different from other countries. The Institute of Medicine (IOM) classifies prepregnancy BMI as underweight (BMI <18.5 kg/m2), normal weight (BMI 18.5-24.9 kg/m2), overweight (BMI 25.0-29.9 kg/m2), and obese (BMI ≥30 kg/m2). In addition to these four categories, the American College of Obstetricians and Gynecologists (ACOG) classifies prepregnancy BMI as obesity class I (BMI 30.0-34.9 kg/m2), obesity class II (BMI 35.0-39.9 kg/m2), and obesity class III (BMI ≥40 kg/m2). We conducted a retrospective cohort study to compare obstetric outcomes by the three different categorizations in 6,066 pregnant women who gave birth between 2010 and 2019. According to Japanese classification, 668 (11%) pregnant women were classified as obese, and significant odds ratios (OR) were observed for hypertensive disorders of pregnancy (HDP; 3.32), gestational diabetes mellitus (GDM; 3.39), large for gestational age (LGA; 2.91), and macrosomia (4.01). According to the classification of IOM, 474 (7.8%) and 194 (3.1%) were classified as overweight and obese pregnant women, respectively. Specifically, a high OR was observed in obese pregnant women for HDP (5.85) and GDM (5.0). ACOG classification categorized 474 (7.8%) pregnant women as overweight, 141 (2.3%) as obesity class I, 41 (0.6%) as obesity class II, and 12 (0.2%) as obesity class III. In obesity class III, a significantly high OR was observed for HDP (12.89), GDM (8.37), and LGA (5.74). The Japanese classification may be useful for low-risk pregnancies, whereas IOM classification may be applicable to identify high-risk pregnancies. ACOG criteria may be useful for step-wise assessments of HDP and GDM risks in Japanese pregnant women; however, the number of class II and III obese pregnant women was small.
Keywords: prepregnancy, BMI, obese, classification, perinatal outcomes
Introduction
Obese pregnant women are associated with a high incidence of adverse outcomes in both mothers and infants, and the risk increases with increasing obesity. The Japan Society for the study of obesity (JASSO) decided to clarify obesity as peoples with BMI ≥25 kg/m2 in Japan, where the prevalence and degree of obesity remains mild [1]. This is because the incidence of obesity-associated complications, such as hypertension, hypercholesteremia, and glucose intolerance were significantly higher in the peoples with BMI ≥25 kg/m2 than those with BMI <25 kg/m2 [1]. The then Japanese Ministry of Health, Labour and Welfare defined pregnant women as obese if their prepregnancy body mass index (BMI) was ≥25 (kg/m2) in 2006 [2]. These official criteria are currently and widely used in Japan.
It is noted that this classification is different from those of Western countries. In the United States, the Institute of Medicine (IOM) has classified body weight based on prepregnancy BMI as underweight (BMI <18.5 kg/m2), normal weight (BMI 18.5-24.9 kg/m2), overweight (BMI 25.0-29.9 kg/m2), and obese (BMI ≥30 kg/m2) [3]. On the other hand, the American College of Obstetricians and Gynecologists (ACOG) classifies pregnant women as underweight (BMI <18.5 kg/m2), normal weight (BMI 18.5-24.9 kg/m2), overweight (BMI 25.0-29.9 kg/m2), obesity class I (BMI 30.0-34.9 kg/m2), obesity class II (BMI 35.0-39.9 kg/m2), and obesity class III (BMI ≥40 kg/m2) [4], in consideration of the World Health Organization classification for men and nonpregnant women [5]. Guidelines for Obstetrical Practice in Japan 2017 describe different recommendations by JASSO [6], the Japanese Ministry of Health, Labour and Welfare [2], and IOM [3] together, and state that there are different classifications in Japan [7].
Enomoto et al. assessed 97,157 women with singleton pregnancies registered in the Japan Society of Obstetrics and Gynecology (JSOG) Successive Pregnancy Birth Registry System, and compared Japanese and IOM classifications, demonstrating that BMI classification by the IOM is applicable to Japanese pregnant women [8]. We recently suggested that the optimal gestational weight gain is slightly higher than that in the current recommendation in 101,336 women with singleton pregnancies using the same Registry System and [9]. However, we cannot exclude the possibility that the heterogeneity of clinical practices in different institutions or hospitals, as well as diversity of regional lifestyles affect the pregnancy outcomes in the large-scale registry data analysis. Moreover, to the best of our knowledge, there have been few reports investigating the validity of the ACOG classification of prepregnancy BMI in Japanese pregnant women.
In the present study, we assumed that a retrospective analysis of pregnancy outcomes at a single center is based on consistent clinical practice and relatively similar reginal lifestyles of the subjects. Therefore, a single center study may support the findings obtained by analysis of large-scale registry data from across Japan.
We conducted a retrospective cohort study at a single center using the database to compare obstetric outcomes according to the three classifications, i.e., Japanese [2, 6], IOM [3], and ACOG [4].
Methods
Subjects
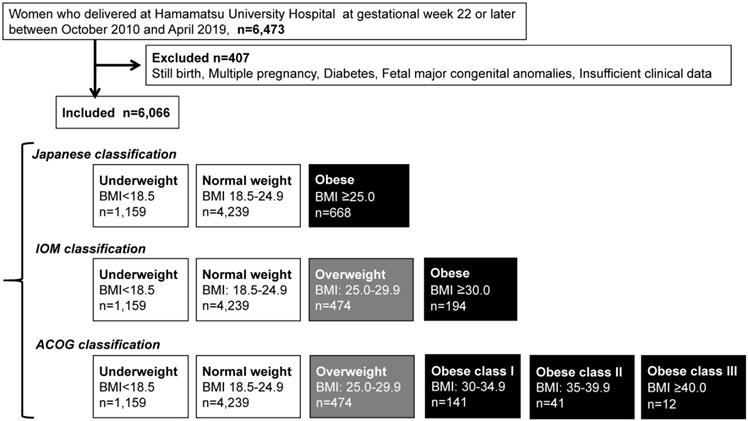
The present study was a retrospective investigation of women with singleton pregnancies delivered at Hamamatsu University Hospital at gestational week 22 or later. A total of 6,473 women were registered in the system between October 1, 2010 and April 30, 2019. The patient records were anonymized and deidentified prior to analysis. A total of 6,066 women were included in the study after exclusion of those with diabetes complications, history of delivering a newborn with congenital anomalies, or still birth, or whose data were insufficient (Figure 1).
Flow diagram of study inclusion and three different classifications.
Selection and classification of obese pregnant women
We first selected obese pregnant women (n = 668) using the classification of the Japanese Ministry of Health, Labour and Welfare [2] and JASSO [6], i.e., prepregnancy BMI ≥25 kg/m2 (Table 1A) (Figure 1). Next, we compared their perinatal outcomes with those of pregnant women with normal weight (prepregnancy BMI 18.5-24.9 kg/m2, n = 4,239).
We subsequently selected overweight (n = 474) and obese pregnant women (n = 194) using the IOM classification (Table 1B) (Figure 1), and compared their perinatal outcomes with those of pregnant women with normal weight (n = 4,239).
Lastly, we selected overweight (n = 474), obesity class I (n = 141), obesity class II (n = 41), and obesity class III (n = 12) according to the ACOG classification (Table 1C) (Figure 1). Next, we compared their perinatal outcomes with those of pregnant women with normal weight (n = 4,239).
Maternal backgrounds
The data of maternal age, primiparous rate, maternal height, prepregnancy BMI, maternal body weight gain, and gestational age at delivery were retrospectively collected from our clinical database. The data were separately assessed according to the three classifications of maternal obesity based on prepregnancy BMI.
Perinatal outcomes
The following perinatal outcomes were assessed in the present study: hypertensive disorders of pregnancy (HDP), gestational diabetes mellitus (GDM), large for gestational age (LGA), small for gestational age (SGA), macrosomia, spontaneous preterm birth, post-term birth, postpartum hemorrhage (PPH) in cesarean section (CS), PPH in vaginal delivery (VD), neonatal asphyxia (Apgar score <7 points at 5 min after delivery), neonatal acidosis (umbilical arterial pH <7.20), and total cesarean delivery (both elective and emergency). HDP was defined as hypertension (systolic blood pressure ≥140 mmHg and/or diastolic blood pressure ≥90 mmHg) developing after 20 weeks of gestation [10]. GDM (by 75-g oral glucose tolerance test) was diagnosed when at least one of the following was observed: fasting blood glucose level of ≥92 mg/dL, blood glucose level at 1 h of ≥180 mg/dL, or blood glucose level at 2 h ≥153 mg/dL. Macrosomia was defined as a neonatal birthweight ≥ 4,000 g. SGA was defined as a neonatal birthweight below the 10th percentile of the Japanese reference curves of birthweight for gestational week [11]. LGA was defined as a neonatal birth weight above the 90th percentile of the Japanese reference curves of birth weight for gestational week [11]. Induced preterm birth was defined as preterm delivery by CS or induction of labor due to obstetrical indications such as HDP or nonreassuring fetal status. Spontaneous preterm birth was defined as other than preterm birth medically indicated by cesarean section or labor induction. PPH in VD was defined as an estimated blood loss of 1,000 mL or more [12]. PPH in CS was defined as an estimated blood loss of ≥2,000 mL [12]. Post-term birth was defined as a delivery later than 42 weeks 0 days of gestation. Expected date of confinement was determined by the physician at the outpatient clinic based on the last menstrual period, ultrasonographic measurement of crown-rump length, estimated ovulation date, or date of embryonal transfer, if appropriate. If gestational age according to the last menstrual period differed by >7 days from that based on ultrasonographic measurement of crown-rump length at <11 weeks, the latter was used to assign a gestational age [13].
Statistics
Data were expressed as means ± standard deviation. Belcurve for Excel Statistics software version (Social Survey Research Information Co., Ltd. Tokyo, Japan) was used for the statistical calculations. Statistical analyses included the one-way analysis of variance, followed by Tukey-Kramer and Bonferroni multiple comparisons to compare the maternal characteristics and pregnancy outcomes among the categories. A p-value of <0.05 was considered significant. Logistic regression analysis was used to estimate odds ratios (OR) and 95% confidence intervals (CI), adjusting for confounding variables, including maternal age, maternal body weight gain, and parity.
Approval
The ethics committee of the Hamamatsu University School of Medicine approved all procedures (No. E19-203). Written informed consent was received after an explanation of the study.
Results
Classification of obese pregnant women using three criteria
According to the Japanese classification (prepregnancy BMI ≥25.0 kg/m2), 668 (11%) pregnant women were classified as obese (Table 1A) (Figure 1). According to the IOM, 474 (7.8%) and 194 (3.1%) pregnant women were overweight (prepregnancy BMI 25.0-29.9 kg/m2) and obese (prepregnancy BMI ≥30.0 kg/m2), respectively (Table 1B). According to the ACOG classification, 474 (7.8%), 141 (2.3%), 41 (0.6%), and 12 (0.2%) pregnant women were overweight, obesity class I, obesity class II, and obesity class III (Table 1C), respectively.
Maternal characteristics of the study population according to the Japanese classification
| Underweight | Normal weight | Obese | |
|---|---|---|---|
| Prepregnancy BMI (kg/m2) | <18.5; n = 1,159 (19.1%) | 18.5 to 24.9; n = 4,239 (69.9%) | ≥25; n = 668 (11%) |
| Maternal age (y) | 30.8 ± 4.9** | 31.9 ± 4.99 | 32.7 ± 4.6** |
| Primiparous rate (%) | 57.1** | 50.1 | 40.5** |
| Maternal height (cm) | 158.2 ± 5.4 | 157.9 ± 5.5 | 157.3 ± 5.7 |
| Total gestational weight gain (kg) | 10.5 ± 4.0 | 10.7 ± 11.1 | 7.4 ± 6.1** |
| Gestational week at delivery | 38.3 ± 2.1 | 38.4 ± 2.0 | 38.0 ± 2.6* |
*p <0.05 vs Normal weight; **p <0.01 vs Normal weight.
Maternal characteristics of the study population according to the IOM classification
| Underweight | Normal weight | Overweight | Obese | |
|---|---|---|---|---|
| Prepregnancy BMI (kg/m2) | <18.5; n = 1,159 (19.1%) | 18.5 to 24.9; n = 4,239 (69.9%) | 25 to 29.9; n = 474 (7.8%) | ≥30; n = 194 (3.1%) |
| Maternal age (y) | 30.8 ± 4.9** | 31.9 ± 4.99 | 32.7 ± 5.1** | 32.6 ± 4.6** |
| Primiparous rate (%) | 57.1** | 50.1 | 37.7** | 47.4 |
| Maternal height (cm) | 158.2 ± 5.4 | 157.9 ± 5.5 | 157.4 ± 5.8 | 157.0 ± 5.4 |
| Total gestational weight gain (kg) | 10.5 ± 4.0 | 10.7 ± 11.1 | 8.3 ± 5.9** | 5.3 ± 6.6** |
| Gestational week at delivery | 38.3 ± 2.1 | 38.4 ± 2.0 | 38.1 ± 2.4* | 37.7 ± 2.9** |
*p <0.05 vs Normal weight; **p <0.01 vs Normal weight.
Maternal characteristics of the study population according to the ACOG classification
| Underweight | Normal weight | Overweight | Obese | |||
|---|---|---|---|---|---|---|
| Class I | Class II | Class III | ||||
| Prepregnancy BMI (kg/m2) | <18.5 | 18.5 to 24.9 | 25 to 29.9 | 30 to 34.9 | 35 to 39.9 | ≥40 |
| n = 1,159 (19.1%) | n = 4,239 (69.9%) | n = 474 (7.8%) | n = 141 (2.3%) | n = 41 (0.6%) | n = 12 (0.2%) | |
| Maternal age (y) | 30.8 ± 4.9** | 31.9 ± 4.99 | 32.7 ± 5.1** | 32.7 ± 4.7 | 32.2 ± 4.1 | 32.4 ± 5.4 |
| Primiparous rate (%) | 57.1** | 50.1 | 37.7** | 46.1 | 51.2 | 50 |
| Maternal height (cm) | 158.2 ± 5.4 | 157.9 ± 5.5 | 157.4 ± 5.8 | 157.1 ± 5.1 | 157.3 ± 5.8 | 154.6 ± 7.4 |
| Total gestational weight gain (kg) | 10.5 ± 4.0 | 10.7 ± 11.1 | 8.3 ± 5.9** | 6.5 ± 6.6** | 1.8 ± 6.6** | 2.8 ± 6.5* |
| Gestational week at delivery | 38.3 ± 2.1 | 38.4 ± 2.0 | 38.1 ± 2.4* | 37.7 ± 3.0** | 37.8 ± 2.8 | 37.9 ± 2.3 |
*p <0.05 vs Normal weight; **p <0.01 vs Normal weight.
Perinatal outcomes of obese pregnant women according to the Japanese classification
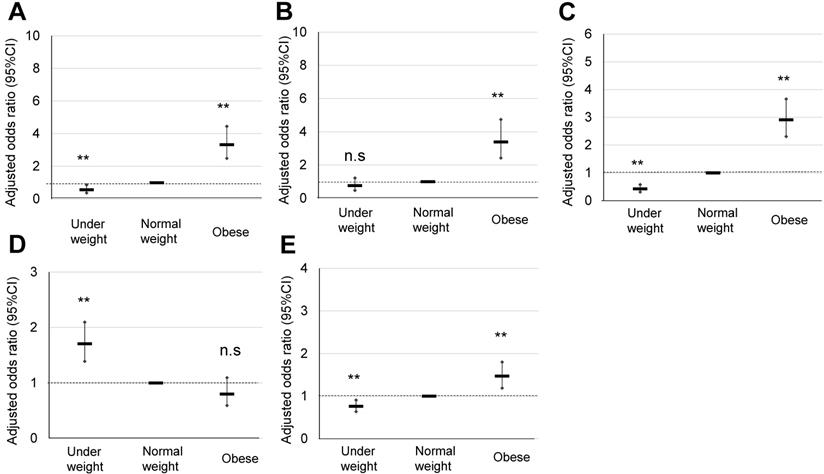
The maternal characteristics of obese pregnant women according to the Japanese classification, and their comparison with those of normal and underweight pregnant women are summarized in Table 1A. Significant OR of HDP (3.32), GDM (3.39), LGA (2.91), and total CS were observed in the obese pregnant women (Table 2A) (Figure 2), for which explanatory variables were maternal age, primiparous rate, and maternal body weight gain (Table 2B).
Comparison of pregnancy outcomes of obese pregnant women according to the Japanese classification
| Underweight | Normal weight | Obesity | |
|---|---|---|---|
| Prepregnancy BMI (kg/m) | <18.5 | 18.5 to 24.9 | ≥25 |
| n = 1,159 (19.1%) | n = 4,239 (69.9%) | n = 668 (11%) | |
| HDP | |||
| % (n) | 2.5% (n = 29) | 4.0% (n = 169) | 12.1% (n = 81) |
| Adjusted OR (95% CI) | 0.57** (0.37-0.86) | 1 | 3.32** (2.48-4.45) |
| GDM | |||
| % (n) | 1.9% (n = 22) | 2.6% (n = 111) | 11.2% (n = 75) |
| Adjusted OR (95% CI) | 0.76 (0.48-1.22) | 1 | 3.39** (2.42-4.74) |
| LGA | |||
| % (n) | 4.4% (n = 51) | 9.5% (n = 402) | 20.8% (n = 139) |
| Adjusted OR (95% CI) | 0.43** (0.32-0.58) | 1 | 2.91** (2.31-3.66) |
| SGA | |||
| % (n) | 13.5% (n = 156) | 9.0% (n = 381) | 4.6% (n = 31) |
| Adjusted OR (95% CI) | 1.71** (1.39-2.10) | 1 | 0.81 (0.59-1.09) |
| Macrosomia | |||
| % (n) | 0.2% (n = 2) | 0.7% (n = 30) | 2.5% (n = 17) |
| Adjusted OR (95% CI) | 0.23* (0.05-0.96) | 1 | 4.01** (2.18-7.37) |
| Spontaneous preterm birth | |||
| % (n) | 5.8% (n = 64) | 2.5% (n = 100) | 3.4% (n = 23) |
| Adjusted OR (95% CI) | 2.33** (1.68-3.23) | 1 | 0.81 (0.48-1.40) |
| Post-term birth | |||
| % (n) | 5.6% (n = 65) | 8.0% (n = 339) | 7.2% (n = 48) |
| Adjusted OR (95% CI) | 0.62** (0.47-0.82) | 1 | 1.01 (0.73-1.38) |
| PPH (CS) | |||
| % (n) | 1.7% (n = 4) | 2% (n = 21) | 0.7% (n = 5) |
| Adjusted OR (95% CI) | 0.85 (0.29-2.50) | 1 | 1.04 (0.37-2.91) |
| PPH (VD) | |||
| % (n) | 12.1% (n = 112) | 15.8% (n = 503) | 12.7% (n = 85) |
| Adjusted OR (95% CI) | 0.80 (0.64-1.00) | 1 | 1.45 (1.11-1.91) |
| Neonatal acidosis | |||
| % (n) | 7.1% (n = 81) | 5.5% (n = 227) | 5.1% (n = 34) |
| Adjusted OR (95% CI) | 1.31* (1.01-1.72) | 1 | 0.85 (0.57-1.27) |
| Neonatal asphyxia | |||
| % (n) | 2.8% (n = 32) | 2.2% (n = 93) | 3.0% (n = 20) |
| Adjusted OR (95% CI) | 1.32 (0.88-2.00) | 1 | 1.06 (0.47-2.39) |
| Total CS | |||
| % (n) | 20% (n = 229) | 24.6% (n = 1,042) | 34.6% (n = 231) |
| Adjusted OR (95% CI) | 0.76** (0.64-0.91) | 1 | 1.47** (1.19-1.80) |
*p <0.05 vs Normal weight; **p <0.01 vs Normal weight.
Explanatory variables of HDP, GDM, LGA, SGA, and cesarean delivery in obese Japanese pregnant women according to the Japanese classification
| Obesity comorbidity | OR | 95% CI | P-value |
|---|---|---|---|
| HDP | |||
| Maternal age (y) | 1.05 | 1.03-1.08 | <0.001 |
| Primiparous rate (%) | 0.47 | 0.36-0.61 | <0.001 |
| Body weight gain (kg) | 1.00 | 1.00-1.01 | 0.516 |
| GDM | |||
| Maternal age (y) | 1.09 | 1.06-1.13 | <0.001 |
| Primiparous rate (%) | 0.95 | 0.70-1.29 | 0.740 |
| Body weight gain (kg) | 0.93 | 0.90-0.96 | <0.001 |
| LGA | |||
| Maternal age (y) | 1.02 | 1.00-1.04 | 0.042 |
| Primiparous rate (%) | 0.73 | 0.60-0.89 | <0.001 |
| Body weight gain (kg) | 1.01 | 1.00-1.03 | 0.158 |
| SGA | |||
| Maternal age (y) | 1.00 | 0.98-1.02 | 0.840 |
| Primiparous rate (%) | 1.06 | 0.87-1.30 | 0.552 |
| Body weight gain (kg) | 0.95 | 0.93-0.98 | <0.001 |
| Cesarean delivery | |||
| Maternal age (y) | 1.08 | 1.06-1.09 | <0.001 |
| Primiparous rate (%) | 0.89 | 0.77-1.04 | 0.137 |
| Body weight gain (kg) | 1.01 | 1.00-1.02 | 0.197 |
Comparison of pregnancy outcomes of obese pregnant women according to the Japanese classification. A, B, C, D, and E indicate HDP, GDM, LGA, SGA, and cesarean delivery rate, respectively, **; p <0.01.
Perinatal outcomes of obese pregnant women according to the IOM classification
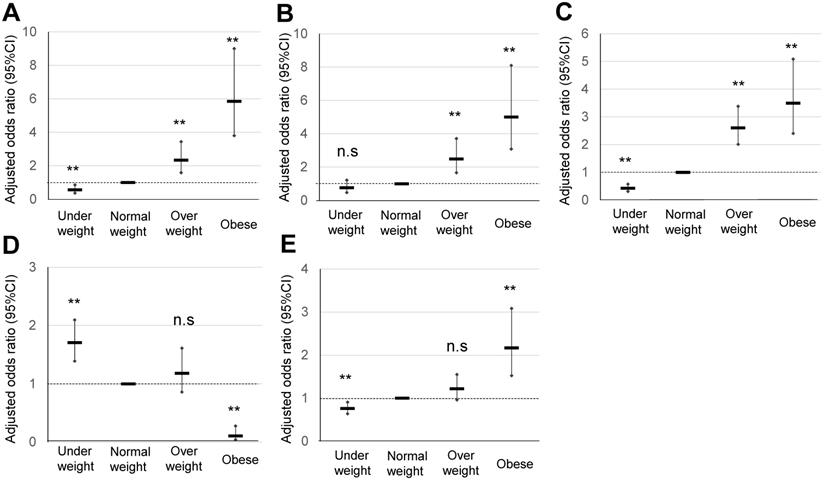
The maternal characteristics of obese pregnant women according to the IOM classification, and their comparison with those of normal weight and overweight pregnant women are summarized in Table 1B. The significant OR of HDP in normal weight and overweight pregnant women was 1.23 and 5.85, respectively (Table 3A) (Figure 3). The significant OR of GDM in normal weight and overweight pregnant women was 2.48 and 5.00, respectively, whereas that of macrosomia in normal weight and overweight pregnant women was 2.86 and 6.95, respectively. A significant OR of PPH in CS (3.65), PPH in VD (1.76), and total CS (2.17) was observed in obese pregnant women, but not in overweight pregnant women. Explanatory variables of maternal age, primiparous rate, and maternal body weight gain are shown in Table 3B.
Comparison of pregnancy outcomes in obese pregnant women according to the IOM classification. A, B, C, D, and E indicate HDP, GDM, LGA, SGA, and cesarean delivery rate, respectively, **p <0.01.
Comparison of pregnancy outcomes of obese pregnant women according to the IOM classification
| Underweight | Normal weight | Overweight | Obesity | |
|---|---|---|---|---|
| Prepregnancy BMI (kg/m) | <18.5 | 18.5 to 24.9 | 25 to 29.9 | ≥30 |
| n = 1,159 (19.1%) | n = 4,239 (69.9%) | n = 474 (7.8%) | n = 194 (3.1%) | |
| HDP | ||||
| % (n) | 2.5% (n = 29) | 4.0% (n = 169) | 8.4% (n = 40) | 21.1% (n = 41) |
| Adjusted OR (95% CI) | 0.57** (0.37-0.86) | 1 | 1.23** (1.58-3.44) | 5.85** (3.80-9.00) |
| GDM | ||||
| % (n) | 1.9% (n = 22) | 2.6% (n = 111) | 8.5% (n = 40) | 18% (n = 35) |
| Adjusted OR (95% CI) | 0.76 (0.48-1.22) | 1 | 2.48** (1.67-3.71) | 5.00** (3.09-8.11) |
| LGA | ||||
| % (n) | 4.4% (n = 51) | 9.5% (n = 402) | 19.7% (n = 93) | 23.7% (n = 46) |
| Adjusted OR (95% CI) | 0.43** (0.32-0.58) | 1 | 2.61** (2.01-3.38) | 3.50** (2.40-5.09) |
| SGA | ||||
| % (n) | 13.5% (n = 156) | 9.0% (n = 381) | 5.5% (n = 26) | 2.6% (n = 5) |
| Adjusted OR (95% CI) | 1.71** (1.39-2.10) | 1 | 1.18 (0.87-1.61) | 0.11** (0.04-0.28) |
| Macrosomia | ||||
| % (n) | 0.2% (n = 2) | 0.7% (n = 30) | 1.9% (n = 9) | 4.1% (n = 8) |
| Adjusted OR (95% CI) | 0.23* (0.05-0.96) | 1 | 2.86** (1.33-6.15) | 6.95** (3.11-15.53) |
| Spontaneous preterm birth | ||||
| % (n) | 5.8% (n = 64) | 2.5% (n = 100) | 4.1% (n = 18) | 2.6% (n = 5) |
| Adjusted OR (95% CI) | 2.33** (1.68-3.23) | 1 | 0.96 (0.54-1.70) | 0.31 (0.10-0.96) |
| Post-term birth | ||||
| % (n) | 5.6% (n = 65) | 8.0% (n = 339) | 7.6% (n = 36) | 6.2% (n = 12) |
| Adjusted OR (95% CI) | 0.62** (0.47-0.82) | 1 | 0.94 (0.66-1.34) | 0.44 (0.49-1.56) |
| PPH (CS) | ||||
| % (n) | 1.7% (n = 4) | 2% (n = 21) | 0% (n = 0) | 12.4% (n = 5) |
| Adjusted OR (95% CI) | 0.85 (0.29-2.50) | 1 | - | 3.65* (1.24-10.79) |
| PPH (VD) | ||||
| % (n) | 12.1% (n = 112) | 15.8% (n = 503) | 18.9% (n = 61) | 25.9% (n = 24) |
| Adjusted OR (95% CI) | 0.80 (0.64-1.00) | 1 | 1.35 (0.99-1.84) | 1.76* (1.07-2.87) |
| Neonatal acidosis | ||||
| % (n) | 7.1% (n = 81) | 5.5% (n = 227) | 5.9% (n = 27) | 3.6% (n = 7) |
| Adjusted OR (95% CI) | 1.31* (1.01-1.72) | 1 | 0.98 (0.63-1.50) | 0.57 (0.27-1.24) |
| Neonatal asphyxia | ||||
| % (n) | 2.8% (n = 32) | 2.2% (n = 93) | 3.0% (n = 14) | 3.1% (n = 6) |
| Adjusted OR (95% CI) | 1.32 (0.88-2.00) | 1 | 1.35 (0.76-2.38) | 1.06 (0.47-2.39) |
| Total CS | ||||
| % (n) | 20% (n = 229) | 24.6% (n = 1042) | 30.2% (n = 143) | 45.3% (n = 88) |
| Adjusted OR (95% CI) | 0.76** (0.64-0.91) | 1 | 1.23 (0.97-1.56) | 2.17** (1.52-3.08) |
*p <0.05 vs Normal weight; **p <0.01 vs Normal weight.
Explanatory variables of HDP, GDM, LGA, SGA, and cesarean delivery in obese Japanese pregnant women according to the IOM classification
| OR | 95% CI | p value | |
|---|---|---|---|
| HDP | |||
| Overweight | |||
| Maternal age (y) | 1.04 | 1.01-1.07 | 0.005 |
| Primiparous rate (%) | 0.40 | 0.29-0.54 | <0.001 |
| Body weight gain (kg) | 1.00 | 1.00-1.01 | 0.191 |
| Obesity | |||
| Maternal age (y) | 1.03 | 1.00-1.06 | 0.057 |
| Primiparous rate (%) | 0.41 | 0.30-0.57 | <0.001 |
| Body weight gain (kg) | 1.00 | 1.00-1.01 | 0.153 |
| GDM | |||
| Overweight | |||
| Maternal age (y) | 1.01 | 1.05-1.13 | <0.001 |
| Primiparous rate (%) | 1.13 | 0.81-1.59 | 0.474 |
| Body weight gain (kg) | 0.92 | 0.89-0.95 | <0.001 |
| Obesity | |||
| Maternal age (y) | 1.01 | 1.06-1.14 | <0.001 |
| Primiparous rate (%) | 0.88 | 0.62-1.25 | 0.479 |
| Body weight gain (kg) | 0.92 | 0.89-0.95 | <0.001 |
| LGA | |||
| Overweight | |||
| Maternal age (y) | 1.02 | 1.00-1.04 | 0.078 |
| Primiparous rate (%) | 0.70 | 0.58-0.86 | <0.001 |
| Body weight gain (kg) | 1.01 | 1.00-1.02 | 0.201 |
| Obesity | |||
| Maternal age (y) | 1.01 | 0.99-1.04 | 0.161 |
| Primiparous rate (%) | 0.78 | 0.64-0.96 | 0.020 |
| Body weight gain (kg) | 1.01 | 1.00-1.02 | 0.216 |
| SGA | |||
| Overweight | |||
| Maternal age (y) | 1.00 | 0.98-1.02 | 0.793 |
| Primiparous rate (%) | 1.07 | 0.87-1.32 | 0.494 |
| Body weight gain (kg) | 0.95 | 0.93-0.97 | <0.001 |
| Obesity | |||
| Maternal age (y) | 1.00 | 0.97-1.02 | 0.720 |
| Primiparous rate (%) | 1.08 | 0.86-1.34 | 0.512 |
| Body weight gain (kg) | 0.92 | 0.90-0.95 | <0.001 |
| Cesarean delivery | |||
| Overweight | |||
| Maternal age (y) | 1.08 | 1.06-1.09 | <0.001 |
| Primiparous rate (%) | 0.88 | 0.76-1.03 | 0.111 |
| Body weight gain (kg) | 1.01 | 0.99-1.03 | 0.196 |
| Obesity | |||
| Maternal age (y) | 1.07 | 1.05-1.09 | <0.001 |
| Primiparous rate (%) | 0.92 | 0.78-1.07 | 0.274 |
| Body weight gain (kg) | 1.01 | 0.99-1.02 | 0.335 |
Perinatal outcomes of obese pregnant women according to the ACOG classification
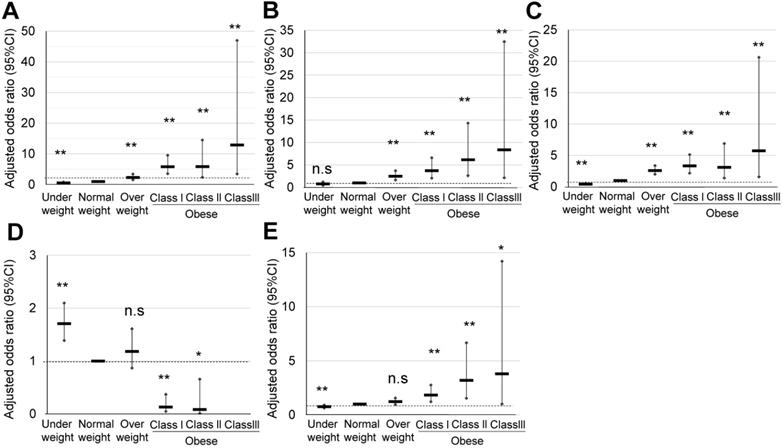
The characteristics of maternal obesity class I, II, and III pregnant women defined according to the ACOG classification, and their comparison with those of normal weight and overweight pregnant women are summarized in Table 1C. In obesity class III pregnant women, a significantly high OR was observed in HDP (12.89), GDM (8.37), and LGA (5.74) (Table 4A) (Figure 4). However, the significant OR of HDP (5.91) and LGA (3.12) in the obesity class II pregnant women was similar to that observed for the obesity class I pregnant women, HDP (5.81), and LGA (3.35). Explanatory variables of maternal age, primiparous rate, and maternal body weight gain are shown in Table 4B.
Comparison of pregnancy outcomes of obese pregnant women according to the ACOG classification. A, B, C, D, and E indicate HDP, GDM, LGA, SGA, and cesarean delivery rate, respectively, *; p <0.05, **; p <0.01.
Comparison of pregnancy outcomes of obese pregnant women according to the ACOG classification
| Underweight | Normal weight | Overweight | Obesity | |||
|---|---|---|---|---|---|---|
| Class I | Class II | Class III | ||||
| Prepregnancy BMI (kg/m) | <18.5 | 18.5 to 24.9 | 25 to 29.9 | 30 to 34.9 | 35 to 39.9 | ≥40 |
| n = 1,159 (19.1%) | n = 4,239 (69.9%) | n = 474 (7.8%) | n = 141 (2.3%) | n = 41 (0.6%) | n = 12 (0.2%) | |
| HDP | ||||||
| % (n) | 2.5% (n = 29) | 4.0% (n = 169) | 8.4% (n = 40) | 20.6% (n = 29) | 19.5% (n = 8) | 33.3% (n = 4) |
| Adjusted OR (95% CI) | 0.57** (0.37-0.86) | 1 | 1.23** (1.58-3.44) | 5.81** (3.58-9.52) | 5.91** (2.41-14.5) | 12.89** (3.53-47.03) |
| GDM | ||||||
| % (n) | 1.9% (n = 22) | 2.6% (n = 111) | 8.5% (n = 40) | 13.5% (n = 19) | 29.3% (n = 12) | 33.3% (n = 4) |
| Adjusted OR (95% CI) | 0.76 (0.48-1.22) | 1 | 2.48** (1.67-3.71) | 3.71** (2.09-6.58) | 6.14** (2.64-14.3) | 8.37** (2.16-32.48) |
| LGA | ||||||
| % (n) | 4.4% (n = 51) | 9.5% (n = 402) | 19.7% (n = 93) | 23.4% (n = 33) | 22.0% (n = 9) | 33.3% (n = 4) |
| Adjusted OR (95% CI) | 0.43** (0.32-0.58) | 1 | 2.61** (2.01-3.38) | 3.35** (2.19-5.12) | 3.12** (1.41-6.88) | 5.74** (1.60-20.6) |
| SGA | ||||||
| % (n) | 13.5% (n = 156) | 9.0% (n = 381) | 5.5% (n = 26) | 2.8% (n = 4) | 2.4% (n = 1) | 0% (n = 0) |
| Adjusted OR (95% CI) | 1.71** (1.39-2.10) | 1 | 1.18 (0.87-1.61) | 0.13** (0.05-0.37) | 0.08* (0.01-0.65) | - |
| Macrosomia | ||||||
| % (n) | 0.2% (n = 2) | 0.7% (n = 30) | 1.9% (n = 9) | 5.0% (n = 7) | 2.4% (n = 1) | 0% (n = 0) |
| Adjusted OR (95% CI) | 0.23* (0.05-0.96) | 1 | 2.86** (1.33-6.15) | 8.91** (3.75-21.14) | 3.03 (0.35-26.0) | - |
| Spontaneous preterm birth | ||||||
| % (n) | 5.8% (n = 64) | 2.5% (n = 100) | 4.1% (n = 18) | 2.5% (n = 4) | 2.8% (n = 1) | 0% (n = 0) |
| Adjusted OR (95% CI) | 2.33** (1.68-3.23) | 1 | 0.96 (0.54-1.70) | 0.329 (0.09-1.18) | 0.147 (0.02-1.32) | - |
| Post-term birth | ||||||
| % (n) | 5.6% (n = 65) | 8.0% (n = 339) | 7.6% (n = 36) | 6.4% (n = 9) | 7.3% (n = 3) | 0% (n = 0) |
| Adjusted OR (95% CI) | 2.33** (1.68-3.23) | 1 | 0.94 (0.66-1.34) | 0.78 (0.39-1.55) | 0.90 (0.28-2.94) | - |
| PPH (CS) | ||||||
| % (n) | 1.7% (n = 4) | 2% (n = 21) | 0% (n = 0) | 6.7% (n = 4) | 4.8% (n = 1) | 0% (n = 0) |
| Adjusted OR (95% CI) | 0.85 (0.29-2.50) | 1 | - | 4.05* (1.21-13.62) | -- | - |
| PPH (VD) | ||||||
| % (n) | 12.1% (n = 112) | 15.8% (n = 503) | 18.9% (n = 61) | 25.9% (n = 21) | 15% (n = 3) | 0% (n = 0) |
| Adjusted OR (95% CI) | 0.80 (0.64-1.00) | 1 | 1.35 (0.99-1.84) | 1.98* (1.16-3.36) | 0.98 (0.26-3.65) | - |
| Neonatal acidosis | ||||||
| % (n) | 7.1% (n = 81) | 5.5% (n = 227) | 5.9% (n = 27) | 4.4% (n = 6) | 2.5% (n = 1) | 0% (n = 0) |
| Adjusted OR (95% CI) | 1.31* (1.01-1.72) | 1 | 0.98 (0.63-1.50) | 0.64 (0.27-1.51) | 0.27 (0.04-2.10) | |
| Neonatal asphyxia | ||||||
| % (n) | 2.8% (n = 32) | 2.2% (n = 93) | 3.0% (n = 14) | 2.8% (n = 4) | 4.9% (n = 2) | 0% (n = 0) |
| Adjusted OR (95% CI) | 1.32 (0.88-2.00) | 1 | 1.35 (0.76-2.38) | 1.29 (0.47-3.55) | 2.26 (0.54-9.50) | - |
| Total CS | ||||||
| % (n) | 20% (n = 229) | 24.6% (n = 1,042) | 30.2% (n = 143) | 42.6% (n = 60) | 20% (n = 21) | 58% (n = 7) |
| Adjusted OR (95% CI) | 0.76** (0.64-0.91) | 1 | 1.23 (0.97-1.56) | 1.84** (1.22-2.76) | 3.20** (1.54-6.66) | 3.80* (1.02-14.2) |
Explanatory variables of HDP, GDM, LGA, SGA, and cesarean delivery in obese Japanese pregnant women according to the ACOG classification
| OR | 95% CI | p value | |
|---|---|---|---|
| HDP | |||
| Overweight | |||
| Maternal age (y) | 1.04 | 1.01-1.07 | 0.005 |
| Primiparous rate (%) | 0.40 | 0.29-0.54 | <0.001 |
| Body weight gain (kg) | 1.00 | 1.00-1.01 | 0.191 |
| Obesity class I | |||
| Maternal age (y) | 1.04 | 1.01-1.07 | 0.020 |
| Primiparous rate (%) | 0.39 | 0.29-0.55 | <0.001 |
| Body weight gain (kg) | 1.00 | 1.00-1.01 | 0.175 |
| Obesity class II | |||
| Maternal age (y) | 1.03 | 1.00-1.06 | 0.056 |
| Primiparous rate (%) | 0.40 | 0.28-0.56 | <0.001 |
| Body weight gain (kg) | 1.00 | 1.00-1.01 | 0.166 |
| Obesity class III | |||
| Maternal age (y) | 1.04 | 1.01-1.07 | 0.020 |
| Primiparous rate (%) | 0.38 | 0.27-0.53 | <0.001 |
| Body weight gain (kg) | 1.00 | 1.00-1.01 | 0.197 |
| GDM | |||
| Overweight | |||
| Maternal age (y) | 1.01 | 1.05-1.13 | <0.001 |
| Primiparous rate (%) | 1.13 | 0.81-1.59 | 0.474 |
| Body weight gain (kg) | 0.92 | 0.89-0.95 | <0.001 |
| Obesity class I | |||
| Maternal age (y) | 1.09 | 1.05-1.14 | <0.001 |
| Primiparous rate (%) | 0.94 | 0.66-1.35 | 0.738 |
| Body weight gain (kg) | 0.91 | 0.88-0.95 | <0.001 |
| Obesity class II | |||
| Maternal age (y) | 1.09 | 1.05-1.14 | <0.001 |
| Primiparous rate (%) | 0.97 | 0.67-1.40 | 0.863 |
| Body weight gain (kg) | 0.90 | 0.87-0.94 | <0.001 |
| Obesity class III | |||
| Maternal age (y) | 1.09 | 1.05-1.14 | <0.001 |
| Primiparous rate (%) | 1.07 | 0.73-1.58 | 0.717 |
| Body weight gain (kg) | 0.88 | 0.85-0.92 | <0.001 |
| LGA | |||
| Overweight | |||
| Maternal age (y) | 1.02 | 1.00-1.04 | 0.078 |
| Primiparous rate (%) | 0.70 | 0.58-0.86 | <0.001 |
| Body weight gain (kg) | 1.01 | 1.00-1.02 | 0.201 |
| Obesity class I | |||
| Maternal age (y) | 1.01 | 0.99-1.03 | 0.252 |
| Primiparous rate (%) | 0.78 | 0.64-0.96 | 0.020 |
| Body weight gain (kg) | 1.01 | 1.00-1.02 | 0.207 |
| Obesity class II | |||
| Maternal age (y) | 1.02 | 0.99-1.04 | 0.154 |
| Primiparous rate (%) | 0.76 | 0.61-0.94 | 0.011 |
| Body weight gain (kg) | 1.01 | 1.00-1.01 | 0.177 |
| Obesity class III | |||
| Maternal age (y) | 1.01 | 0.99-1.03 | 0.288 |
| Primiparous rate (%) | 0.75 | 0.61-0.93 | 0.009 |
| Body weight gain (kg) | 1.00 | 1.00-1.01 | 0.180 |
| SGA | |||
| Overweight | |||
| Maternal age (y) | 1.00 | 0.98-1.02 | 0.793 |
| Primiparous rate (%) | 1.07 | 0.87-1.32 | 0.494 |
| Body weight gain (kg) | 0.95 | 0.93-0.97 | <0.001 |
| Obesity class I | |||
| Maternal age (y) | 1.00 | 0.97-1.02 | 0.728 |
| Primiparous rate (%) | 1.08 | 0.87-1.35 | 0.477 |
| Body weight gain (kg) | 0.92 | 0.90-0.95 | <0.001 |
| Obesity class II | |||
| Maternal age (y) | 1.00 | 0.98-1.02 | 0.777 |
| Primiparous rate (%) | 1.09 | 0.88-1.37 | 0.428 |
| Body weight gain (kg) | 0.93 | 0.90-0.95 | <0.001 |
| Obesity class III | |||
| Maternal age (y) | - | - | - |
| Primiparous rate (%) | - | - | - |
| Body weight gain (kg) | - | - | - |
| Cesarean delivery | |||
| Overweight | |||
| Maternal age (y) | 1.08 | 1.06-1.09 | <0.001 |
| Primiparous rate (%) | 0.88 | 0.76-1.03 | 0.111 |
| Body weight gain (kg) | 1.01 | 0.99-1.03 | 0.196 |
| Obesity class I | |||
| Maternal age (y) | 1.07 | 1.05-1.09 | <0.001 |
| Primiparous rate (%) | 0.92 | 0.78-1.07 | 0.289 |
| Body weight gain (kg) | 1.01 | 0.99-1.02 | 0.305 |
| Obesity class II | |||
| Maternal age (y) | 1.07 | 1.05-1.09 | <0.001 |
| Primiparous rate (%) | 0.91 | 0.77-1.06 | 0.224 |
| Body weight gain (kg) | 1.01 | 0.99-1.02 | 0.370 |
| Obesity class III | |||
| Maternal age (y) | 1.07 | 1.05-1.09 | <0.001 |
| Primiparous rate (%) | 0.90 | 0.76-1.05 | 0.189 |
| Body weight gain (kg) | 1.00 | 0.99-1.01 | 0.383 |
Discussion
In the present study, we simultaneously assessed pregnancy outcomes in obese pregnant women using the classification of the Japanese Ministry of Health, Labour and Welfare [2] and JASSO [6], i.e., prepregnancy BMI ≥25 kg/m2. In total, 668 (11%) pregnant women were classified as obese, and a significant OR was observed for HDP (3.32), GDM (3.39), LGA (2.91), and macrosomia (4.01) (Table 2A) (Figure 2). This Japanese classification is usually used to make a recommendation of body weight gain during pregnancy [2, 6, 7]; however, the contribution of weight gain in pregnancy as an explanatory valuable was low, although sometimes significant (Table 2B). Therefore, this Japanese classification may be effective to identify approximately 10% of Japanese obese pregnant women with an OR of around 3 for the risk of representative complications of obesity in pregnancy such as HDP, GDM, LGA, and macrosomia.
According to the IOM classification system, 474 (7.8%) and 194 (3.1%) pregnant women were classified as overweight (prepregnancy BMI 25.0-29.9 kg/m2) and obese (prepregnancy BMI ≥30 kg/m2), respectively (Table 1B) (Figure 1). In Japan, 3.4% of women with a BMI ≥30 kg/m2 were in their 30s [14], which are similar to the findings of this study. Specifically, a high OR was observed in obese pregnant women for HDP (5.85) and GDM (5.0). A significant, but moderately high, OR was observed in PPH for VD (1.76) and total CS (2.17) (Table 3A) (Figure 3). This IOM classification is usually used to make a recommendation of body weight gain in pregnancy in the USA [3]; however, the contribution of weight gain in pregnancy as an explanatory valuable was low, although sometimes significant (Table 3B). Therefore, this IOM classification may be effective to identify approximately 3% of Japanese obese pregnant women with an OR of around 5 for risks of GDM and HDP.
We finally categorized 474 (7.8%) pregnant women as overweight (prepregnancy BMI 25.0-29.9 kg/m2), 141 (2.3%) as obesity class I (prepregnancy BMI 30.0-34.9 kg/m2), 41 (0.6%) as obesity class II (prepregnancy BMI 35.0-39.9 kg/m2; n = 41), and 12 (0.2%) as obesity class III (prepregnancy BMI ≥40 kg/m2) according to the classification of ACOG (Table 1C) (Figure 1). In obesity class III, a significant and specifically high OR was observed for HDP (12.89), GDM (8.37), and LGA (5.74) (Table 4A) (Figure 4); however, only 12 pregnant women were included among 6,066 (Figure 1). Step-wise increases in the OR for HDP, GDM, and LGA were noted. The contribution of weight gain in pregnancy as an explanatory valuable was low, although sometimes significant (Table 4B). As the rate of obese pregnant women in Japan is lower than that in Western countries [14, 15], the ACOG criteria are applicable to relatively limited numbers of pregnant women in the Japanese society.
Prepregnant obesity is highly associated with perinatal complications. In the present study, three different prepregnancy BMI classification systems demonstrated marked differences in the pregnancy outcome profile among categorized groups of obesity. In this view, all three classification systems were applicable to Japanese pregnant women, although further assessment of obesity classes II and III is necessary because of the small numbers of subjects. As for the risk of SGA, the criteria of IOM and ACOG showed significant odds ratios of 0.11(IOM), 0.13 (ACOG; Class I), and 0.08 (ACOG; Class II), but no statistical significance by the criterion of JASSO (odds ratio of 0.81), which suggested possible better risk identification of the criteria of IOM and ACOG. On the other hand, all odds ratios of spontaneous preterm labor by the criteria of JASSO, IOM, and ACOG, were less than one and were of no statistical significance.
In Western countries, the population of obese pregnant women is higher than that in Japan, and there are many trials of interventions such as UK Pregnancy Better Eating and Activity Trial Intervention (UPBEAT) consortium [16], or Treatment of Obese Pregnant Women (TOP) study [17], suggesting that interventions for obese pregnant women are not always successful, especially in cases of extreme obesity like class II and III. Indeed, in the present study, in each of the three classification systems, the contribution of weight gain in pregnancy as an explanatory valuable was low. Therefore, it is important to use the prepregnancy BMI categorization for risk assessment and/or expectation for perinatal complications in obese pregnant women.
The current Japanese classification may be useful for screening of around 10% of obese pregnant women who are expected to be at a risk of GDM and HDP with an OR of around 3 (Table 2A) (Figure 2). It may be useful for conventional screening among low-risk pregnant women. The obesity classification of IOM (prepregnancy BMI ≥30 kg/m2 can identify obese pregnant women with an expected risk of GDM and HDP with an OR of around 5, which will enable identification of more high-risk pregnancies (Table 3A) (Figure 3). On the other hand, overweight pregnant women according to the IOM classification (prepregnancy BMI 25.0-29.9 kg/m2) had a significant but low OR of 1.23 for the risk of HDP (Table 3A) (Figure 3), which may be useful to exclude the high-risk population of HDP.
Among the three classifications, the definition of underweight is the same (prepregnancy BMI <18.5 kg/m2). The theme of this study was comparison of three classification systems of prepregnancy body mass index with perinatal outcomes in Japanese obese pregnant women. In this study, the low risk of HDP, GDM, LGA, and cesarean delivery, and high risk of SGA observed in underweight pregnant women were the same as in past reports [8], [18]. Therefore in this study, we did not examine underweight pregnant women in detail.
The present study has some limitations. First, we carried out a retrospective analysis of pregnancy outcomes at a single center, which may not exactly represent the entire population of Japanese pregnant women. The incidences of Macrosomia and PPH were infrequent events in our study as other studies in Japan. In two major report based on JSOG nationwide database, the incidence of macrosomia were 0.76% [8] and 0.77% [9], approximately similar to the results of our observation (0.81%). Fukami reported that the incidence of PPH-VD was 8.7% at single tertiary perinatal medical center in Japan [19], which was roughly identical to that of our observation (11.5%). It is also noted that the current single center study is based on consistent clinical practice and relatively similar reginal lifestyles of the subjects. Therefore, it will reinforce the findings obtained by analysis of large-scale registry data across Japan [8, 9]. Second, the data regarding the exact ethnicities of the subjects were not available. Third, we assessed the gestational weight gain as the change over the entire pregnancy period, and not as weekly weight gain. Fourth, dietary intervention was usually provided to obese pregnant women by dieticians, which may have affected the pregnancy outcome. Fifth the numbers of Class I, Class II Class III obesity by ACOG criteria were 141(2.3%), 41 (0.6%) and 12 (0.2%) and wide range of 95% CI were frequently observed in the analyses; therefore, more large-scale study is necessary to assess especially ACOG criteria.
In conclusion, the present data suggest that the two classification systems, the Japanese and IOM, are valid among Japanese pregnant women. However, the former is useful for screening obesity among low-risk pregnancies and the latter is applicable to identify high-risk pregnancies. The ACOG classification may be useful for step-wise assessments of the specific risks of HDP and GDM in Japanese pregnant women; however, further investigation is necessary because the numbers of class II and III obese pregnant women were small in the present study.
Acknowledgements
Funding
This study was supported in part by MEXT KAKENHI (Grant-in-Aid for Scientific Research) Grant Number JP16K20185.
Competing Interests
The authors have declared that no competing interest exists.
References
1. The Examination Committee of Criteria for 'Obesity Disease' in Japan, Japan Society for the Study of Obesity. New criteria for 'obesity disease' in Japan. Circ J. 2002;66:987-92 doi: 10.1253/circj.66.987
2. The Ministry of Health Labour and Welfare. “Healthy Families (Sukoyaka. Oyako) 21”. http://rhino.med.yamanashi.ac.jp/sukoyaka/pdf/ninpu04.pdf.
3. Rasmussen KM, Yaktine AL, Eds. Weight gain during pregnancy: reexamining the guidelines. Washington (DC), US: National Academies Press. 2009
4. ACOG Practice Bulletin No 156. Obesity in pregnancy. Obstet Gynecol. 2015;126:e112-6 doi: 10.1097/aog.0000000000001211
5. World Health Organization. Obesity: preventing and managing the global epidemic Report of a WHO Consultation. (WHO Technical Report Series 894) [cited. 2019 December]. http://www.who.int/nutrition/publications/obesity/WHO_TRS_894/en/
6. Japan Society for the study of Obesity (JASSO) editor. Guidelines for the management of obesity disease. 2016. Obesity in Japanese women. Lifescience publisher. 2016:90-1
7. Japan Society of Obstetrics and Gynecology (JSOG) and Japan Association of Obstetricians and Gynecologists (JAOG). Guidelines for obstetrical practice in Japan. CQ010; what guidance regarding maternal body composition and weight gain during pregnancy should be provided?. 2017:53-7
8. Enomoto K, Aoki S, Toma R. et al. Pregnancy outcomes based on pre-pregnancy body mass index in Japanese women. PLoS ONE. 2016;11:e0157081. doi: 10.1371/journal.pone.0157081
9. Nomura K, Nagashima K, Suzuki S, Itoh H. Application of Japanese guidelines for gestational weight gain to multiple pregnancy outcomes and its optimal range in 101,336 Japanese women. Sci Rep. 2019;9:17310. doi: 10.1038/s41598-019-53809-8
10. Watanabe K, Matsubara K, Nakamoto O. et al. Outline of the new definition and classification of “Hypertensive Disorders of Pregnancy (HDP)”; a revised JSSHP statement of 2005. Hypertens Res Preg. 2018;6:33-7 doi: 10.14390/jsshp.HRP2018-014
11. Itabashi K, Miura F, Uehara R. et al. New Japanese neonatal anthropometric charts for gestational age at birth. Pediatr Int. 2014;56:702-8 doi: 10.1111/ped.12331
12. Takeda S, Makino S, Takeda J. et al. Japanese clinical practice guide for critical obstetrical hemorrhage (2017 revision). J Obstet Gynaecol Res. 2017;43:1517-21 doi: 10.1111/jog.13417
13. Japan Society of Obstetrics and Gynecology (JSOG) and Japan Association of Obstetricians and Gynecologists (JAOG). Guidelines for obstetrical practice in Japan. CQ009; how should the expected date of confinement (EDC) be determined?. 2017:48-52
14. The Ministry of Health Labour and Welfare. National Health and Nutrition Survey; 2017. https://www.mhlw.go.jp/content/000451760.pdf.
15. Flegal KM, Kruszon-Moran D, Carroll MD. et al. Trends in obesity among adults in the United States, 2005 to 2014. JAMA. 2016;315:2284-91 doi: 10.1001/jama.2016.6458
16. Poston L, Bell R, Briley AL. et al. Programme grants for applied research. Improving pregnancy outcome in obese women: the UK pregnancies better eating and activity randomised controlled trial. Southampton (UK): NIHR Journals. Library. 2017
17. Renault KM, Norgaard K, Nilas L. et al. The Treatment of Obese Pregnant women (TOP) study: a randomized controlled trial of the effect of physical activity intervention assessed by pedometer with or without dietary intervention in obese pregnant women. Am J Obstet Gynecol. 2014;210:134.e1-9 doi: 404 10.1016/j.ajog.2013.09.029
18. Voerman E, Santos S, Inskip H. et al. Association of gestational weight gain with 406 adverse maternal and infant outcomes. JAMA. 2019;321:1702-5
19. Fukami T, Koga H, Goto M. et al. Incidence and risk factors for postpartum hemorrhage among transvaginal deliveries at a tertiary perinatal medical facility in Japan. PLoS ONE. 2019;14:e0208873. doi.org/10.1371/journal.pone.0208873
Author contact
![]() Corresponding author: Yukiko Kohmura-Kobayashi, Department of Obstetrics and Gynecology, Hamamatsu University School of Medicine, Hamamatsu, Shizuoka, Japan. Tel.:+81-53-435-2309; Fax: +81-53-435-2308; E-mail: yukkiac.jp.
Corresponding author: Yukiko Kohmura-Kobayashi, Department of Obstetrics and Gynecology, Hamamatsu University School of Medicine, Hamamatsu, Shizuoka, Japan. Tel.:+81-53-435-2309; Fax: +81-53-435-2308; E-mail: yukkiac.jp.