3.2
Impact Factor
ISSN: 1449-1907
Int J Med Sci 2015; 12(7):605-612. doi:10.7150/ijms.12446 This issue Cite
Research Paper
Lifestyle and Risk of Hypertension: Follow-Up of a Young Pre-Hypertensive Cohort
1. Center of Clinical Pharmacology, the Third Xiangya Hospital, Central South University, Changsha, China
2. School of Community Health Sciences, University of Nevada, Reno, NV, USA
3. Health Management Center, the Third Xiangya Hospital, Central South University, Changsha, China
*Zhijun Huang and Hong Yuan share senior authorship.
Received 2015-4-19; Accepted 2015-7-7; Published 2015-7-16
Abstract
Objectives: To determine whether healthy lifestyle decreases the risk of developing hypertension in pre-hypertensive patients.
Study design: A longitudinal study.
Setting & participants: Randomly selected pre-hypertensive young adults 20-45 years old without any vascular disease such as stroke or diabetes.
Predictors: Four lifestyle factors (a body mass index [BMI] of 18.5-24.9 kg/m2, regular physical activity, no alcohol use and 6-8 h of sleep per day), individually and in combination.
Outcomes: Hypertension was defined as a systolic blood pressure (SBP) ≥ 140 mmHg, or a diastolic BP (DBP) ≥ 90 mmHg or self-reported hypertension.
Measurements: Multivariate adjusted Cox proportional hazards.
Results: During a median follow-up of 4.7 years, 1009 patients were enrolled in our study, and 182 patients developed hypertension. Compared with a BMI of 18.5-24.9 kg/m2, a BMI of 25-30 kg/m2 and a BMI of >30 kg/m2 were associated with an increased risk of hypertension occurrence (hazard ratio [HR], 1.83; 95% confidence interval [CI], 1.19-2.84 and HR, 2.62; 95% CI, 1.01-6.80, respectively). Compared with sleep duration of >8 h/day, 6-8 h/day of sleep was associated with a lower risk of hypertension occurrence (HR, 0.40; 95% CI, 0.18-0.86). There were no statistically significant associations between physical activity or alcohol use and hypertension occurrence (P>0.05).
Limitation: All lifestyle factors were measured only once.
Conclusion: Healthy BMI (18.5-24.9 kg/m2) and sleep duration (6-8 h/day) were associated with a lower risk of the occurrence of hypertension in pre-hypertension patients.
Keywords: Pre-hypertension, BMI, Alcohol, Physical activity, Sleep duration, Hypertension
Background
The Seventh Report of the Joint National Committee on Prevention, Detection, Evaluation and Treatment of High Blood Pressure (JNC 7) created category called “pre-hypertension,” which was defined as a systolic blood pressure (SBP) of 120-139 millimeters of mercury (mmHg) and a diastolic blood pressure (DBP) of 80-89 mmHg [1]. Pre-hypertension even in low range (SBP: 120-130 mmHg or DBP: 80-85 mmHg) has been confirmed to have a higher risk to developed into hypertension [2]. Hypertension is associated with cardiovascular disease (CVD) risk factors, incidence, and mortality [3]. Thus, it is of great importance to delay pre-hypertensive patients from developing hypertension. Understanding the determinants of pre-hypertension, particularly in low-income countries, is a pre-requisite for improved prevention and control.
The JNC7 report suggests that individuals in this category should be treated with dietary and lifestyle modifications [1] instead of medication. According to the report, lifestyle becomes one of the most important methods to maintain or lower blood pressure in pre-hypertension patients. Although some studies have confirmed that pre-hypertension is associated with certain risk factors in cross-sectional studies [4-7], the influence of healthy lifestyles on the outcomes of hypertension in pre-hypertensive persons has not been well studied in a cohort study. Whether and how healthy lifestyle affects the risk of hypertension occurrence in pre-hypertensive patients, particularly in young adults, remains unknown.
Our study was the first follow-up study of a young Chinese pre-hypertensive population; the category was created in 2003, and our study began in 2004. The primary objective of this study was to examine a young pre-hypertensive population and to determine whether healthy lifestyle affects the risk of developing hypertension in pre-hypertension patients in an effort to provide some potential evidence for the management of pre-hypertension.
Methods
Study design and population
This longitudinal cohort study was performed in the Health Management Center of the Third Xiangya Hospital, Changsha, China, from December 2004 to December 2012. The study population consisted of young men and non-pregnant women from 20-45 years of age [World Health Organization, WHO] without any chronic disease, such as stroke, diabetes, or chronic kidney disease. We randomly selected participants from the medical record system databases. The inclusion criteria were as follows: 1) 20-45 years of age; 2) SBP, 120-139 mmHg or DBP, 80-89 mmHg; and 3) each participant had ≥ 1 medical record every year. The following individuals were excluded: 1) participants with other CVD, such as diabetes or stroke, during the follow-up study; 2) participants with diseases that could cause hypertension, such as primary hyperaldosteronism and renal artery stenosis; and 3) participants who took recreational drugs (e.g., marijuana) or other medications for potential co-morbidities.
Body mass index (BMI) was measured for each participant, and the questionnaire was administered once at the start of the study.
Outcomes
We evaluated blood pressure as the main outcome: 1) the occurrence of hypertension (the diagnostic criteria of hypertension were a systolic or diastolic blood pressure ≥140 or ≥90 mmHg, respectively, according to the JNC7 hypertension diagnostic standards) or a self-report of hypertension in the participants' medical records; and 2) non-hypertension status, including pre-hypertension and normtension.
Procedures
Blood pressure was measured in the non-dominant arm to the nearest 2 mm Hg using a mercury sphygmomanometer with a cuff of the appropriate size following standard recommended procedures. Two readings each for the SBP and DBP were taken in a 5-min interval after the participants had rested in a chair for at least 5 min. The average of the two readings was used for the data analysis. If the two measurements differed by more than 5 mm Hg, then an additional reading was taken, and the average of the three readings was used for data analysis.
Height and weight were measured in meters using a scale from the G-TECH Company. Height was measured to the nearest 0.1 centimeter (cm) using a tape measure, and weight was measured to the nearest 0.1 kg using calibrated platform scales. BMI was calculated as body weight (kilogram, kg) divided by the square of height (meter, m2).
Sociodemographic information, medical history and lifestyle information were obtained from standard self-report questionnaires.
Healthy Lifestyle Factors Definition
There were different types of lifestyle factors in the standard questionnaires. Four different lifestyle factors ascertained at study entry were considered (BMI, physical activity, alcohol use and sleep duration) based on their association with blood pressure change and overall health [8-11]. BMI was categorized as <18.5, 18.5-24.9, 25-30, or >30 kg/m2 [12]. Physical activity was categorized as “Frequent (vigorous exercise at least three times per week),” “Occasional” or “Everyday.” Alcohol use was classified as “None,” “Occasional” or “Frequent (at least once per week for at least the previous 6 months)”. Sleep duration was classified as “<6 h/day,” “6-8 h/day” or “>8 h/day” [13, 14].
Statistical Analysis
Descriptive statistics were summarized as the mean ± standard error for continuous variables and as the frequency and proportion for categorical variables. The follow-up time was calculated from the date of patient enrollment to the date of the last contact or death. A chi-squared test was used to assess the hypertension occurrence and the enumeration data between groups. A multivariate Cox proportional hazards model was used to identify the risk factors leading to hypertension in the pre-hypertensive population. A hazard ratio (HR) >1 was considered a risk factor, and a HR <1 was considered to be a protective factor. Values of P <0.05 were considered statistically significant. All of the analyses were performed using SAS 9.3 (University of Nevada, Reno, NV, USA). A forest plot was created using Stata 12.0, and the survival curves were created with SPSS 17.0.
Results
Baseline Characteristics, overall and by healthy lifestyle factors
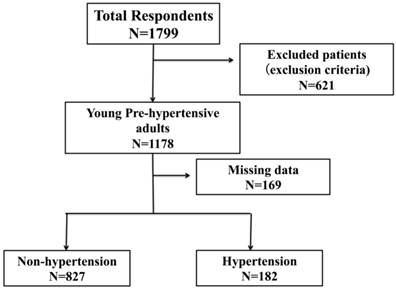
A total of 1799 participants were interviewed, and 1009 were enrolled in this longitudinal study (Figure 1). The median follow-up time of the population was 4.7 years.
For the 1009 patients included in these analyses, the mean age was 35.48±0.19 years old, and 36.57% were females (396). The average SBP was 125.24±0.12 mmHg, and the average DBP was 81.85±0.28 mmHg. Young pre-hypertension was mainly caused by increased SBP. The characteristics of the study participants are presented in Tables 1 and 2.
A flow diagram of participant screening and enrollment.
Baseline characteristics of Participants by BMI and physical activity
| BMI | Physical Activity | ||||||
|---|---|---|---|---|---|---|---|
| <18.5kg/m2 N=50 | 18.5-24.9 kg/m2 N=580 | 25-30 kg/m2 N=354 | ≥ 30kg/m2 N=25 | Everyday N=93 | Frequently N=346 | Occasionally N=570 | |
| Age (y) | 30.05(0.89) | 35.16(0.25) | 36.46(0.29) | 37.91(1.10)** | 34.35(0.87) | 36.49(0.35) | 34.92(0.25)** |
| Female sex | 35(79%) | 297(51.2%) | 60(16.9) | 4(16.0%) ** | 24(25.81%) | 117(33.82%) | 255(44.74%)** |
| Educational attainment | |||||||
| <college graduation | 13(26.00%) | 195(33.62%) | 97(27.40%) | 13(52.00%)* | 48(51.61%) | 90(26.01%) | 180(31.58%)** |
| College graduation | 34(68.00%) | 304(52.41%) | 189(53.39%) | 8(32.00%) * | 28(30.11%) | 195(56.36%) | 312(54.74%)** |
| >college graduation | 3(6.00%) | 81(13.97%) | 68(19.21%) | 4(16.00%) * | 17(18.28%) | 61(17.63%) | 78(13.68%) |
| Marriage status | |||||||
| Married | 35(70.00%) | 518(91.03%) | 341(96.33%) | 23(92.0%) ** | 88(94.62%) | 297(85.84%) | 532(93.33%)** |
| Unmarried | 14(28.00%) | 51(8.79%) | 13(3.67%) | 2(8%) ** | 4(4.30%) | 40(11.56%) | 36(6.32%) ** |
| Divorced or windowed | 1(2.00%) | 11(1.89%) | 0 | 0 * | 1(1.08%) | 9(22.83) | 2(0.35%)** |
| BMI(kg/m2) | 17.71(0.10) | 22.20(0.07) | 26.80(0.07) | 31.64(0.24)** | 23.22(0.10) | 23.83(0.18) | 23.91(0.13) |
Note: Values for categorical variables are presented as number (percentage); Valued for continuous variables are presented as mean SE.
*P<0.05; **P<0.01
BMI: body mass index
Baseline characteristics of Participants by Alcohol using and Sleep duration
| Alcohol using | Sleep duration | |||||
|---|---|---|---|---|---|---|
| No N=332 | Occasionally N=484 | Frequently N=193 | <6h/day N=312 | 6-8h/day N=174 | >8h/day N=523 | |
| Age(y) | 33.96(0.34) | 35.65(0.29) | 37.19(0.39)** | 35.30(0.36) | 35.96(0.51) | 35.35(0.25) |
| Female sex | 240(72.29%) | 136(28.10%) | 20(10.36%) ** | 130(41.67%) | 66(37.93%) | 200(38.24%) |
| Educational attainment | ||||||
| <college graduation | 111(33.43%) | 134(27.69%) | 73(37.82%) * | 104(33.33%) | 62(35.63%) | 152(29.06%) |
| College graduation | 178(53.62%) | 265(54.75%) | 92(47.47%) | 163(52.24%) | 78(44.83%) | 294(56.21%) * |
| >college graduation | 43(12.95%) | 85(17.56%) | 28(14.51%) | 45(14.42%) | 34(19.54%) | 77(14.72%) |
| Marriage status | ||||||
| Married | 299(90.06%) | 441(91.12%) | 177(91.71%) | 280(89.74%) | 160(91.95%) | 477(91.2%) |
| Unmarried | 33(9.94%) | 42(8.68%) | 5(2.59%) ** | 21(6.73%) | 14(8.05%) | 45(8.60%) |
| Divorced or windowed | 0 | 1(0.21%) | 11(5.70%) ** | 11(3.53%) | 0 | 1(0.19%) ** |
| BMI(kg/m2) | 22.74(0.18) | 24.26(0.15) | 24.91(0.22)** | 23.56(0.20) | 23.53(0.22) | 24.08(0.13)* |
Note: Values for categorical variables are presented as number (percentage); Valued for continuous variables are presented as mean SE.
*P<0.05; **P<0.01
BMI: body mass index
Compared with the participants with lower BMIs, the participants with higher BMIs were more likely to be older men with lower education levels. Compared with participants with less physical activity, participants with more physical activity were younger, married women with lower education levels. Compared with participants who did not use alcohol, participants who did use alcohol were more likely to be older, divorced or widowed men with lower education levels. Compared with participants with less sleep duration, participants who slept over 8 hours per day were more likely to have a college degree.
Univariate analysis of factors that affect hypertension occurrence
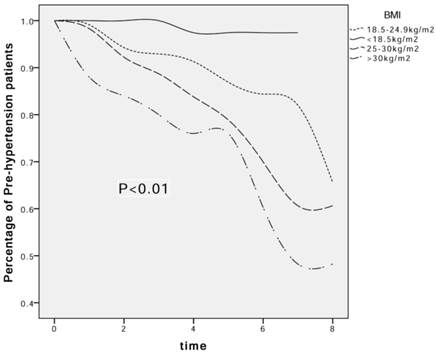
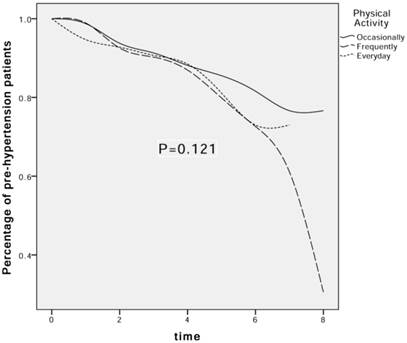
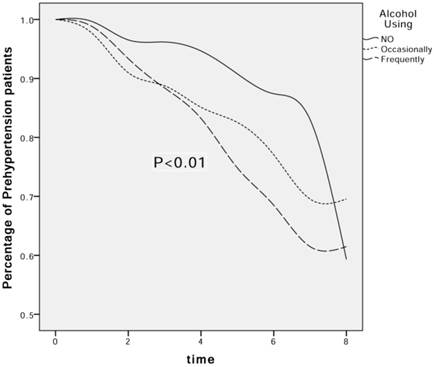
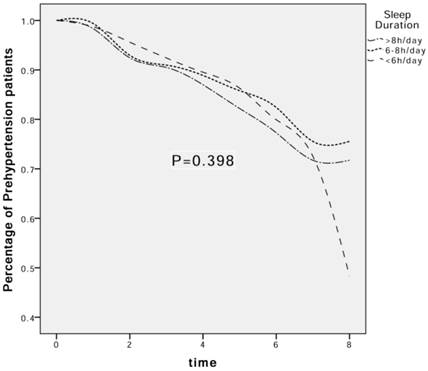
During a median follow-up time of 4.7 years, 182 participants developed hypertension, and 827 remained non-hypertensive, including 23 with normtension and 804 pre-hypertension patients. The univariate associations, presented in survival curves for BMI, physical activity, alcohol use and sleep duration related to the percentage of patients with pre-hypertension are shown in Figures 2-5. The results indicated that higher BMI and more alcohol use were risk factors leading to the increased occurrence of hypertension over time (P<0.05). There were no statistically significant differences between different levels of physical activity or sleep duration and hypertension occurrence (P=0.121 and P=0.398, respectively).
The effect of BMI on the decrease in the percentage of pre-hypertension patients. Kaplan-Meier (K-M) estimates for the transition to hypertension from prehypertension according to BMI subgroups at baseline.
The effect of physical activity on the decrease in the percentage of pre-hypertension patients. Kaplan-Meier (K-M) estimates for the transition to hypertension from prehypertension according to physical activity subgroups at baseline.
The effect of alcohol using on the decrease in the percentage of pre-hypertension patients. Kaplan-Meier (K-M) estimates for the transition to hypertension from prehypertension according to alcohol using subgroups at baseline.
The effect of sleep duration on the decrease in the percentage of pre-hypertension patients. Kaplan-Meier (K-M) estimates for the transition to hypertension from prehypertension according to sleep duration subgroups at baseline.
Multivariate analysis of factors that affect hypertension occurrence (Table 3)
In a simple Cox regression analysis adjusted for follow-up time (model 1), only a BMI of >24.9 kg/m2 was significantly associated with hypertension occurrence compared with a BMI of 18.5-24.9 kg/m2.
In model 2, age, gender and follow-up time were adjusted for their influence on each lifestyle. In addition to BMI, frequent alcohol use was associated with hypertension occurrence (model 2, HR, 1.74; 95% confidence interval (CI), 1.04-2.93).
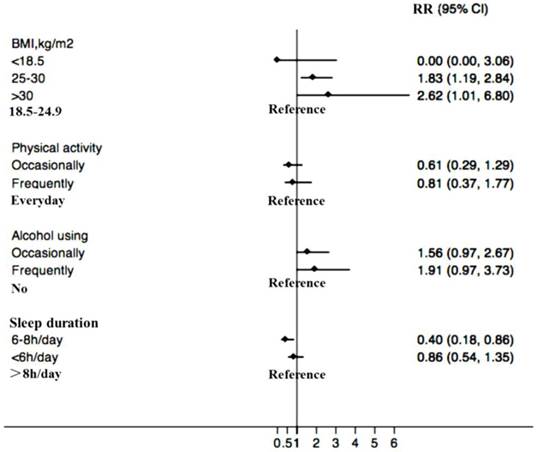
Because educational attainment and marriage status were confounders (differing in different groups), we adjusted for these two factors as well as for age, gender and follow-up time in model 3. In the fully adjusted model (model 3), a BMI of 25-30 kg/m2 and a BMI >30 kg/m2 were associated with an increased risk of hypertension occurrence (HR, 1.83; 95% CI, 1.19-2.84 and HR, 2.62; 95% CI, 1.01-6.80, respectively). Compared with sleep duration of >8 h/day, 6-8 h/day-sleep was associated with a lower risk of hypertension (HR, 0.40; 95% CI, 0.18-0.86). No statistically significant association was observed between physical activity or alcohol use and hypertension. The multivariate adjusted HRs and 95% CIs of hypertension occurrence are presented in forest plots (Fig. 6).
Event rates and Hazard Ratios for Hypertension occurrence in 4 lifestyle-groups
| No.Of events | Event rate | Model 1 | Model 2 | Model 3 | |
|---|---|---|---|---|---|
| BMI | |||||
| <18.5 | 1 | 2.00% | 0.17(0.02-1.25) | 0.19(0.03-1.34) | 0.00(0.00-3.06) |
| 18.5-24.9 | 75 | 12.93% | 1.00(reference) | ||
| 25-30 | 96 | 27.12% | 2.01(1.49-2.72) | 1.57(1.14-2.17) | 1.83(1.19-2.84) |
| >30 | 10 | 40.00% | 2.86(1.48-5.54) | 2.14(1.09-4.19) | 2.62(1.01-6.80) |
| Physical activity | |||||
| Occasionally | 92 | 16.14% | 0.73(0.39-1.37) | 0.74(0.40-1.39) | 0.61(0.29-1.29) |
| Frequently | 75 | 21.67% | 1.11(0.59-2.11) | 0.96(0.51-1.83) | 0.81(0.37-1.77) |
| Everyday | 15 | 16.12% | 1.00(reference) | ||
| Alcohol using | |||||
| Never | 37 | 11.14% | 1.00(reference) | ||
| Occasionally | 94 | 19.42% | 2.09(1.39-3.14) | 1.53(0.97-2.38) | 1.56(0.97-2.67) |
| Frequently | 51 | 26.42% | 2.80(1.78-4.40) | 1.74(1.04-2.93) | 1.91(0.97-3.73) |
| Sleep duration | |||||
| >8h/day | 109 | 20.84% | 1.00(reference) | ||
| 6-8h/day | 26 | 14.94% | 0.79(0.51-1.21) | 0.74(0.48-1.14) | 0.40(0.18-0.86) |
| <6h/day | 47 | 15.06% | 0.85(0.59-1.22) | 0.93(0.65-1.35) | 0.86(0.54-1.35) |
Note:
Model 1: Cox regression for each factor and hypertension events and adjusted for follow-up time;
Model 2: Model 1 and adjusted for age and gender;
Model 3: Model 2 and adjusted for education attainment and marriage status.
Multivariate adjusted HRs and 95% CIs for hypertension for each lifestyle factor category, adjusted for age, gender, educational attainment and marital status. BMI: body mass index.
Discussion
Since the category of was created in 2003, there are many arguments against using the term “prehypertension” as the risk of progressing to hypertension and developing cardiovascular disease (CVD) remains controversial. In this longitudinal cohort study of young pre-hypertensive patients, adherence to the components of an unhealthy lifestyle was associated with an increased risk of progression of hypertension from a pre-hypertensive status. Totally 18.04% of the young adults developed into hypertension and interestingly 2.28% have become normotensive at the end of the study. No specific reasons could be found in the current study as the sample size was much too small to further exportation. The effect of lifestyle factors on hypertension progress in pre-hypertensive patients deserves further investigation.
This follow-up study is the longest study to date to indicate that a higher BMI and improper sleep duration are associated with increased risk for the occurrence of hypertension in young pre-hypertensive adults. Compared with a BMI of 18.5-24.9 kg/ m2, a BMI of 25-30 kg/ m2 and a BMI>30 kg/ m2 were associated with an 83% and 162% increased risk of hypertension, respectively. Additionally, adherence to a sleep schedule of 6-8 h/day was associated with a 40% decreased risk of hypertension. Furthermore, alcohol use and physical activity were not significantly associated with progression to hypertension.
BMI
It has been recognized that excess weight or obesity is a major worldwide risk factor for hypertension, and numerous previous studies have confirmed that BMI is an index for excessive weight as well as an independent risk factor for blood pressure changes [15,16]. We used the traditional standards for BMI because the average Chinese BMI is relatively low [12,17]. Our findings regarding the reduced risk for hypertension among patients with BMIs of 18.5-24.9 kg/m2 were robust even after adjusting for age, gender and social behavior factors. Moreover, we did not observe any significant association between hypertension and a BMI <18.5 kg/m2. Thus, a higher BMI could be an independent predictive factor for hypertension in the pre-hypertensive population. Weight loss should be an effective lifestyle strategy to prevent hypertension. A healthy diet could be a promising method to control BMI [18]. Further studies are needed to determine how diet affects blood pressure in pre-hypertensive patients.
Physical activity
Physical exercise is another useful method for weight loss. It has also been proposed that exercise provides cardio-protection by protecting the vascular wall and that increased transient bouts of sheer stress confer a “vascular conditioning” effect [19]. Interestingly, our study did not obtain any positive results with respect to physical activity levels. One possible reason is the patients changed their exercise habits when they acknowledged that their BP was higher than normal. The effects of exercise training vary with different exercise modalities (endurance training or resistance exercise) and dose parameters, specifically program length, session duration, frequency, and intensity. A meta-analysis of exercise training for BP showed that only dynamic aerobic endurance training or dynamic resistance training lowered the SBP and DBP in pre-hypertensive patients, while combined training had no effect on either SBP or DBP [20]. Pre-hypertensive patients should choose appropriate exercise methods. Our study did not measure the exercise intensity of the population, and different intensities and modalities may lead to negative results.
Alcohol consumption
There are various opinions regarding whether alcohol can increase blood pressure. Alcohol consumption is a risk factor for cardiovascular disease, similar to hypertension [21,22], and most guidelines suggest discontinuing drinking. However, it is still inclusive whether drinking is associated with hypertension [23]. It has been suggested that modest alcohol consumption is not generally associated with an increase in blood pressure, while ingestion of larger quantities of alcohol has a dose-dependent effect on blood pressure both in hypertensive and normotensive subjects [24]. Our study showed that frequent alcohol use was associated with an increased risk of hypertension (74%) in the Cox regression model 2, without adjusting for age and gender; however, the association became insignificant when we adjusted for marital status and education status. The reasons for this paradoxical association are not clear, and in this study, alcohol use was self-reported and was, therefore, subject to measurement error. Nonetheless, our current findings emphasize the need for further research to evaluate the relationship between alcohol use, marital status, education level and hypertension because some studies have suggested that social factors such as education level may also affect blood pressure [25,26].
Sleep duration
The effects of sleep duration and blood pressure on hypertension have been studied in depth over the past decade [27,28]. Addressing sleep disorders or poor sleep habits seems to be a relevant issue when considering the risk of developing hypertension [29]. A meta-analysis that included 225,858 subjects and used the sleep duration categories of “short” and “long” indicated that a short sleep duration was associated with a higher risk of hypertension in the general population [30]. Another meta-analysis showed that long sleep duration might be associated with a risk of hypertension, particularly among subjects younger than 65 years of age [31]. Limited studies have investigated the effect of sleep duration on progression to hypertension among pre-hypertensive patients, particularly young adults. As for the young pre-hypertensive patients enrolled in our study, proper sleep duration is a protective factor reducing the risk of hypertension progression (40%) compared with sleeping >8 h/day (after adjusting for the other confounders). This conclusion clearly provides a potential strategy to control and treat individuals with high blood pressure, particularly in young adults (20-45 years old).
Limitation
We did not consider genetic background or smoking history in the present study. We only focused on Chinese patients, and there is still much debate about whether smoking could be a predictor for the occurrence of hypertension. The design of this work means that it is not possible to establish a causal relationship between lifestyle and risk of hypertension occurrence and self-reported lifestyle factors may have subjective errors. We measured only the quantity but not the quality of sleep, and only classification of states but not the dose of alcohol using. Although we adjusted for the multiple confounding variables, the effect of the four lifestyle factors may not have been fully controlled.
Conclusion
The present study is the first longitudinal study to address lifestyle factors to reduce the risk of hypertension in young pre-hypertensive population. Proper BMI (18.5-24.9 km/m2) and sleep duration (6-8 h/day) were associated with a lower risk for the occurrence of hypertension in a young pre-hypertensive population.
Our findings reinforce the JNC7 recommendations for lifestyle modification and also suggest that proper BMI and sleep duration are applicable for young patients with pre-hypertension to manage their blood pressure.
Acknowledgements
This research was supported by grants from the National Science and Technology Major Projects for “Major New drugs Innovation and Development” (No. 2012ZX09303014001), the National Natural Science Foundation of China (No. 81273594), the National Natural Science Foundation of China (No. 81202166) and the National Key Technology R&D Program (No. 2012BAI37BO5).
Competing Interests
The authors have declared that no competing interest exists.
References
1. Chobanian AV, Bakris GL, Black HR. et al. The Seventh Report of the Joint National Committee on Prevention, Detection, Evaluation, and Treatment of High Blood Pressure: the JNC 7 report. JAMA. 2003;289(19):2560-2572
2. Israeli E, Korzets Z, Tekes-Manova D. et al. Blood-pressure categories in adolescence predict development of hypertension in accordance with the European guidelines. American journal of hypertension. 2007;20(6):705-709
3. Elliott WJ, Black HR. Prehypertension. Nat Clin Pract Cardiovasc Med. 2007;4(10):538-548
4. Wu S, Huang Z, Yang X. et al. Cardiovascular events in a prehypertensive Chinese population: four-year follow-up study. International journal of cardiology. 2013;167(5):2196-2199
5. do Carmo Rocha J, Bustamante Teixeira MT, Azevedo E Silva G. et al. Prevalence of prehypertension and associated factors in women. Investigación y Educación en Enfermería. 2014;32(3):471-479
6. Fairbrother K, Cartner B, Alley JR. et al. Effects of exercise timing on sleep architecture and nocturnal blood pressure in prehypertensives. Vascular health and risk management. 2014;10:691-698
7. Ji C, Zheng X, Chen S. et al. Impact of resting heart rate on the progression to hypertension in prehypertension patients. Zhonghua xin xue guan bing za zhi. 2014;42(10):860-865
8. Faselis C, Doumas M, Panagiotakos D. et al. Body mass index, exercise capacity, and mortality risk in male veterans with hypertension. American journal of hypertension. 2012;25(4):444-450
9. Luke A, Kramer H, Adeyemo A. et al. Relationship between blood pressure and physical activity assessed with stable isotopes. Journal of human hypertension. 2004;19(2):127-132
10. Zatu MC, Van Rooyen JM, Kruger A. et al. Alcohol intake, hypertension development and mortality in black South Africans. European journal of preventive cardiology. 2014
11. Najafian J, Toghianifar N, Mohammadifard N. et al. Association between sleep duration and metabolic syndrome in a population-based study: Isfahan Healthy Heart Program. Journal of research in medical sciences: the official journal of Isfahan University of Medical Sciences. 2011;16(6):801-806
12. World Health Organization. Obesity: preventing and managing the global epidemic[M]. World Health Organization. 2000;894:i-xii 1-253
13. Tsai TC, Wu JS, Yang YC. et al. Long sleep duration associated with a higher risk of increased arterial stiffness in males. Sleep. 2014;37(8):1315-1320
14. Grandner MA, Drummond S. Who are the long sleepers? Towards an understanding of the mortality relationship. Sleep medicine reviews. 2007;11(5):341-360
15. Adams ST, Salhab M, Hussain ZI. et al. Obesity-related hypertension and its remission following gastric bypass surgery-A review of the mechanisms and predictive factors. Blood pressure. 2013;22(3):131-137
16. Wright OR, Netzel GA, Sakzewski AR. A randomized, double-blind, placebo-controlled trial of the effect of dried purple carrot on body mass, lipids, blood pressure, body composition, and inflammatory markers in overweight and obese adults: The QUENCH Trial. Canadian journal of physiology and pharmacology. 2013;91(6):480-488
17. Du T, Sun X, Yin P. et al. Increasing trends in central obesity among Chinese adults with normal body mass index, 1993-2009. BMC public health. 2013;13(1):327
18. Saneei P, Hashemipour M, Kelishadi R. et al. Effects of recommendations to follow the Dietary Approaches to Stop Hypertension (DASH) diet vs. usual dietary advice on childhood metabolic syndrome: a randomised cross-over clinical trial. British Journal of Nutrition. 2013;110(12):2250-2259
19. Green DJ. Exercise training as vascular medicine: direct impacts on the vasculature in humans. Exerc Sport Sci Rev. 2009;37(4):196-202
20. Cornelissen VA, Smart NA. Exercise training for blood pressure: a systematic review and meta-analysis. Journal of the American Heart Association. 2013;2(1):e004473
21. Tang L, Xu T, Li H. et al. Hypertension, alcohol drinking and stroke incidence: a population-based prospective cohort study among inner Mongolians in China. Journal of hypertension. 2014;32(5):1091-1096
22. Zatu MC, Van Rooyen JM, Kruger A. et al. Alcohol intake, hypertension development and mortality in black South Africans. European journal of preventive cardiology. 2014
23. Koliaki C, Katsilambros N. Dietary sodium, potassium, and alcohol: key players in the pathophysiology, prevention, and treatment of human hypertension. Nutrition reviews. 2013;71(6):402-411
24. Whelton PK, He J, Appel LJ. et al. Primary prevention of hypertension: clinical and public health advisory from The National High Blood Pressure Education Program. JAMA. 2002;288(15):1882-1888
25. Liu H, Waite L. Bad Marriage, Broken Heart? Age and Gender Differences in the Link between Marital Quality and Cardiovascular Risks among Older Adults. Journal of health and social behavior. 2014;55(4):403-423
26. Leng B, Jin Y, Li G. et al. Socioeconomic status and hypertension: a meta-analysis. Journal of hypertension. 2015;33(2):221-229
27. Gangwisch J E. Response to “Sleep Duration and Hypertension With Special Emphasis on Gender and Obesity”. American Journal of Hypertension. 2013;26(11):1363-1364
28. Sforza E, Martin MS, Barthelemy JC. et al. Association of self-reported sleep and hypertension in non-insomniac elderly subjects. Journal of clinical sleep medicine: JCSM: official publication of the American Academy of Sleep Medicine. 2014;10(9):965-971
29. Pepin JL, Borel AL, Tamisier R. et al. Hypertension and sleep: Overview of a tight relationship. Sleep medicine reviews. 2014;18(6):509-519
30. Guo X, Zheng L, Wang J. et al. Epidemiological evidence for the link between sleep duration and high blood pressure: a systematic review and meta-analysis. Sleep medicine. 2013;14(4):324-332
31. Wang Q, Xi B, Liu M. et al. Short sleep duration is associated with hypertension risk among adults: a systematic review and meta-analysis. Hypertension Research. 2012;35(10):1012-1018
Author contact
![]() Corresponding author: Hong Yuan, Center of Clinical Pharmacology, the Third Xiangya Hospital, Central South University, 138 Tongzipo Road, Changsha, China, 410013. Fax: 86731-88618319; E-mail: yuanhong1975com
Corresponding author: Hong Yuan, Center of Clinical Pharmacology, the Third Xiangya Hospital, Central South University, 138 Tongzipo Road, Changsha, China, 410013. Fax: 86731-88618319; E-mail: yuanhong1975com

 Global reach, higher impact