Impact Factor ISSN: 1449-1907

 Global reach, higher impact
Int J Med Sci 2013; 10(11):1560-1569. doi:10.7150/ijms.6611 This issue Cite
Research Paper
Relationship between Microstructure, Material Distribution, and Mechanical Properties of Sheep Tibia during Fracture Healing Process
Jiazi Gao1, He Gong1 ![]() , Xing Huang2, Juan Fang1, Dong Zhu3
, Xing Huang2, Juan Fang1, Dong Zhu3 ![]() , Yubo Fan4
, Yubo Fan4
1. Department of Engineering Mechanics, Jilin University, Changchun (130022), People's Republic of China;
2. Department of Radiology, People's Hospital of Jilin Province, Changchun (130021), People's Republic of China;
3. Traumatic Orthopedics, The First Hospital of Jilin University, Changchun (130025), People's Republic of China;
4. Key Laboratory for Biomechanics and Mechanobiology of Ministry of Education, School of Biological Science and Medical Engineering, Beihang University, Beijing (100191), People's Republic of China.
Received 2013-5-4; Accepted 2013-8-13; Published 2013-9-7
Abstract
The aim of this study was to investigate the relationship between microstructural parameters, material distribution, and mechanical properties of sheep tibia at the apparent and tissue levels during the fracture healing process. Eighteen sheep underwent tibial osteotomy and were sacrificed at 4, 8, and 12 weeks. Radiographs and micro-computed tomography (micro-CT) scanning were taken for microstructural assessment, material distribution evaluation, and micro-finite element analysis. A displacement of 5% compressive strain on the longitudinal direction was applied to the micro-finite element model, and apparent and tissue-level mechanical properties were calculated. Principle component analysis and linear regression were used to establish the relationship between principle components (PCs) and mechanical parameters. Visible bony callus formation was observed throughout the healing process from radiographic assessment. Apparent mechanical property increased at 8 weeks, but tissue-level mechanical property did not increase significantly until 12 weeks. Three PCs were extracted from microstructural parameters and material distribution, which accounted for 87.592% of the total variation. The regression results showed a significant relationship between PCs and mechanical parameters (R>0.8, P<0.05). Results of this study show that microstructure and material distribution based on micro-CT imaging could efficiently predict bone strength and reflect the bone remodeling process during fracture healing, which provides a basis for exploring the fracture healing mechanism and may be used as an approach for fractured bone strength assessment.
Keywords: Fracture healing process, Tibia, Microstructure, Material distribution, Mechanical properties.
INTRODUCTION
As weight-bearing bones, long bones tend to be destroyed by traffic accidents because of their slender shape; tibial fracture is one of the most frequent bone fractures [1]. During the fracture healing process, delayed bone unions and non-unions occur in almost 5% to 10% of patients, which drastically affects their rehabilitation and normal life [2]. Therefore, an evaluation of the fracture healing process and its underlying mechanism is important to explore methods for promoting fracture healing and to reduce patients' economic and mental burdens.
As a spontaneous and highly complex regenerative process, bone healing is directed by a series of biological events of bone induction and conduction, and involves several factors that affect bone repair and recovery, such as cartilage mineralization, intracellular and extracellular molecular signaling pathways and temporal and spatial optimizations [3-6]. Characterized by cellular and molecular events, bone healing is conventionally divided into four stages [6-8]. Stage 1, inflammation, wherein the integrity of bones and soft tissues is disrupted, and the extravasated blood develops into a hematoma. Stage 2, soft callus formation, wherein transplantation of the hematoma produces new bone that can provide mechanical support to the fractured bone. Stage 3, hard callus formation, which is characterized by high levels of osteoblast activity, as well as soft callus removal, hard callus bridging, and revascularization. Stage 4, bone remodeling, wherein the final stage includes remodeling of bone callus, trabecular bone reconfiguration, and vascular supply reversion.
Some studies have reported on the changes in mechanical properties during fracture healing using mechanical testing or finite element analysis (FEA). Christel et al. [9] established a rat radial osteotomy model to investigate the mechanical properties weekly. The results showed that the tensile failure load rose steadily, but a rapid increase of stiffness was observed between the 6th and 7th weeks. In light of this phenomenon, the mechanical behavior of callus tissues was deduced to proceed essentially in two steps: a rubbery-like behavior (low strength, low stiffness, large elongation) from 1 to 6 weeks, followed by a hard tissue-like behavior (high stiffness, small elongation) up to complete recovery. Different from the foregoing earlier experiment on fracture healing in rodents, a 2D finite element model of diaphyseal tibial fracture in the coronal plane at 4, 8, 12, and 16 weeks post fracture was developed [10]. The results showed that at 4 weeks, the central callus barely changed; the adjacent and peripheral calluses calcified rapidly and were able to support compressive load by 8 weeks; between 8 and 12 weeks, minimal change in the material properties and shape of the calluses occurred; from 12 to 16 weeks, the adjacent and peripheral callus could increasingly bear compressive load. Using FEA, a tibial fracture applied by composite bone plates was simulated by Kim et al. [1], who found that fracture gap strain decreased drastically because of callus property improvement at 8 weeks.
Bone mechanical properties depend on morphology and intrinsic material properties itself. By investigating the changes of macro- and microstructure and material composition of the bone, its quality can be evaluated and the efficacy of emerging treatments can be assessed [4, 11, 12]. Assessment of fracture healing can be performed by histological, imaging, and biomechanical testing [4, 13]. Although numerous parameters, such as fracture gap, callus bridging, callus thickness, area and diameter, can be evaluated from histological and imaging testing, the mechanical strength of bone cannot be predicted accurately [13, 14]. The most reliable method for strength prediction is mechanical testing, but it is not suitable for in vivo animals or human fracture assessment. Computed tomography (CT) images provide 3D geometric details and information of material properties [15]. Micro-computed tomography (micro-CT) provides superior resolution to quantitative CT (QCT) and peripheral QCT, which are beneficial in predicting the bone healing process [16-19]. Several recent studies have reported that micro-finite element analysis (μFEA) from micro-CT images can reflect the changes of structure within the callus during the mineralization process and predict whole bone or tissue-level mechanical properties accurately [4, 15, 20]. Images from micro-CT can be converted directly into micro-finite element (μFE) model to simulate mechanical testings under certain complex conditions and provide an accurate evaluation of bone mechanical properties and distributions of stresses and strains at tissue level [12, 16, 17, 20-22]. μFE models of different time points during bone healing based on micro-CT can predict bone strength and evaluate the healing process with good accuracy [18].
As a complex physiologic process, numerous pre-clinical studies have used micro-CT, morphological and mechanical testings to assess fracture callus structure and to differentiate tissues and mechanical properties at different stages during the fracture healing process [1, 9, 23]. However, incorporating these bone microstructures and bony material compositions with mechanical properties and biological healing mechanisms at different time points remains challenging [18].
Accordingly, this study investigated callus development, microstructures, bony material distribution, and apparent and tissue-level mechanical properties at 4, 8, and 12 weeks. The relationship among these parameters was explored, and an integral bone fracture model for evaluating the biological and biomechanical structure-function relationship during the healing process was established. The bone fracture model can be used as a new strategy for exploring the healing mechanism and the methods of accelerating bone healing.
MATERIALS AND METHODS
Animal preparation and surgical procedure
The protocol was approved by the Ethics Committee of The First Hospital of Jilin University (No. 2013-146). 21 sheep aged between 0.5 and 1 year and weighing 35 kg (±5 kg) were chosen. Osteotomy of the left tibia was performed, and the right tibia was used as untreated contralateral controls. Wound infection occurred in one sheep of group W8, and it died of systemic inflammatory response syndrome at the 5th week. Another 2 sheep died of disease at the 6th week with a tentative diagnosis of braxy. No more infections and deaths were found because of the immediate isolation and prevention. As a result, 18 samples were used in this study excluding the 3 sheep from group W8. The experimental design and sample sizes for fracture healing experiments included in this study are shown in Table 1.
Experimental design and sample size.
| Groups | Sample size | Time point for sacrifice |
|---|---|---|
| W4 | 7 | 4 weeks postoperatively |
| W8 | 4 | 8 weeks postoperatively |
| W12 | 7 | 12 weeks postoperatively |
Under general anesthesia, a transverse osteotomy of the tibial diaphysis was performed with an oscillating saw resulting in a 1 mm gap [24]. A bone plate and six screws were assembled to stabilize the fractured bone, and the skin was sutured and covered with a bandage. An antibiotic was used for the first three days postoperatively to avoid infection. The animals were permitted to move freely during the entire period of healing and humanely killed on the prescribed time points (Table 1). Both tibias were harvested and carefully cleaned of muscle and soft connective tissue and bone plates.
Radiological evaluation and micro-CT scanning
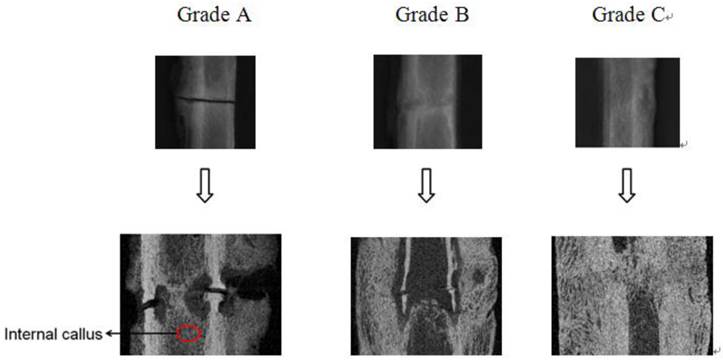
Siemens AX10M digital radiography was used to assess the course of healing. Subjective and blind assessment was performed by a professional technician of radiology (without knowledge of Control/Experimental status). According to radiographic images, calluses were scored into three grades: Grade A (Bridging): early healing, osteotomy gap is clearly visible, and both internal and external callus formations were visible; Grade B (Bridged): bridging of the callus was apparent on the periosteal surface with only a small gap remained inside; Grade C (Fully bridged): fully bridged and fracture gap was invisible [25] (Figure 1). Then, the percentages of every grade at different groups were calculated.
Radiograph and corresponding longitudinal cut-away view of each stage. (Grade A: Bridging; Grade B: Bridged; Grade C: Fully bridged).
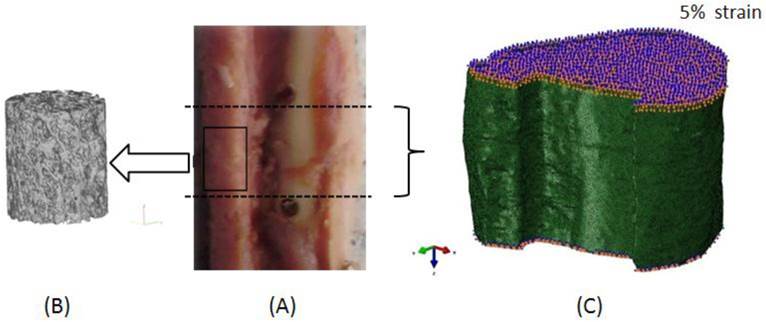
Then, quantitative analysis of the callus microstructure was performed by a micro-CT system (Skyscan 1076, Skyscan, Belgium) operated at 70 KV and 142 μA with Al 1.0 mm filter. The spatial resolution for specimen scanning was set to 38 μm. Micro-CT images of the callus were obtained for evaluating the microstructural parameters and μFEA (Figure 2). The following measures of callus structure and composition were evaluated from the micro-CT data for each specimen: bone mineral density (BMD), bone volume fraction (BV/TV), trabecular thickness (Tb.Th), trabecular number (Tb.N), and trabecular separation (Tb.Sp) [26].
Region for microstructural evaluation and μFEA. (A - Callus without plate and the region for μFEA (between the two holes across the fracture gap); B - 3D region for qualitative evaluation of callus, which was built from 2D micro-CT images; C - μFE model and boundary conditions).
Micro-finite element analysis
Significant changes in the cortices as a result of osteoclastic activity were visible during the fracture healing process. Large pores in the cortices could be found, which made the cortices appear similar to the calluses [14]. Therefore, μFE models should include both calluses and cortical bones to calculate the mechanical properties.
Three-dimensional reconstruction of the micro-CT images was done with Mimics software (Materialise Inc., Leuven, Belgium). The region between the two holes across the fracture gap was chosen manually in Mimics for μFEA (Figure 2 A), the height is 15 mm (±2 mm). The models were meshed with four-node tetrahedral elements in ABAQUS 6.9 software (SIMULIA Inc., Providence, USA).
The average largest edge length was 200 μm to 250 μm, and the number of tetrahedral elements ranged from 1,060,413 to 2,676,327. The bone material properties were set as described in Chen et al. [27] as ρ=0.00063 HU-0.0067 and E=10.5ρ2.29, where ρ is bone density in g/cm3 and E is Young's modulus in GPa. The isotropic Poisson's ratio was set to be 0.3 [27].
Given the important roles of internal callus during fracture healing and tissue mineralization, the location inside the long bone where the internal callus of the fractured bone existed was analyzed with the whole bone. Since there was marrow inside the long bones, the density of marrow was set to be 0.01 g/cm3 (no bone) for distinction from bony tissue [28].
A displacement of 5% compressive strain on the longitudinal direction was applied to each μFE model, Figure 2 C shows a typical μFE model with loading and boundary conditions.
As a parameter more often used to evaluate mechanical property at the tissue level, average von Mises stress was calculated [29, 30], besides, Young's modulus reflecting the apparent mechanical property was also calculated and discussed.
Apparent and tissue-level mechanical parameters measurements [31, 32]:
Apparent mechanical parameter:
σ=F/A (1)
E=σ/ε (2)
where σ: apparent stress; ε: apparent strain; F: model reaction force; A: average area of superior and inferior surfaces.
Average von Mises stress:
(3)
Where VEi: the volume of the ith element in the finite element model; SEi: von Mises stress of the ith element in the finite element model.
Statistical analysis
All statistical analyses were performed using SPSS 13.0. Medians were calculated for each group. Kruskal-Wallis test was used to compare the differences in microstructural parameters, apparent and tissue-level mechanical parameters, and bony material distribution of fractured tibias among groups. If Kruskal-Wallis test showed significance, Mann-Whitney test was performed for comparison between every two groups. The same statistical analysis was used to test for differences in bony material distribution between the control (right) and the experimental (left) tibias at the same time point. Principle component analysis (PCA) was used to identify the parameters making the largest contribution to mechanical properties from microstructural parameters and bony material distribution. Relationships between principle components (PCs) and mechanical properties were tested by linear regression analysis. P<0.05 was taken to indicate significant difference.
RESULTS
Radiographic assessment of healing fractures
Figure 1 shows the representative radiographs of the three stages from radiological results and the corresponding longitudinal cut-away views. The percentages of every grade at different time points are shown in Table 2.
Percentages of each grade at different time points.
| Groups | A% | B% | C% |
|---|---|---|---|
| W4 | 42.86 | 57.14 | 0.00 |
| W8 | 0.00 | 75.00 | 25.00 |
| W12 | 0.00 | 28.57 | 71.43 |
Microstructural evaluation
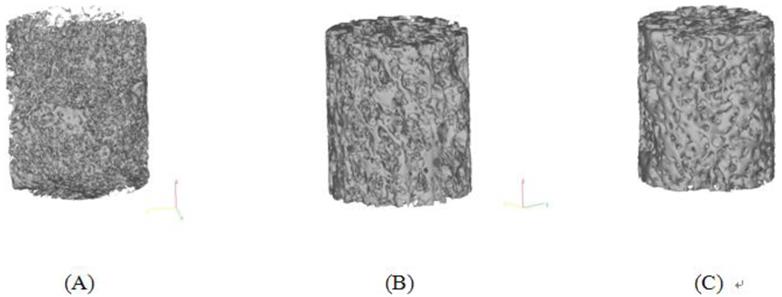
Three-dimensional trabecular microstructures of calluses at different time points were reconstructed from 2D micro-CT images, from which a 3D observation on calluses can be obtained (Figure 3).
Typical 3D microstructures of calluses at different time points. Model size: Height 7 mm, Diameter 8.5 mm (median). (A - Group W4; B - Group W8; C - Group W12).
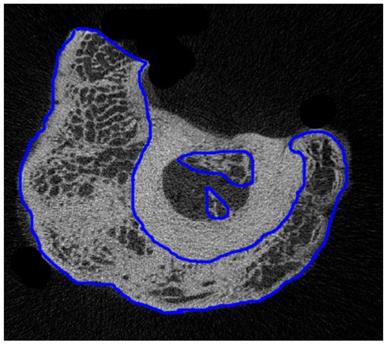
The region of interest (ROI) in the 2D micro-CT image was selected one by one manually. Figure 4 shows a typical ROI on a 2D micro-CT image. Then, the 3D microstructures were built from 2D ROIs and used for calculation of microstructural parameters by CTAn (CTAn, Skyscan, Belgium), and the results are shown in Table 3.
A typical ROI of calluses on a 2D micro-CT image from group W8 (regions of internal and external calluses were drawn by blue lines)
Microstructural parameters of calluses (median).
| Goups | BMD (g/cm3) | BV/TV (%) | Tb.Th (mm) | Tb.N (1/mm) | Tb.Sp (mm) |
|---|---|---|---|---|---|
| W4 | 0.6752 | 51.65 | 0.1843 | 2.8210 | 0.1925 |
| W8 | 0.8202 | 58.37 | 0.1990 | 2.9524 | 0.2266 |
| W12 | 0.8273* | 58.98 | 0.2168* | 2.8516 | 0.2400* |
*Significantly different to group W4 (P<0.05).
Microstructural analysis showed that at 4 weeks postoperatively, bony tissue was visible in the callus, but was fragmented and less connected with lower BMD, BV/TV, and Tb.Th (Figure 3 A). At 8 weeks postoperatively, BMD was 21.48% higher than that in group W4 (P=0.071), with increasing Tb.Th and BV/TV and more connectivity among the trabeculae (Figure 3 B). At 12 weeks after surgery, more plate-like trabeculae were observed (Figure 3 C), and the BMD of group W12 was 22.53% higher than that in group W4 (P=0.014). Tb.Th thickened significantly by 17.63% (P=0.0354) and 8.94% (P=0.333) compared with those in groups W4 and W8, respectively. In addition, Tb.Sp of group W4 was significantly lower than that in group W12 (P =0.046), but no significant difference on Tb.N was observed among groups (P>0.05).
Apparent and tissue-level mechanical parameters of fractured tibias
Table 4 lists the median values of apparent and tissue-level mechanical parameters of each group at different time points calculated from μFEA and the differences between groups. To avoid difference between individuals, apparent mechanical parameters (Young's moduli) of fractured tibias were reported as percentages of untreated contralateral side (E%).
Apparent and tissue-level mechanical parameters (median).
| Groups | E% | Tissue average von Mises stress (MPa) |
|---|---|---|
| W4 | 13.6639 | 48.3011 |
| W8 | 26.8511 | 65.5060 |
| W12 | 31.6736* | 155.8331* |
*Significantly different to group W4 (P<0.05).
Kruskal-Wallis test showed significant difference in E% (P=0.015). E% of the group W12 was significantly higher (131.80%) than that in group W4 (P=0.008), and 17.95% higher than that in group W8 (P=0.33). E% in group W8 also showed a higher value than that in group W4 (96.51%), but the difference did not reach a significant level (P=0.071).
Kruskal-Wallis test showed significant difference between groups in tissue average von Mises stresses (P=0.028). Significant increase was found in group W12, with values that were 222.63% (P=0.014) and 137.89% (P=0.11) higher than those in groups W4 and W8, respectively. The value of von Mises stress tended to increase from 4 to 8 weeks, but the increase was not significant between time points (P=0.643).
Bony material distribution
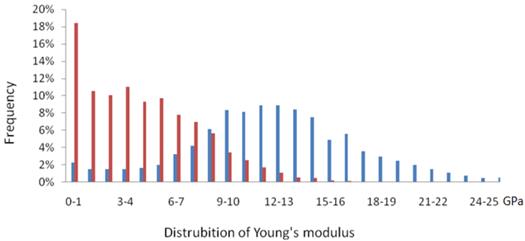
Figure 5 shows that the bony material distributions of fractured bone with Young's moduli less than 8 GPa were significantly higher than that of untreated contralateral control bone. By contrast, higher values were observed in the region of high Young's moduli (≥8 GPa) in the untreated control groups. Therefore, based on the typical sketches of bony materical distribution, a linear interpolation was used to calculate the proportion of elements by the Young's moduli values at 1, 2, 4, 8, 12, and 16 GPa (Figure 6).
Typical sketch of material distribution of fractured bone and untreated control bone from group W12. (Red bar for fractured bone and blue for untreated control bone).
Comparisons of bony material distribution between fractured bones and untreated bones at the same time point (median). (A - 4 weeks postoperatively; B - 8 weeks postoperatively; C - 12 week postoperatively). * Significant difference.
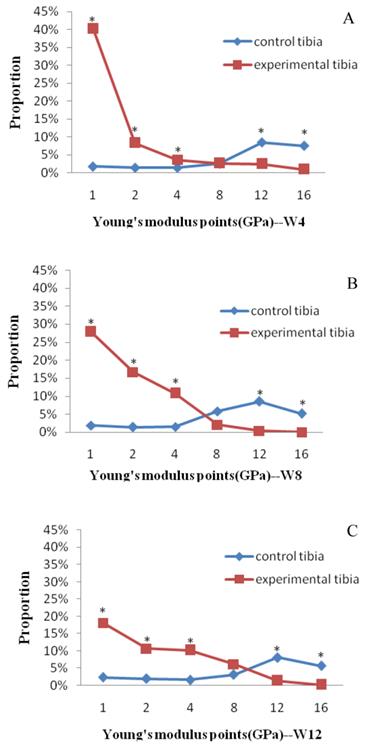
Figure 6 shows the comparisons of bony material distribution between fractured bones and untreated bones at the same time point. All the proportions of fractured bones were significantly higher than those of untreated control bones on Young's modulus points 1, 2, and 4 GPa (P<0.05). For the control groups, a smooth and steady growth of proportion on Young's modulus points 1, 2, and 4 GPa was observed. On the point of 8 GPa, the untreated control bones first showed a higher value than the fractured bones at group W8 (Figure 6 B, P>0.05). All the control groups showed significantly higher values than the fractured bones on Young's modulus points 12 and 16 GPa (P<0.05).
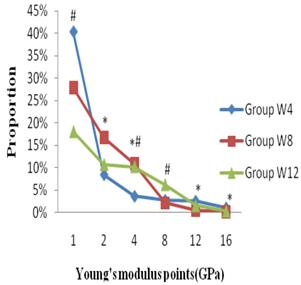
The comparison of material distribution of fractured bones at different time points showed that the proportion of group W4 showed an obvious increase on the point of 1 GPa (Figure 7), which was 44.73% (P=0.130) and 122.81% (P=0.005) higher than those in groups W8 and W12, respectively. A significant decrease of group W4 was shown on the points of 2 and 4 GPa compared with groups W8 and W12. On the point of 8 GPa, group W8 showed the lowest value, and the highest value was shown at group W12. Although group W4 showed another higher value than those in other groups on points 12 GPa (P<0.05) and 16 GPa (P>0.05), the proportions were too small to affect the entire bone mechanical properties.
Comparisons of material distribution of fractured bones at different time points. * Significant difference between groups W8 and W4; # Significant difference between groups W12 and W4
Relationship between bony material distribution, microstructural parameters, and mechanical properties
All the bony material distributions and microstructural parameters were included in the PCA. Three PCs with eigenvalues greater than 1.0 were found. Results of the PCA are shown in Tables 5 and 6, and the first three PCs accounted for 87.592% of the variations with 43.116%, 28.906%, and 15.570%, respectively (Table 5).
Total variance explained.
| PCs | Eigenvalue | % of variance | Cumulative % of variance |
|---|---|---|---|
| 1 | 4.743 | 43.116 | 43.116 |
| 2 | 3.180 | 28.906 | 72.022 |
| 3 | 1.713 | 15.570 | 87.592 |
Component matrix.
| Components | ||||
|---|---|---|---|---|
| PC1 | PC2 | PC3 | ||
| Bony material distribution (Young's modulus points) | 1 | -0.693 | -0.523 | -0.397 |
| 2 | 0.424 | -0.666 | -0.022 | |
| 4 | 0.917 | -0.145 | 0.244 | |
| 8 | 0.559 | 0.663 | 0.201 | |
| 12 | -0.631 | 0.723 | 0.051 | |
| 16 | -0.705 | 0.602 | -0.002 | |
| Microstructural parameters | BMD | -0.375 | 0.694 | 0.492 |
| Tb.N | -0.209 | -0.522 | 0.807 | |
| Tb.Th | 0.783 | 0.493 | -0.338 | |
| Tb.Sp | 0.829 | 0.341 | -0.413 | |
| BV/TV | 0.741 | 0.061 | 0.524 | |
The highest weights are marked in bold indicated stronger association with the principal component.
The highest weights are marked in bold in Table 6, which indicated stronger association with the PCs. PC1 included material distribution on Young's modulus points on 1, 4, and 16 GPa, and most of microstructural parameters. PC2 was almost completely weighted towards Young's modulus points on 2, 8, and 12 GPa and BMD, whereas Tb.N contributed only to PC3.
The regression of the PCs and apparent Young's modulus was expressed in the following equation:
E(GPa)=3.042+0.881PC1+0.427PC2+0.522PC3 (4)
R=0.813 (P=0.002)
The regression of the PCs and tissue von Mises stress was expressed in the following equation:
S(GPa)=0.088+0.029PC1+0.029PC2+0.025PC3 (5)
R=0.915 (P=0.000)
DISCUSSION
A sheep tibial fracture model was established in this paper, and the microstructural and mechanical parameters at different time points were investigated. The factors that affected bone healing, such as callus development, microstructure and bony material distribution, were considered. The relationships among these parameters and mechanical properties were quantified by PCA and linear regression analysis.
Studies by Gardner et al. [10, 23] using 2D finite element analysis to estimate the distribution of strains and stresses throughout the fractured callus of human tibia at 4, 8, 12, and 16 weeks showed that in the first 4 weeks, the fracture was at the initial soft tissue stage and the load was largely transferred longitudinally between fracture fragments across the inter-fragmentary gap. This condition led to minimal load bearing capacity at this stage. Callus size and significant maturation of the callus was observed to increase from 4 to 8 weeks, and the soft callus began to transform to hard callus. Meanwhile, connective tissue and fibrocartilage formed in the central callus. Differentiation and mineralization of the adjacent callus made the callus the primary support to the compressive load, with a consequent increase in Young's moduli. These conclusions are proven in our current study at 8 weeks. During the bone healing process, E% of the fractured bone increased significantly over time (P<0.05). Given the small sample size, no significant difference was found in the comparison between groups W8 and W4 (P=0.071), group W8 still showed a higher value of E% (96.51%) than group W4, which indicated an increase of bone strength at 8 weeks. Additionally, between 8 and 12 weeks, little tissue maturation occurred in the callus in Gardner and Mishra's study [23], which was similar to the results obtained in this paper, namely, the E% of group W12 was merely 17.95% higher than that in group W8 (P>0.05).
Although the apparent property increased at 8 weeks, no significant increase was observed in group W8 compared with group W4 on tissue average von Mises stress (35.62%, P=0.643). Significant increase of tissue average von Mises stress could not be observed until 12 weeks (P<0.05). Meanwhile, the changes in microstructure showed a similar tendency to the apparent mechanical parameters, namely, BMD and BV/TV increased and the callus became integrated (Figure 3 and Table 3). Thus, based on the premise that callus properties are associated with the quantity of mineralized tissue [18, 33, 34], we believe that the main reasons for the increase of apparent mechanical parameter were the changes in the shape and volume of the callus and the improvement of bone microstructure, but not the increase of tissue mineralization or tissue-level mechanical property.
Bone repair started as soon as fracture occurred. The quantitative histomorphometry showed that during the initial phase of healing (at 2 weeks), the woven formation was present on the surface of the cortical bone, yet no ossified callus was observed in the plane of osteotomy gap. Bridging of the osteotomy gap started at 3 to 4 weeks [14, 24]. Bone tissue formed first in the regions far from the fracture gap and advanced along the periosteal aspect of cortex toward the fracture gap; the fracture gap seemed to be the last region of ossification [14, 34].
Therefore, assessing bone healing through radiographs by investigating the loss of the fracture gap is a simple and direct method [25], meanwhile, percentages of different grades were calculated for accurate assessment in our study. Significant inferior bone healing was observed on the radiographs at 4 weeks, and both internal and external callus formation were visible on most specimens (Figure 1). With the advancement of fracture healing, ossification proceeded in the peripheral areas of callus and advanced toward the fracture gap [24]. At 8 weeks, A% turned to be 0, which indicated that bridging of the callus was completed and almost no fracture gaps were left. Then, at 12 weeks, C% showed a notably higher value than both A% and B% (Table 2), although 28.57% of the specimens were still at stage B. Thus, most of the specimens reached an ideal healing stage, with callus fully bridged (Table 2, Figure 1).
Microstructures of calluses were observed at different time points. Four weeks was the initial fracture healing stage, the removal of hematoma did not finish and the fracture was at the stage prior to the commencement of ossification, which caused a fragmented and less connected structure of new bones (Figure 3 A). Fracture healing was at the 'hard callus stage', which commenced before 8 weeks [10], during which the healing bone was restored to its original function by enhancing its mechanical strength. Thus, the change in microstructure (increases of BMD, BV/TV, and Tb.Th) was considered to meet this requirement, and Tb.Sp increased as a result of tissue connectivity improvement (Table 3). As an evidence of progress in fracture healing, an obvious bony structure of the callus could be found; it mostly approached the level of intact bone at 12 weeks (Figure 3 C).
The changes of bone structure and material composition determine the changes of bone strength [3, 4, 14, 15, 18, 19], so in our study, bony material distribution was described by the frequency of trabecular bone materials on different Young's modulus points. A sudden decline in bone material properties was observed at 4 weeks. Bony material distributions of fractured tibias with Young's moduli less than 8 GPa were significantly higher than those of untreated contralateral control bone, which indicated the decrease of mechanical properties at the initial stage of fracture. With the passage of time, the number of elements on lower Young's moduli (<8 GPa) decreased, but the proportions increased on higher Young's modulus points, which was in agreement with the results of the mechanical parameters in our study.
As a statistical technique that transforms a set of correlated variables into a substantially smaller set of uncorrelated parameters, PCA was conducted to identify the parameters that are considered the strongest predictors to fractured bone strength from microstructural parameters and material distribution. The results of PCA indicated that BMD and Tb.N contributed most strongly to PC2, but the majority of the variability was captured by PC1, which included Tb.Th, Tb.Sp, and BV/TV (Table 6). This result is in accordance to the investigation on the relationship among callus structure, composition, and mechanical function, which was conducted by Morgan et al. using micro-CT [18], it appears that the variation in callus structure and composition among specimens was captured largely by BV, BMC, and BV/TV. In addition, linear regression revealed the good relationship between the three PCs and the μFEA predicted strength (R>0.8), which indicates that microstructural parameters and material distribution contributed significantly to the fractured bone strength (P<0.05).
There are some limitations in this study. Firstly, sample size, because of the deaths of 3 sheep during the period of experiment, only 4 samples were left in group W8. Nevertheless, nonparametric test still reached significant level, so the result can be used to compare different groups. Secondly, consider the fragmented and less connected structure of new bones during the fracture healing process, and both the internal and external calluses existed at the same time, a whole FE model was established (Figure 2 C), which included not only calluses but also cortices, trabecular bone and marrow. This modeling technique was often used in the FEA of long bones based on CT images [35-37]. It was convenient for 3D meshing and cost less computational time. Although it included certain simplification of fractured bone, it can contain most of the information about the bony tissue. In addition, by using a smaller element size (the average largest edge length for tetrahedral elements was 200 μm to 250 μm), a more precise prediction of mechanical parameters can be achieved.
In summary, the results of this study showed that the mechanical properties of the fractured bone changed over time, which could be identified by the changes in microstructures and material distribution. Measurement of these parameters during fracture healing may thus provide important insights into the biomechanics of the healing process. The literature showed that the regions farthest from the gap had the highest mineral content, and bone modulus was found to be correlated with mineral content and distance from the fracture gap [34]. Thus, fracture healing is not only a time-dependent process, but also a region-specific change, which warrants a more in-depth study in the future to provide a theory for hastening normal fracture healing and avoiding delayed bone unions or non-unions.
Acknowledgements
This work is supported by the National Natural Science foundation of China (Nos. 11322223 and 11272134), and the 973 Program (No. 2012CB821202).
COMPETING INTERESTS
The authors have declared that no competing interest exists.
References
1. Kim SK, Chang SH, Jung HJ. The finite element analysis of a fractured tibia applied by composite bone plates considering contact conditions and time-varying properties of curing tissues. Compos Struct. 2010;92(9):2109-2118
2. Nelson FR, Brighton CT, Ryaby J. et al. Use of physical forces in bone healing. J Am Acad Orthop Surg. 2003;11(5):344-354
3. Jäger M, Ott CE, Grünhagen J. et al. Composite transcriptome assembly of RNA-seq data in a sheep model for delayed bone healing. BMC Genomics. 2011;12:158
4. Weis JA, Miga MI, Granero-Moltó F. et al. A finite element inverse analysis to assess functional improvement during the fracture healing process. J Biomech. 2010;43(3):557-562
5. Dimitriou R, Jones E, McGonagle D. et al. Bone regeneration: current concepts and future directions. BMC Med. 2011;9:66
6. Gerstenfeld LC, Cullinane DM, Barnes GL. et al. Fracture healing as a post-natal developmental process: molecular, spatial, and temporal aspects of its regulation. J Cell Biochem. 2003;88:873-884
7. Schindeler A, McDonald MM, Bokko P. et al. Bone remodeling during fracture repair: The cellular picture. Semin Cell Dev Biol. 2008;19:459-466
8. Carano RA, Filvaroff EH. Angiogenesis and bone repair. Drug Discov Today. 2003;8(21):980-989
9. Christel P, Cerf G, Pilla A. Time evolution of the mechanical properties of the callus of fresh fractures. Ann Biomed Eng. 1981;9:383-391
10. Gardner TN, Stoll T, Marks L. et al. The influence of mechanical stimulus on the pattern of tissue differentiation in a long bone fracture- an FEM study. J Biomech. 2000;33:415-425
11. Boccaccio A, Ballini A, Pappalettere C. et al. Finite element method (FEM), mechanobiology and biomimetic scaffolds in bone tissue engineering. Int J Biol Sci. 2011;7(1):112-132
12. Boyd SK, Müller R. Smooth surface meshing for automated finite element model generation from 3D image data. J Biomech. 2006;39(7):1287-1295
13. Schell H, Thompson MS, Bail HJ. et al. Mechanical induction of critically delayed bone healing in sheep: radiological and biomechanical results. J Biomech. 2008;41(14):3066-3072
14. Epari DR, Schell H, Bail HJ. et al. Instability prolongs the chondral phase during bone healing in sheep. Bone. 2006;38(6):864-870
15. Shefelbinea SJ, Simona U, Claesa L. et al. Prediction of fracture callus mechanical properties using micro-CT images and voxel-based finite element analysis. Bone. 2005;36:480-488
16. D'Elia G, Caracchini G, Cavalli L. et al. Bone fragility and imaging techniques. Clin Cases Miner Bone Metab. 2009;6(3):234-246
17. Ladd AJ, Kinney JH, Haupt DL. et al. Finite-element modeling of trabecular bone: comparison with mechanical testing and determination of tissue modulus. J Orthop Res. 1998;16(5):622-628
18. Morgan EF, Mason ZD, Chien KB. et al. Micro-computed tomography assessment of fracture healing: relationships among callus structure, composition, and mechanical function. Bone. 2009;44(2):335-344
19. Gabet Y, Müller R, Regev E. et al. Osteogenic growth peptide modulates fracture callus structural and mechanical properties. Bone. 2004;35:65-73
20. Rhee Y, Hur JH, Won YY. et al. Assessment of bone quality using finite element analysis based upon micro-CT images. Clin Orthop Surg. 2009;1:40-47
21. Saidpour SH. Assessment of carbon fibre composite fracture fixation plate using finite element analysis. Ann Biomed Eng. 2006;34(7):1157-1163
22. Leong PL, Morgan EF. Correlations between indentation modulus and mineral density in bone-fracture calluses. Integr Comp Biol. 2009;49(1):59-68
23. Gardner TN, Mishra S. The biomechanical environment of a bone fracture and its influence upon the morphology of healing. Med Eng Phys. 2003;25(6):455-464
24. Cheal EJ, Mansmann KA, DiGioia AM 3rd. et al. Role of interfragmentary strain in fracture healing: ovine model of a healing osteotomy. J Orthop Res. 1991;9(1):131-142
25. Goodship AE, Lawes TJ, Rubin CT. Low-magnitude high-frequency mechanical signals accelerate and augment endochondral bone repair: preliminary evidence of efficacy. J Orthop Res. 2009;27(7):922-930
26. Wang L, Cheung JT, Pu F. et al. Why do woodpeckers resist head impact injury: a biomechanical investigation. PLoS One. 2011;6(10):e26490
27. Chen G, Schmutz B, Epari D. et al. A new approach for assigning bone material properties from CT images into finite element models. J Biomech. 2010;43:1011-1015
28. Xinghua Z, He G, Dong Z. et al. A study of the effect of non-linearities in the equation of bone remodeling. J Biomech. 2002;35(7):951-960
29. Yeni YN, Zelman EA, Divine GW. et al. Trabecular shear stress amplification and variability in human vertebral cancellous bone: relationship with age, gender, spine level and trabecular architecture. Bone. 2008;42(3):591-596
30. Pistoia W, van Rietbergen B, Laib A. et al. High-resolution three-dimensional-pQCT images can be an adequate basis for in-vivo microFE analysis of bone. J Biomech Eng. 2001;123(2):176-183
31. Gao JZ, Gong H, Fang J. et al. Biomechanical assessment for the effects of vibration during the rehabilitation process of osteoporosis. J Med biomech. 2011;26(4):315-320 (In Chinese)
32. Alonso-Rasgado T, Jimenez-Cruz D, Bailey CG. et al. Changes in the stress in the femoral head neck junction after osteochondroplasty for hip impingement: a finite element study. J Orthop Res. 2012;30(12):1999-2006
33. Augat P, Merk J, Genant HK. et al. Quantitative assessment of experimental fracture repair by peripheral computed tomography. Calcif Tissue Int. 1997;60:194-199
34. Leong PL, Morgan EF. Measurement of fracture callus material properties via nanoindentation. Acta Biomater. 2008;4(5):1569-1575
35. Gong H, Zhang M, Fan Y. et al. Relationships between femoral strength evaluated by nonlinear finite element analysis and BMD, material distribution and geometric morphology. Ann Biomed Eng. 2012;40(7):1575-1585
36. Kluess D, Souffrant R, Mittelmeier W. et al. A convenient approach for finite-element-analyses of orthopaedic implants in bone contact: modeling and experimental validation. Comput Methods Programs Biomed. 2009;95(1):23-30
37. Wieding J, Souffrant R, Fritsche A. et al. Finite element analysis of osteosynthesis screw fixation in the bone stock: an appropriate method for automatic screw modelling. PLoS One. 2012;7(3):e33776
AUTHOR BIOGRAPHY
Jiazi Gao received the B.E. degree in Biomedical Engineering from Changchun University of Science and Technology, Changchun, China, in 2007 and the M.E degree in Biomedical Engineering from Jilin University, Changchun, China, in 2009. She is currently working toward the Ph.D. degree at the Department of Engineering Mechanics in Jilin University, Changchun, China. Her current research interest is biomechanics.
![]() Corresponding author: He Gong, Tel: 86-13844801003; Email: gongheedu.cn Or Dong Zhu, Tel: 86-13500805954; Email: swyxgccom.
Corresponding author: He Gong, Tel: 86-13844801003; Email: gongheedu.cn Or Dong Zhu, Tel: 86-13500805954; Email: swyxgccom.