Impact Factor ISSN: 1449-1907




Int J Med Sci 2026; 23(12):3744-3753. doi:10.7150/ijms.140009 This issue Cite
Research Paper
Metabolic Obesity Phenotypes, Prevalent Kidney Abnormalities, and the Distribution of PREVENT-Estimated 10-year ASCVD Risk in a Community-Based Population: A Cross-Sectional Study
Sheng-Kai Hu1#, Yi-Chun Tsai2,3,4,5,6#, Hong-Wei Lin1, Ping-Shaou Yu2,3, Jong-Rung Tsai7, Lii-Jia Yang3,4, Chung-Ting Cheng2,8, Hui-Ju Tsai9,10 
1. Department of Clinical Education and Training, Kaohsiung Medical University Hospital, Kaohsiung Medical University, Kaohsiung, Taiwan.
2. Division of Nephrology, Department of Internal Medicine, Kaohsiung Medical University Hospital, Kaohsiung Medical University, Kaohsiung, Taiwan.
3. Department of Internal Medicine, Kaohsiung Municipal Cijin Hospital, Kaohsiung, Taiwan.
4. Division of General Medicine, Kaohsiung Medical University, Kaohsiung Medical University Hospital, Kaohsiung, Taiwan.
5. Department of Internal Medicine, School of Medicine, College of Medicine, Kaohsiung Medical University, Kaohsiung, Taiwan.
6. Center for Metabolic Disorders and Obesity, Kaohsiung Medical University, Kaohsiung, Taiwan.
7. Division of Pulmonary and Critical Care Medicine, Department of Internal Medicine Kaohsiung Medical University, Kaohsiung Medical University Hospital, Kaohsiung, Taiwan.
8. Department of Internal Medicine, Kaohsiung Municipal Siaogang Hospital, Kaohsiung Medical University, Kaohsiung, Taiwan.
9. Department of Family Medicine, Kaohsiung Medical University Hospital, Kaohsiung Medical University, Kaohsiung, Taiwan.
10. Department of Family Medicine, School of Medicine, College of Medicine, Kaohsiung Medical University, Kaohsiung, Taiwan.
# Equal contribution.
Received 2026-6-28; Accepted 2026-10-29; Published 2026-11-13
Abstract
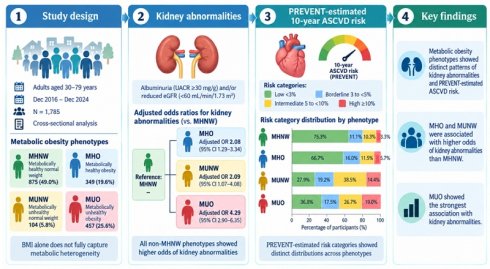
Introduction: Obesity and metabolic syndrome encompass heterogeneous metabolic phenotypes that are not fully captured by body mass index (BMI) alone. Notably, metabolically healthy obesity (MHO) and metabolically unhealthy normal weight (MUNW) represent discordant states between adiposity and metabolic health. However, their associations with prevalent kidney abnormalities remain incompletely characterized, and the distribution of model-estimated cardiovascular risk across these phenotypes has been less well described.
Methods: This cross-sectional study enrolled adults aged 30-79 years between December 2016 and December 2024 and classified them into four groups: metabolically healthy normal weight (MHNW), MUNW, MHO, and metabolically unhealthy obesity (MUO). Kidney abnormalities were defined as albuminuria (urine albumin-to-creatinine ratio ≥30 mg/g) and/or reduced estimated glomerular filtration rate (<60 mL/min/1.73 m²). The Predicting Risk of CVD EVENTs (PREVENT) equation was used separately to estimate 10-year atherosclerotic cardiovascular disease (ASCVD) risk, which was categorized as low (< 3%), borderline (3 to < 5%), intermediate (5 to < 10%), or high (≥ 10%).
Results: A total of 1785 participants were included (mean age, 50.9±12.5 years; mean BMI, 25.0±4.1 kg/m2; 37.4% male), comprising 875 (49.0%) with MHNW, 349 (19.6%) with MHO, 104 (5.8%) with MUNW, and 457 (25.6%) with MUO. Compared with the MHNW, all other phenotypes were associated with higher odds of albuminuria and/or reduced eGFR, with the largest association observed for MUO, followed by MUNW and MHO (adjusted odds ratio (OR) (95% confidence interval (CI)): 4.29 (2.90-6.35), 2.09 (1.07-4.08), and 2.08 (1.29-3.34), respectively). PREVENT-estimated ASCVD risk categories showed different descriptive distributions across phenotypes. MHNW and MHO were predominantly classified as low risk, whereas MUNW had the highest proportion of participants in the intermediate-risk category and MUO had the highest proportion in the high-risk category.
Conclusion: Metabolic obesity phenotypes were differentially associated with prevalent kidney abnormalities and showed distinct distributions of PREVENT-estimated 10-year ASCVD risk. Prospective studies with incident clinical outcomes are needed to determine the long-term clinical significance of these phenotypes.
Keywords: metabolic obesity phenotypes, obesity, metabolic syndrome, atherosclerotic cardiovascular disease, kidney dysfunction
Introduction
Obesity and metabolic syndrome are major and growing public health challenges worldwide. In 2022, approximately 890 million adults were living with obesity, accounting for nearly one in eight people globally [1]. Metabolic syndrome, characterized by central adiposity, hypertension, dyslipidemia, and impaired glucose metabolism, is also highly prevalent and affects approximately one-third of adults in Taiwan [2, 3]. Both conditions are closely linked to cardiovascular and kidney diseases through shared mechanisms such as insulin resistance, chronic inflammation, and oxidative stress [4-6].
Importantly, obesity and metabolic dysfunction do not always coexist. Some individuals with obesity maintain a relatively favorable metabolic profile, whereas others with normal body weight exhibit multiple metabolic abnormalities. This discordance has led to the classification of four metabolic obesity phenotypes: metabolically healthy normal weight (MHNW), metabolically healthy obesity (MHO), metabolically unhealthy normal weight (MUNW), and metabolically unhealthy obesity (MUO) [7]. Notably, “metabolically healthy” is an operational classification that depends on the criteria used and does not necessarily indicate the complete absence of metabolic abnormalities.
Previous studies have reported inconsistent associations between metabolic obesity phenotypes and cardiovascular or kidney-related outcomes [8-10]. Metabolically unhealthy phenotypes have generally been associated with less favorable cardiorenal profiles, whereas the clinical implications of MHO remain less consistent across studies. Such heterogeneity may reflect differences in study design, population characteristics, ethnicity, definitions of obesity and metabolic health, and outcome ascertainment [8-10].
Despite growing interest in these phenotypes, their relationships with kidney abnormalities and cardiovascular risk have not been fully characterized in community-based populations. Prevalent albuminuria and reduced estimated glomerular filtration rate (eGFR) represent directly measured kidney abnormalities, whereas Predicting Risk of CVD EVENTs (PREVENT) estimates 10-year atherosclerotic cardiovascular disease (ASCVD) risk based on a prediction model rather than observed cardiovascular events. Therefore, in this cross-sectional analysis of the CiJin study, we examined the associations of metabolic obesity phenotypes with prevalent albuminuria and reduced eGFR and the distribution of PREVENT-estimated 10-year ASCVD risk across phenotypes in a community-based Taiwanese population.
Materials and Methods
Study participants
This cross-sectional analysis included participants from the CiJin cohort, a community-based prospective observational cohort established in Cijin District, Kaohsiung, Taiwan. The cohort has recruited adult residents aged ≥ 18 years on a voluntary basis using a non-probability, community-based sampling approach since December 2016. Because the number of residents invited or declining participation was not recorded, the participation rate could not be calculated. Individuals with severe psychiatric illness precluding reliable questionnaire completion, recent acute illness or infection within the preceding week, acute traumatic injury, or a history of major organ transplantation were not eligible for cohort enrollment. Demographic, clinical, biochemical, and electronic medical record data were collected using standardized procedures.
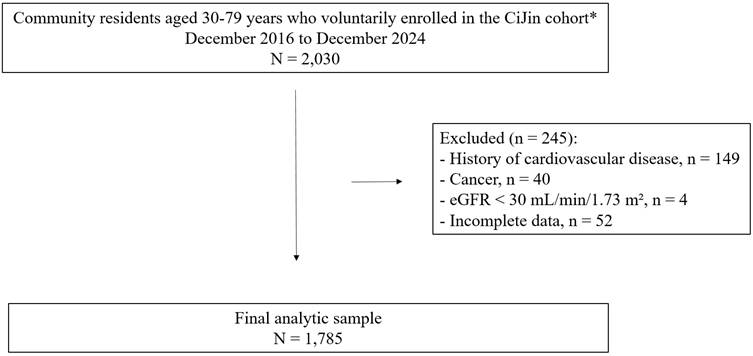
For the present study, 2030 participants aged 30-79 years who were enrolled between December 2016 and December 2024 were considered for analysis. Participants were excluded if they had a history of cancer (n = 40), cardiovascular disease (CVD; n = 149), an eGFR < 30 mL/min/1.73 m² (n = 4), or incomplete data required for the analysis (n = 52). The eGFR was calculated using the 2021 Chronic Kidney Disease Epidemiology Collaboration (CKD-EPI) equation. Participants with eGFR < 30 mL/min/1.73 m² were excluded because the present analysis focused on metabolic obesity phenotypes in a community-based population without advanced kidney dysfunction. After these exclusions, 1,785 participants were included in the final analysis (Figure 1). The study protocol was approved by the Institutional Review Board of Kaohsiung Medical University Hospital (KMUHIRB-G(I)-20160025), and all participants provided written informed consent.
Flowchart of participant selection for the present cross-sectional analysis. *Participants were recruited voluntarily from the community using a non-probability sampling approach. Because the number of residents invited or declining participation was not recorded, a screening denominator and participation rate were not available.
Sample and clinical data collection
The participants were asked to complete questionnaires regarding their medical history, demographic information, and lifestyle habits, and they also underwent laboratory and physical examinations. BMI was calculated as kg/m². Waist circumference was measured at the midpoint between the rib cage and iliac crest, and hip circumference was measured at the widest point over the hips or buttocks.
Samples of venous blood (~10 mL) were taken, placed into serum separator and EDTA-containing tubes, and then centrifuged within 30 minutes of collection. Biochemical and hematological analyses were then analyzed immediately at the same central laboratory using standardized automated procedures throughout the study period. The instruments were regularly calibrated according to the manufacturers' recommendations, and internal quality-control materials were analyzed routinely. The laboratory also participated in external proficiency-testing programs and was accredited according to ISO15189 standards. Levels of fasting glucose, creatinine, blood urea nitrogen, alanine aminotransferase (ALT), aspartate aminotransferase, uric acid, total cholesterol, high-density lipoprotein (HDL), low-density lipoprotein (LDL), and triglycerides (TGs) were quantified using an Abbott Ci800 automated clinical chemistry analyzer (Abbott Laboratories, Illinois, U.S.). Urinalysis included dipstick testing as well as measurements of urinary albumin and creatinine concentrations to calculate the urine albumin-to-creatinine ratio (UACR). The 2021 CKD-EPI equation was used to calculate the eGFR as follows: eGFR (mL/min/1.73 m2) = 142 × min (Scr /κ, 1)α× max(Scr /κ, 1)-1.200 × 0.9938Age ×1.012 [if female] [11].
Where: κ = 0.7 for females and 0.9 for males; α = -0.241 for females and -0.302 for males; Scr = serum creatinine (mg/dL).
Definition of metabolic health status and phenotypes of obesity
Metabolic health status was determined based on the standardized definition of metabolic syndrome according to the modified National Cholesterol Education Program Adult Treatment Panel III for Asians [12, 13] as meeting three or more of the following criteria: (1) waist circumference > 90 cm in men or > 80 cm in women, (2) blood pressure ≥ 130/85 mmHg or the use of antihypertensive medications, (3) fasting glucose level ≥ 100 mg/dL or the use of antidiabetic medications, (4) fasting TG level ≥ 150 mg/dL or the use of lipid-lowering agents for high TG, and (5) HDL-C < 40 mg/dL in men or < 50 mg/dL in women. Participants with metabolic syndrome were classified as metabolically unhealthy. Metabolically healthy in the primary analysis referred specifically to the absence of metabolic syndrome rather than the complete absence of metabolic abnormalities. Accordingly, participants with one or two metabolic abnormalities, including diabetes or treated hypertension, could still be classified as metabolically healthy if they did not meet the criteria for metabolic syndrome. Obesity was defined as a BMI ≥ 25 kg/m2 according to the Asia-Pacific criteria. According to metabolic health and obesity status, obesity phenotypes were classified into four groups: MHNW (reference group), MUNW, MHO, and MUO.
Evaluation of kidney abnormalities and predicting risk of CVD EVENTs (PREVENT)-estimated 10-year atherosclerotic cardiovascular disease (ASCVD) risk
Kidney abnormalities were evaluated according to eGFR and UACR. Prevalent kidney abnormalities were defined as albuminuria (UACR ≥ 30 mg/g) and/or reduced eGFR (< 60 mL/min/1.73 m²) at the study assessment based on the 2024 Kidney Disease: Improving Global Outcomes guidelines [14]. Because these measurements were obtained at a single study assessment, persistence for at least 3 months could not be confirmed and CKD was not diagnosed. We used the Predicting Risk of CVD EVENTs (PREVENT) equations to estimate the 10-year risk of ASCVD in adults aged 30 to 79 years without CVD at baseline [15]. The 10-year ASCVD risk was estimated using the base PREVENT-ASCVD equation, which incorporates age, sex, systolic blood pressure, HDL-C, total cholesterol, diabetes status, current smoking status, antihypertensive medication use, statin use, and eGFR. Optional predictors, including UACR, glycated hemoglobin, and the social deprivation index, were not included. PREVENT-ASCVD 10-year risk levels are categorized as low (< 3%), borderline (3 to < 5%), intermediate (5 to < 10%), or high (≥ 10%) according to the 2026 ACC/AHA dyslipidemia guideline [16]. These categories were used to describe the distribution of calculated risk.
Statistical analysis
Continuous variables and PREVENT-estimated 10-year ASCVD risk were presented as mean (standard deviation) or median (interquartile range), as appropriate, and categorical variables as number (percentage). Given the overlap between metabolic-health criteria and PREVENT predictors, PREVENT-estimated 10-year ASCVD risk was analyzed descriptively. Comparisons among metabolic obesity phenotypes were performed using one-way analysis of variance (ANOVA) or Kruskal-Wallis test for continuous variables and the chi-square test for categorical variables. Multivariable logistic regression models were used to examine the cross-sectional association between the metabolic obesity phenotypes and kidney abnormalities, with adjustments for potentially confounding variables including age, sex, and smoking. Sensitivity analyses were performed to evaluate the robustness of the findings. First, the kidney analyses were repeated without excluding participants with eGFR < 30 mL/min/1.73 m² to assess whether restriction of the kidney-function spectrum materially affected the results. Second, metabolic phenotypes were reclassified using a more stringent definition of metabolic health, requiring the absence of all individual metabolic syndrome components, and the analyses were repeated using this alternative classification. Statistical analyses were performed using SPSS version 22.0 (IBM Corp., Armonk, NY, USA). A two-sided P value < 0.05 was considered statistically significant.
Results
Baseline characteristics of the study participants according to obesity phenotype
The clinical characteristics of the study cohort grouped by metabolic obesity phenotype are shown in Table 1. A total of 1785 participants were included (mean age, 50.9 ± 12.5 years; mean BMI, 25.0 ± 4.1 kg/m2; 37.4 % male), with 875 (49.0 %), 349 (19.6%), 104 (5.8%) and 457 (25.6%) in the MHNW, MHO, MUNW, and MUO groups, respectively. Of these participants, 19.2% had hypertension, 8.9% had diabetes, and 3.1% had hyperlipidemia. The mean BMI, waist circumference, and hip circumference were 25.0 kg/m2, 83.7 cm, and 95.3 cm, respectively. The mean serum HDL and eGFR levels were 56.3 mg/dL and 101.3 mL/min/1.73 m2, respectively. The median glucose, TG, UACR and PREVENT-ASCVD 10-year risk were 98 mg/dL, 93.0 mg/dL, 4.5 mg/g, and 2.0% respectively.
Clinical characteristics of the study population categorized by four metabolic obesity phenotype groups
| Metabolically healthy normal weight (MHNW) | Metabolically healthy obesity (MHO) | Metabolically unhealthy normal weight (MUNW) | Metabolically unhealthy obesity (MUO) | |||
|---|---|---|---|---|---|---|
| Variables | All cohort (n = 1785) | BMI < 25, no Mets (N = 875, 49.0%) | BMI ≥ 25, no Mets (N = 349, 19.6%) | BMI <2 5, Mets (N = 104, 5.8%) | BMI ≥ 25, Mets (N = 457, 25.6%) | p-value |
| Clinical characteristics | ||||||
| Age, years | 50.9 ± 12.5 | 48.4 ± 12.2 | 50.4 ± 12.3 | 57.3 ± 9.5 | 55.0 ± 12.5 | < 0.001 |
| Man, n (%) | 667 (37.4) | 267 (30.5) | 165 (47.3) | 42 (40.4) | 193 (42.2) | < 0.001 |
| Smoke, n (%) | 299 (16.8) | 135 (15.4) | 51 (14.6) | 24 (23.1) | 89 (19.5) | 0.057 |
| Alcohol, n (%) | 207 (11.6) | 102 (11.7) | 38 (10.9) | 13 (12.5) | 54 (11.8) | 0.97 |
| Hypertension, n (%) | 343 (19.2) | 82 (9.4) | 48 (13.8) | 32 (30.8) | 181 (39.6) | < 0.001 |
| Diabetes mellitus, n (%) | 158 (8.9) | 28 (3.2) | 15 (4.3) | 24 (23.1) | 91 (19.9) | < 0.001 |
| Hyperlipidemia, n (%) | 55 (3.1) | 16 (1.8) | 9 (2.6) | 8 (7.7) | 22 (4.8) | < 0.001 |
| Antihypertensive medication, n (%) | 311 (17.4) | 71 (8.1) | 42 (12.0) | 30 (28.8) | 168 (36.8) | < 0.001 |
| Antidiabetic medication, n (%) | 142 (8.0) | 26 (3.0) | 12 (3.4) | 21 (20.2) | 83 (18.2) | < 0.001 |
| Statin, n (%) | 20 (1.1) | 7 (0.8) | 5 (1.4) | 1 (1.0) | 7 (1.5) | 0.62 |
| SBP (mmHg) | 125.6 ± 19.7 | 118.8 ± 18.5 | 125.3 ± 17.1 | 135.6 ± 17.2 | 136.5 ± 18.7 | < 0.001 |
| DBP (mmHg) | 79.8 ± 14.0 | 76.0 ± 13.6 | 81.0 ± 13.5 | 84.1 ± 12.8 | 85.1 ± 13.5 | < 0.001 |
| Metabolic index | ||||||
| BMI (kg/m2) | 25.0 ± 4.1 | 21.9 ± 2.0 | 27.5 ± 2.3 | 23.0 ± 1.6 | 29.4 ± 3.4 | < 0.001 |
| Waist circumference (cm) | 83.7 ± 10.0 | 77.1 ± 6.1 | 89.3 ± 7.3 | 80.6 ± 6.3 | 92.8 ± 8.8 | < 0.001 |
| Hip circumference (cm) | 95.3 ± 5.7 | 92.9 ± 4.0 | 98.0 ± 5.9 | 92.1 ± 4.0 | 98.7 ± 6.1 | < 0.001 |
| Laboratory data | ||||||
| Fasting glucose (mg/dL) | 98.0 (90.0, 105.0) | 94.0 (88.0, 100.0) | 95.0 (89.0, 99.0) | 107.0 (100.0,127.5) | 106.0 (100.0, 119.5) | < 0.001 |
| Total cholesterol (mg/dL) | 205.4 ± 40.8 | 206.4 ± 39.0 | 206.8 ± 40.0 | 208.7 ± 47.5 | 201.6 ± 42.8 | 0.34 |
| HDL (mg/dL) | 56.3 ± 14.9 | 62.4 ± 14.5 | 57.3 ± 12.5 | 46.6 ± 11.5 | 46.3 ± 11.1 | < 0.001 |
| LDL (mg/dL) | 122.7 ± 35.6 | 121.4 ± 33.9 | 127.3 ± 36.1 | 119.7 ± 42.1 | 122.3 ± 36.6 | 0.001 |
| Triglyceride (mg/dL) | 93.0 (62.0, 142.0) | 73.0 (51.0, 102.0) | 89.0 (66.0, 120.0) | 177.5 (129.5, 244.5) | 153 (101.0, 202.0) | < 0.001 |
| Uric acid (mg/dL) | 5.6 ± 1.8 | 5.3 ± 2.2 | 5.8 ± 1.4 | 6.0 ± 1.4 | 6.2 ± 1.4 | < 0.001 |
| AST (IU/L) | 22.0 (19.0, 27.0) | 21.0 (18.0, 25.0) | 23.0 (19.0, 27.0) | 25.0 (21.0, 29.8) | 24.0 (20.0, 30.0) | < 0.001 |
| ALT (IU/L) | 22.0 (17.0, 30.0) | 19.0 (15.0, 25.0) | 25.0 (19.0, 32.0) | 25.0 (19.0, 33.0) | 28.0 (21.0, 39.0) | < 0.001 |
| Serum creatinine (mg/dL) | 0.8 ± 0.2 | 0.7 ± 0.2 | 0.8 ± 0.2 | 0.8 ± 0.2 | 0.8 ± 0.2 | < 0.001 |
| eGFR (mL/min/1.73 m2) | 101.3 ± 15.5 | 104.4 ± 13.8 | 101.3 ± 14.5 | 97.5 ± 14.6 | 96.3 ± 18.0 | < 0.001 |
| UACR (mg/g) | 4.5 (2.3, 10.2) | 3.7 (2.0, 7.1) | 3.7 (1.9, 9.4) | 7.4 (3.3, 13.9) | 7.6 (3.6, 21.0) | < 0.001 |
| PREVENT ASCVD 10-year risk (%) | 2.0 (0.7, 5.0) | 1.1 (0.4, 3.0) | 1.7 (0.8, 3.8) | 5.1 (2.8, 8.6) | 4.5 (2.1, 7.7) | < 0.001 |
Abbreviations: AST, aspartate aminotransferase; ALT, alanine aminotransferase; ASCVD: atherosclerotic cardiovascular disease; BMI: body mass index; DM, diabetes mellitus; DBP, diastolic blood pressure; eGFR, estimated glomerular filtration rate; HDL, high-density lipoprotein; LDL, low-density lipoprotein; Mets, metabolic syndrome; PREVENT, Predicting Risk of CVD EVENTs; SBP, systolic blood pressure; UACR, urine albumin-to-creatinine ratio
The participants in the MUO group had a higher prevalence of hypertension, higher systolic blood pressure and diastolic blood pressure, BMI, waist circumference, hip circumference, uric acid, ALT and UACR, and lower HDL and eGFR levels than the other groups. Participants in the MUNW group were older and had a higher prevalence of diabetes and hyperlipidemia, higher TG levels, and higher PREVENT-estimated 10-year ASCVD risk than participants in the metabolically healthy groups. Participants in the MHO group had the highest proportion of men and the highest LDL-C level (Table 1). The distribution and number of individual metabolic syndrome components across metabolic obesity phenotypes are presented in Supplementary Table 1. Participants classified as metabolically healthy could still have one or two individual metabolic abnormalities.
Relationship between metabolic obesity phenotypes and kidney abnormalities
Table 2 shows the associations between metabolic obesity phenotypes and kidney abnormalities. Compared with the MHNW group, the crude odds of the composite kidney abnormality, defined as UACR ≥ 30 mg/g or eGFR < 60 mL/min/1.73 m2, were higher in the MHO (OR: 2.19, 95% confidence interval (CI):1.37-3.50, p < 0.001), MUNW (OR: 2.83, 95% CI: 1.47-5.48, p = 0.002), and MUO groups (OR: 5.39, 95% CI: 3.68-7.91, p < 0.001). After adjustment for age, sex, and smoking history, these associations remained significant, with adjusted ORs of 2.08 (95% CI: 1.29-3.34, p = 0.002) for MHO, 2.09 (95% CI: 1.07-4.08, p = 0.03) for MUNW, and 4.29 (95% CI: 2.90-6.35, p < 0.001) for MUO. Similar associations were observed for albuminuria alone. Compared with MHNW, the adjusted ORs for UACR ≥ 30 mg/g were 2.18 (95% CI: 1.34-3.55, p = 0.002) for MHO, 2.23 (95% CI: 1.11-4.47, p = 0.02) for MUNW, and 4.32 (95% CI: 2.87-6.51, p < 0.001) for MUO. In additional sensitivity analyses with further adjustment for alcohol use and serum uric acid, the associations remained materially unchanged. For the composite kidney abnormality, the adjusted ORs were 2.13 (95% CI: 1.32-3.43, p = 0.002) for MHO, 2.10 (95% CI: 1.07-4.11, p = 0.03) for MUNW, and 4.21 (95% CI: 2.83-6.27, p < 0.001) for MUO. Similar results were observed for albuminuria (Supplementary Table 2).
Associations between metabolic obesity phenotypes and prevalent kidney abnormalities in the study cohort
| Event N (%) | Crude OR | P value | Adjusted OR1 | P value | |
|---|---|---|---|---|---|
| (95% CI) | (95% CI) | ||||
| UACR ≥ 30 mg/g or eGFR < 60 mL/min/1.73 m2 | 187 (10.5) | ||||
| Metabolically healthy normal weight | 42 (4.8) | 1.00 (Reference) | 1.00 (Reference) | ||
| Metabolically healthy obesity | 35 (10.0) | 2.19 (1.37-3.50) | < 0.001 | 2.08 (1.29-3.34) | 0.002 |
| Metabolically unhealthy normal weight | 13 (12.5) | 2.83 (1.47-5.48) | 0.002 | 2.09 (1.07-4.08) | 0.03 |
| Metabolically unhealthy obesity | 97 (21.2) | 5.39 (3.68-7.91) | < 0.001 | 4.29 (2.90-6.35) | < 0.001 |
| UACR ≥ 30 mg/g | 170 (9.5) | ||||
| Metabolically healthy normal weight | 38 (4.3) | 1.00 (Reference) | 1.00 (Reference) | ||
| Metabolically healthy obesity | 33 (9.5) | 2.28 (1.41-3.70) | 0.001 | 2.18 (1.34-3.55) | 0.002 |
| Metabolically unhealthy normal weight | 12 (11.5) | 2.87 (1.45-5.70) | 0.003 | 2.23 (1.11-4.47) | 0.02 |
| Metabolically unhealthy obesity | 87 (19.0) | 5.23 (3.50-7.80) | < 0.001 | 4.32 (2.87-6.51) | < 0.001 |
| eGFR < 60 mL/min/1.73 m2# | 35 (2.0) | ||||
| Metabolically healthy normal weight | 8 (0.9) | 1.00 (Reference) | 1.00 (Reference) | ||
| Metabolically healthy obesity | 4 (1.1) | 1.33 (0.42-4.20) | 0.63 | 1.13 (0.36-3.58) | 0.84 |
| Metabolically unhealthy normal weight | 2 (1.9) | 2.49 (0.60-10.41) | 0.21 | 1.49 (0.35-6.23) | 0.59 |
| Metabolically unhealthy obesity | 21 (4.6) | 5.03 (2.25-11.22) | < 0.001 | 2.60 (1.14-5.90) | 0.02 |
Abbreviations: eGFR, estimated glomerular filtration rate; UACR, urine albumin-to-creatinine ratio
1 Adjusted model: age, sex, smoking
# For reduced eGFR, crude and adjusted ORs were estimated using Firth penalized logistic regression.
Because only 35 participants had reduced eGFR (< 60 mL/min/1.73 m²), including 4 in the MHO group, 2 in the MUNW group, and 21 in the MUO group, associations with reduced eGFR were further evaluated using Firth penalized logistic regression to reduce small-sample bias. The adjusted model included six predictor parameters, corresponding to approximately 5.8 events per parameter. Although the adjusted estimate for MUO reached statistical significance (OR: 2.60, 95% CI: 1.14-5.90, p = 0.02), the limited number of reduced-eGFR events was reflected in wide confidence intervals for the phenotype-specific estimates.
In a sensitivity analysis that retained participants with eGFR < 30 mL/min/1.73 m², four additional participants were included (N = 1789), and the findings were materially unchanged. Compared with MHNW, the adjusted ORs for the composite kidney abnormality were 1.98 (95% CI: 1.24-3.17, p = 0.004) for MHO, 1.97 (95% CI: 1.01-3.85, p = 0.046) for MUNW, and 4.15 (95% CI: 2.82-6.10, p < 0.001) for MUO. Similar results were observed for albuminuria (Supplementary Table 3). Using a stricter definition of metabolic health, MUO remained significantly associated with the composite kidney abnormality (adjusted OR: 4.60; 95% CI: 2.41-8.78) and albuminuria (adjusted OR: 4.88; 95% CI: 2.48-9.60), whereas the associations for MHO and MUNW were attenuated. For reduced eGFR, Firth penalized logistic regression was used because of sparse events, and no adjusted phenotype-specific associations were statistically significant (Supplementary Table 4).
Distribution of PREVENT-estimated 10-year ASCVD risk across metabolic obesity phenotypes
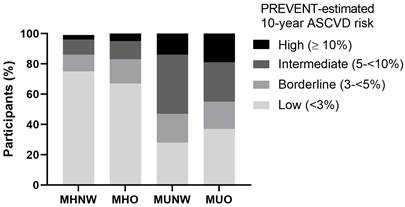
Table 3 presents the distribution of PREVENT-estimated 10-year ASCVD risk across metabolic obesity phenotypes. Median risk estimates differed significantly among the four phenotypes (p < 0.001), as did the overall distribution of risk categories (Pearson χ² = 287.22, df = 9, p < 0.001). The majority of participants with MHNW and MHO were classified as low risk (< 3%), accounting for 75.3 % and 66.7 % of these groups, respectively, compared with 36.8 % of MUO and 27.9 % of MUNW participants. Borderline risk (3% to < 5%) was observed in 11.1 % of MHNW, 16.0 % of MHO, 17.5 % of MUO, and 19.2 % of MUNW participants. In contrast, the intermediate-risk category (5% to < 10%) was most frequent in MUNW (38.5 %), followed by MUO (26.7 %), MHO (11.5 %), and MHNW (10.3 %). High estimated risk (≥ 10%) was most common in the MUO group (19.0 %), followed by MUNW (14.4 %), MHO (5.7 %), and MHNW (3.3 %). The distribution of PREVENT-estimated 10-year ASCVD risk categories across metabolic obesity phenotypes is further illustrated in Figure 2.
Distribution of PREVENT-estimated 10-year ASCVD risk categories across metabolic obesity phenotypes. Stacked bar chart showing the distribution of PREVENT-estimated 10-year ASCVD risk categories across metabolic obesity phenotypes including (1) metabolically healthy normal weight (MHNW), (2) metabolically healthy obesity (MHO), (3) metabolically unhealthy normal weight (MUNW), (4) metabolically unhealthy obesity (MUO). Risk categories were defined as low (<3%), borderline (3 to <5%), intermediate (5 to <10%), and high (≥10%).
Distribution of PREVENT-estimated 10-year ASCVD risk according to metabolic obesity phenotypes
| Metabolically healthy normal weight (MHNW) (N = 875) | Metabolically healthy obesity (MHO) (N = 349) | Metabolically unhealthy normal weight (MUNW) (N = 104) | Metabolically unhealthy obesity (MUO) (N = 457) | P value3 | |
|---|---|---|---|---|---|
| PREVENT ASCVD 10-year risk, %, Median (IQR)1 | 1.1 (0.4-3.0) | 1.7 (0.8-3.8) | 5.1 (2.8-8.6) | 4.5 (2.1-7.7) | < 0.001 |
| Low risk (< 3%), N (%)2 | 659 (75.3) | 233 (66.7) | 29 (27.9) | 168 (36.8) | < 0.001 |
| Borderline risk (3 to < 5%), N (%)2 | 97 (11.1) | 56 (16.0) | 20 (19.2) | 80 (17.5) | |
| Intermediate risk (5 to < 10%), N (%)2 | 90 (10.3) | 40 (11.5) | 40 (38.5) | 122 (26.7) | |
| High risk (≥ 10%), N (%)2 | 29 (3.3) | 20 (5.7) | 15 (14.4) | 87 (19.0) |
Abbreviations: ASCVD, atherosclerotic cardiovascular disease; PREVENT, Predicting Risk of CVD EVENTs.
¹ Data are presented as median (interquartile range).
² Data are presented as number (percentage).
³ P values were calculated using the Kruskal-Wallis test for continuous PREVENT-estimated risk and the Pearson chi-square test for the overall distribution of risk categories. Risk categories were defined according to the 2026 ACC/AHA dyslipidemia guideline [16].
Discussion
In this community-based cross-sectional study, metabolic obesity phenotypes showed distinct patterns of kidney abnormalities and PREVENT-estimated 10-year ASCVD risk. Compared with MHNW, MUO was most strongly associated with composite kidney abnormalities, while MUNW and MHO also showed higher odds of kidney abnormalities. These associations were largely driven by albuminuria. Metabolic obesity phenotypes also differed substantially in PREVENT-estimated 10-year ASCVD risk distribution. MHNW and MHO were predominantly classified as low risk, whereas MUNW was more frequently represented in the intermediate-risk category and MUO in the high-risk category. Because PREVENT incorporates several variables that also contribute to the classification of metabolic health, these findings primarily describe the distribution of model-estimated cardiovascular risk across phenotypes. Collectively, our findings demonstrate substantial heterogeneity in prevalent kidney abnormalities and model-estimated cardiovascular risk across metabolic obesity phenotypes.
Several studies have reported heterogeneous associations between metabolic obesity phenotypes and kidney or cardiovascular outcomes [8, 17-24]. An important finding of the present study was that MUNW was associated with a higher prevalence of kidney abnormalities, particularly albuminuria, despite normal BMI. This finding is consistent with previous observations that normal body weight does not necessarily indicate a favorable metabolic health [20, 23]. Individuals with MUNW may have insulin resistance, visceral or ectopic fat accumulation, chronic low-grade inflammation, oxidative stress, and endothelial dysfunction despite having a BMI within the normal range [20, 24]. Moreover, BMI does not adequately reflect body composition, visceral adiposity, ectopic fat deposition, or sarcopenic obesity. These observations present the heterogeneity that may exist within BMI categories and suggest that metabolic abnormalities provide complementary information beyond body weight alone [20, 23, 25].
MHO also showed a distinct pattern in the present study. Compared with MHNW, individuals with MHO had higher odds of the composite kidney abnormalities, primarily albuminuria. Several obesity-related mechanisms, including glomerular hyperfiltration, activation of the renin-angiotensin-aldosterone system, adipokine dysregulation, ectopic lipid accumulation, and subclinical inflammation may contribute to early kidney injury even in the absence of overt metabolic disease [20, 26]. This finding is consistent with accumulating evidence that MHO may not be entirely benign with respect to kidney health [8, 22, 26]. A recent meta-analysis of eight prospective cohorts including approximately five million participants reported a higher risk of incident CKD among individuals with MHO than those with MHNW [22], and another meta-analysis similarly demonstrated an increased CKD risk associated with MHO [26].
The cardiovascular implications of MHO remain less consistent across studies. A Taiwanese cohort reported a higher incidence of CVD among individuals with MHO than among those with MHNW [27], and an Asian meta-analysis similarly found an increased cardiovascular risk associated with MHO [28]. In contrast, an 18-year Tehran cohort found no significant increase in incident CVD when metabolic phenotype was treated as a time-varying exposure [18], while a Korean community-based study using a stricter definition of metabolic health reported no significant association between MHO and subclinical carotid atherosclerosis [29]. Cross-sectional evidence from Chinese adults has also shown higher model-estimated 10-year CVD risk among individuals with MHO [24]. In the present study, most participants with MHO were classified in the low PREVENT-estimated ASCVD risk category, although the distribution extended across all risk categories. Because PREVENT model incorporates several variables that overlap with the definition of metabolic health, this pattern primarily reflects the distribution of model-estimated cardiovascular risk rather than observed cardiovascular outcomes. Taken together, the clinical implications of MHO appear to depend on the definition of metabolic health and the type of cardiovascular outcome assessed. Nevertheless, our kidney findings and previous evidence suggest that MHO should not be regarded as a uniformly benign phenotype, particularly with respect to kidney abnormalities.
These findings may also be considered within the broader cardiovascular-kidney-metabolic (CKM) framework, which emphasizes the biological and clinical interrelationships among metabolic dysfunction, kidney abnormalities, and cardiovascular disease [30, 31]. However, the kidney and cardiovascular domains were assessed differently in our study. Albuminuria and reduced eGFR represented directly measured kidney abnormalities, whereas PREVENT provided model-derived estimates of 10-year ASCVD risk rather than observed cardiovascular events. Moreover, the overlap between metabolic-health criteria and PREVENT predictors further limits interpretation of the PREVENT distribution as an independent cardiovascular finding. Therefore, the differences observed across metabolic obesity phenotypes should be interpreted as heterogeneity across related but distinct clinical domains, rather than as evidence of a unified cardiorenal-risk phenotype or of future cardiovascular prognosis. This distinction is particularly important given that previous studies have evaluated markedly different endpoints, including prevalent or incident CKD, subclinical atherosclerosis, model-estimated cardiovascular risk, and clinically observed cardiovascular events, which are not directly comparable [8, 18, 22-24, 26-29].
Differences in the operational definitions of metabolic health and obesity may further explain the heterogeneity across studies. Numerous criteria have been used to define MHO, with substantial variation in the number and type of metabolic abnormalities permitted [32, 33]. In the present study, metabolic health in the primary analysis was defined as the absence of metabolic syndrome and therefore allowed the presence of one or two individual metabolic abnormalities. The term “metabolically healthy” should therefore be interpreted as an operational research classification rather than the complete absence of clinically relevant metabolic abnormalities. When a stricter definition requiring the absence of metabolic syndrome, diabetes, and treated hypertension was applied, the associations for MHO and MUNW were attenuated and less precise, whereas the association for MUO remained more consistent. These findings highlight the strong influence of the metabolic-health definition on phenotype classification and its clinical interpretation.
In addition, metabolic obesity phenotypes should be regarded as dynamic rather than fixed states. Ethnic differences in body-fat distribution may contribute to variation in phenotype classification and associated outcomes [4, 8, 24], while longitudinal studies have demonstrated frequent transitions between metabolically healthy and unhealthy states, particularly from MHO to MUO [34]. Consequently, a phenotype assigned at a single time point may not adequately reflect long-term metabolic status. Prospective studies incorporating repeated phenotype assessment together with incident kidney and cardiovascular outcomes are therefore needed to determine the long-term clinical implications of these metabolic obesity phenotypes.
This study has several limitations. First, the cross-sectional design does not determine temporal or causal relationships between metabolic obesity phenotypes and kidney or cardiovascular abnormalities. Metabolic phenotypes may also change over time, but such transitions could not be evaluated in the present analysis. Albuminuria and reduced eGFR were assessed at a single time point. Therefore, persistence for at least three months could not be confirmed, and the kidney findings should be interpreted as prevalent abnormalities rather than established CKD. Second, cardiovascular risk was estimated using the PREVENT 10-year ASCVD risk equation rather than observed incident cardiovascular events. The calibration and discrimination of PREVENT have not been fully established in Taiwanese community-based populations, and several variables used to characterize metabolic health overlap with components of the PREVENT equation. Accordingly, the observed differences across phenotypes primarily represent descriptive variation in model-estimated cardiovascular risk rather than independent prognostic associations. Third, the number of participants with reduced eGFR was relatively small, resulting in limited precision for phenotype-specific estimates. Although Firth penalized logistic regression was used to reduce sparse-data bias, these findings should therefore be considered exploratory and hypothesis-generating. In addition, participants with eGFR < 30 mL/min/1.73 m² were excluded from the primary analysis to focus on a community-based population without advanced kidney dysfunction, thereby restricting the range of kidney function. Nevertheless, sensitivity analyses that included these participants yielded materially similar results. Fourth, both obesity and metabolic health were defined using operational criteria that may not fully capture underlying biological heterogeneity. BMI does not directly assess visceral adiposity, body composition, or fat distribution, while the primary definition of metabolic health was based on the absence of metabolic syndrome and therefore allowed the presence of individual metabolic abnormalities. Because phenotype classification varies according to the criteria applied, the observed associations should be interpreted in the context of these definitions. Consistent with this concern, associations for MHO and MUNW were attenuated when a stricter definition of metabolic health was applied, whereas the association for MUO remained more consistent. Fifth, participants were recruited voluntarily from a single community using a non-probability sampling strategy. Because the number of eligible residents who did not participate was unavailable, the participation rate could not be determined. Selection bias may therefore have occurred, and the generalizability of the findings to the broader Taiwanese population or other populations may be limited. Finally, data were collected over more than eight years, during which cardiometabolic treatment practices and risk-factor management may have evolved. Although laboratory measurements were performed in the same central laboratory using standardized procedures, temporal variation cannot be completely excluded. In addition, although information on antihypertensive, antidiabetic, and statin use was available, detailed medication classes, including renin-angiotensin system inhibitors and sodium-glucose co-transporter 2 (SGLT2) inhibitors, were not available. Potential confounding related to unmeasured use of specific renoprotective therapies cannot be excluded. Other potentially relevant factors, such as physical activity, dietary intake, socioeconomic status, and menopausal status, were not comprehensively assessed. Residual confounding therefore remains possible.
Conclusion
Metabolic obesity phenotypes were differentially associated with prevalent kidney abnormalities, with the associations primarily driven by albuminuria. PREVENT-estimated ASCVD risk categories showed different descriptive distributions across phenotypes. These findings highlight the importance of considering metabolic health alongside body size when characterizing cardiometabolic profiles. Prospective studies with repeated phenotype assessment and incident kidney and cardiovascular outcomes are needed to determine their long-term clinical significance.
Supplementary Material
Supplementary tables.

Acknowledgements
The authors gratefully acknowledge the Center for Long-Term Care Research and Metabolic Disorders and Obesity at Kaohsiung Medical University.
Funding
This research was funded by grants from Kaohsiung Medical University, Kaohsiung, Taiwan (NHRIKMU-114-I003), National Science and Technology Council (NSTC 115-2314-B-037-091) and from Kaohsiung Medical University Hospital, Kaohsiung, Taiwan (KMUH113-3R26, KMUH114-4M67).
The funders had no role in study design, data collection and analysis, decision to publish, or preparation of the manuscript.
Author contributions
Conception or design: Hui-Ju Tsai, Yi-Chun Tsai, Jong-Rung Tsai.
Acquisition, analysis, or interpretation of data: Ping-Shaou Yu, Lii-Jia Yang, Chung-Ting Cheng, Yi-Chun Tsai, Hui-Ju Tsai.
Drafting the work or revising: Sheng-Kai Hu, Yi-Chun Tsai, Hong-Wei Lin, Hui-Ju Tsai.
Final approval of the manuscript: Hui-Ju Tsai, Yi-Chun Tsai.
Competing Interests
The authors have declared that no competing interest exists.
References
1. Collaboration NCDRF. Worldwide trends in underweight and obesity from 1990 to 2022: a pooled analysis of 3663 population-representative studies with 222 million children, adolescents, and adults. Lancet. 2024;403:1027-50
2. Saklayen MG. The Global Epidemic of the Metabolic Syndrome. Curr Hypertens Rep. 2018;20:12
3. Chang HC, Yang HC, Chang HY, Yeh CJ, Chen HH, Huang KC. et al. Morbid obesity in Taiwan: Prevalence, trends, associated social demographics, and lifestyle factors. PLoS One. 2017;12:e0169577
4. Tsatsoulis A, Paschou SA. Metabolically Healthy Obesity: Criteria, Epidemiology, Controversies, and Consequences. Curr Obes Rep. 2020;9:109-20
5. Tian S, Bi M, Bi Y, Che X, Liu Y. A Bayesian Network Analysis of the Probabilistic Relationships Between Various Obesity Phenotypes and Cardiovascular Disease Risk in Chinese Adults: Chinese Population-Based Observational Study. JMIR Med Inform. 2022;10:e33026
6. Cӑtoi AF, Parvu AE, Andreicut AD, Mironiuc A, Crӑciun A, Cӑtoi C. et al. Metabolically Healthy versus Unhealthy Morbidly Obese: Chronic Inflammation, Nitro-Oxidative Stress, and Insulin Resistance. Nutrients. 2018 10
7. Eftekharzadeh A, Asghari G, Serahati S, Hosseinpanah F, Azizi A, Barzin M. et al. Predictors of incident obesity phenotype in nonobese healthy adults. Eur J Clin Invest. 2017;47:357-65
8. Jam SA, Moloudpour B, Najafi F, Darbandi M, Pasdar Y. Metabolic obesity phenotypes and chronic kidney disease: a cross-sectional study from the RaNCD cohort study. BMC Nephrol. 2022;23:233
9. Yeh TL, Chen HH, Tsai SY, Lin CY, Liu SJ, Chien KL. The Relationship between Metabolically Healthy Obesity and the Risk of Cardiovascular Disease: A Systematic Review and Meta-Analysis. J Clin Med. 2019 8
10. Tabara Y, Shoji-Asahina A, Ogawa A, Sato Y. Metabolically healthy obesity and risks of cardiovascular disease and all-cause mortality, a matched cohort study: the Shizuoka study. Int J Obes (Lond). 2024;48:1164-9
11. Inker LA, Eneanya ND, Coresh J, Tighiouart H, Wang D, Sang Y. et al. New Creatinine- and Cystatin C-Based Equations to Estimate GFR without Race. N Engl J Med. 2021;385:1737-49
12. Heng D, Ma S, Lee JJ, Tai BC, Mak KH, Hughes K. et al. Modification of the NCEP ATP III definitions of the metabolic syndrome for use in Asians identifies individuals at risk of ischemic heart disease. Atherosclerosis. 2006;186:367-73
13. Alberti KG, Eckel RH, Grundy SM, Zimmet PZ, Cleeman JI, Donato KA. et al. Harmonizing the metabolic syndrome: a joint interim statement of the International Diabetes Federation Task Force on Epidemiology and Prevention; National Heart, Lung, and Blood Institute; American Heart Association; World Heart Federation; International Atherosclerosis Society; and International Association for the Study of Obesity. Circulation. 2009;120:1640-5
14. Kidney Disease. Improving Global Outcomes CKDWG. KDIGO 2024 Clinical Practice Guideline for the Evaluation and Management of Chronic Kidney Disease. Kidney Int. 2024;105:S117-S314
15. Khan SS, Matsushita K, Sang Y, Ballew SH, Grams ME, Surapaneni A. et al. Development and Validation of the American Heart Association's PREVENT Equations. Circulation. 2024;149:430-49
16. Writing Committee M, Blumenthal RS, Morris PB, Gaudino M, Johnson HM, Anderson TS. et al. 2026 ACC/AHA/AACVPR/ABC/ACPM/ADA/AGS/APhA/ASPC/NLA/PCNA Guideline on the Management of Dyslipidemia: A Report of the American College of Cardiology/American Heart Association Joint Committee on Clinical Practice Guidelines. Circulation. 2026;153:e1154-e276
17. Alizadeh S, Esmaeili H, Alizadeh M, Daneshzad E, Sharifi L, Radfar H. et al. Metabolic phenotypes of obese, overweight, and normal weight individuals and risk of chronic kidney disease: a systematic review and meta-analysis. Arch Endocrinol Metab. 2019;63:427-37
18. Kokabeh F, Bahadoran Z, Mahdavi M, Valizadeh M, Barzin M, Azizi F. et al. The association of obesity phenotypes and risk of cardiovascular disease using time-varying and time-invariant approaches: An 18-year follow-up cohort study. Nutr Metab Cardiovasc Dis. 2025;35:103755
19. Lyu YS, Yoon Y, Kim JH, Kim SY. Association Between Incident Chronic Kidney Disease and Body Size Phenotypes in Apparently Healthy Adults: An Observational Study Using the Korean National Health and Nutrition Examination Survey (2019-2021). Biomedicines. 2025 13
20. Yang S, Ling J, Zhang S, Li Y, Yang G. Metabolic dysfunction, rather than obesity, is a risk factor for chronic kidney disease in Chinese population. Aging Male. 2024;27:2335158
21. Khalili S, Safavi-Naini SAA, Zarand P, Masoumi S, Farsi Y, Hosseinpanah F. et al. Metabolic health's central role in chronic kidney disease progression: a 20-year study of obesity-metabolic phenotype transitions. Sci Rep. 2024;14:5244
22. Iqbal J, Wu HX, Nawaz MA, Jiang HL, Xu SN, Huang BL. et al. Risk of incident chronic kidney disease in metabolically healthy obesity and metabolically unhealthy normal weight: A systematic review and meta-analysis. Obes Rev. 2024;25:e13656
23. Molavizadeh D, Masrouri S, Esmaeili F, Azizi F, Hadaegh F. Different Metabolic Phenotypes of Obesity and 2 Decades Risk of Cardio-Renal-Metabolic Multimorbidity: Tehran Lipid and Glucose Study. J Am Heart Assoc. 2025;14:e040930
24. Guo W, Jia J, Zhan M, Li X, Zhu W, Lu J. et al. Association of metabolically unhealthy non-obese and metabolically healthy obese individuals with arterial stiffness and 10-year cardiovascular disease risk: a cross-sectional study in Chinese adults. Nutr J. 2023;22:44
25. Valizadeh A, Nikoohemmat M, Ebadinejad A, Soltani S, Tape PMK, Sohrabi A. et al. Metabolic syndrome as a risk factor for the development of kidney dysfunction: a meta-analysis of observational cohort studies. J Diabetes Metab Disord. 2024;23:215-27
26. Kanbay M, Copur S, Siriopol D, Yildiz AB, Berkkan M, Tuttle KR. et al. The risk for chronic kidney disease in metabolically healthy obese patients: A systematic review and meta-analysis. Eur J Clin Invest. 2023;53:e13878
27. Yeh TL, Hsu HY, Tsai MC, Hsu LY, Hwang LC, Chien KL. Association between metabolically healthy obesity/overweight and cardiovascular disease risk: A representative cohort study in Taiwan. PLoS One. 2021;16:e0246378
28. Huang MY, Wang MY, Lin YS, Lin CJ, Lo K, Chang IJ. et al. The Association between Metabolically Healthy Obesity, Cardiovascular Disease, and All-Cause Mortality Risk in Asia: A Systematic Review and Meta-Analysis. Int J Environ Res Public Health. 2020 17
29. Seo DH, Cho Y, Seo S, Ahn SH, Hong S, Ha KH. et al. Association between Metabolically Healthy Obesity and Subclinical Atherosclerosis in the Cardiovascular and Metabolic Diseases Etiology Research Center (CMERC) Cohort. J Clin Med. 2022 11
30. Ndumele CE, Rangaswami J, Chow SL, Neeland IJ, Tuttle KR, Khan SS. et al. Cardiovascular-Kidney-Metabolic Health: A Presidential Advisory from the American Heart Association. Circulation. 2023;148:1606-35
31. Khan SS, Bhave N, Blumenthal RS, Coresh J, Huang X, Joseph JJ. et al. Use of Predicted Risk and Expected Benefit to Guide Decision-Making in Cardiovascular-Kidney-Metabolic Syndrome for the Primary Prevention of Cardiovascular Disease: A Scientific Statement from the American Heart Association and American College of Cardiology. Circulation. 2026;154:e159-e80
32. Schulze MB, Stefan N. Metabolically healthy obesity: from epidemiology and mechanisms to clinical implications. Nat Rev Endocrinol. 2024;20:633-46
33. Bluher M. Metabolically Healthy Obesity. Endocr Rev. 2020 41
34. Zhang H, Tang X, Hu D, Li G, Song G. Transition patterns of metabolism-weight phenotypes over time: A longitudinal study using the multistate Markov model in China. Front Public Health. 2022;10:1026751
Author contact
Corresponding author: Dr. Hui-Ju Tsai MD, PhD, Department of Family Medicine, Kaohsiung Medical University Hospital, No. 100, Tzyou 1st Rd., Sanmin Dist., Kaohsiung City 807, Taiwan. Email: bankin_0920com.tw; ORCID ID: 0000-0001-9285-772X.