Impact Factor ISSN: 1449-1907




Int J Med Sci 2026; 23(10):3090-3100. doi:10.7150/ijms.126417 This issue Cite
Research Paper
Interplay between Skin Sympathetic Nerve Activity and Gut Microbiota, the Neurocardiac Axis in Acute Coronary Syndrome
Wei-Chung Tsai1,2,3,4, Po Peng5, Pei-Syuan Jhou5,6, Yi-Chun Tsai4,7,8, Wei-Wen Hung4,9, Tien-Chi Huang2, Li-Fang Chou2, Tsung-Hsien Lin2, Chien-Hung Lee10, Bin-Nan Wu11, Shien-Fong Lin12, Wei-Chun Hung4,6 
1. Graduate Institute of Clinical Medicine, College of Medicine, Kaohsiung Medical University, Kaohsiung 807378, Taiwan.
2. Division of Cardiology, Department of Internal Medicine, Kaohsiung Medical University Hospital, Kaohsiung Medical University, Kaohsiung 807377, Taiwan.
3. Faculty of Medicine, College of Medicine, Kaohsiung Medical University, Kaohsiung 807378, Taiwan.
4. Precision Sports Medicine and Health Promotion Center, Kaohsiung Medical University, Kaohsiung 807378, Taiwan.
5. Welgene Biotech. Co., Ltd. Taipei 115603, Taiwan.
6. Department of Microbiology and Immunology, College of Medicine, Kaohsiung Medical University, Kaohsiung 807378, Taiwan.
7. Department of Internal Medicine, Kaohsiung Municipal Cijin Hospital, Kaohsiung 805004, Taiwan.
8. Division of Nephrology, Kaohsiung Medical University Hospital, Kaohsiung Medical University, Kaohsiung 807377, Taiwan.
9. Division of Endocrinology and Metabolism Department of Internal Medicine, Kaohsiung Medical University Hospital, Kaohsiung Medical University, Kaohsiung 807377, Taiwan.
10. Department of Public Health College of Health Science, Kaohsiung Medical University, Kaohsiung 807378, Taiwan.
11. Department of Pharmacology, College of Medicine, Kaohsiung Medical University, Kaohsiung 807378, Taiwan.
12. Institute of Biomedical Engineering, National Yang Ming Chiao Tung University, Hsinchu 300093, Taiwan.
Received 2025-10-8; Accepted 2026-7-6; Published 2026-8-13
Abstract
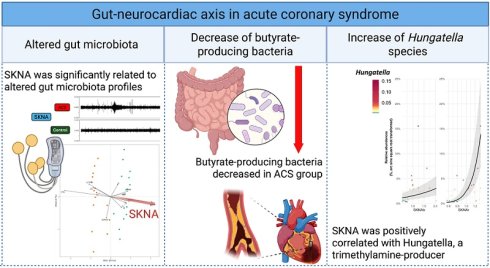
Our previous study demonstrated increased skin sympathetic nerve activity (SKNA) in acute coronary syndrome (ACS) patients and its correlation with ventricular arrhythmias. In the current study, we explored specific gut microbial profiles and their relationships with SKNA in ACS patients. Fifteen ACS patients and age- and sex-matched controls were included in this cross-sectional study. Demographic and clinical data were recorded, and SKNA was measured by neuECG. The gut microbial profiles were analyzed by 16S rRNA gene sequencing of the V3-V4 region. Statistically significant differences in alpha diversity (including the Chao 1 index and Faith's phylogenetic diversity) and gut microbial composition were observed between the ACS and control groups. Redundancy analysis and the Mantel test revealed a significant relationship between SKNA and the microbial profiles. The abundance of butyrate-producing bacteria, including Lachnospira and Oscillibacter, was decreased in the ACS group, whereas the abundance of the genus Hungatella, a trimethylamine producer, significantly increased and was positively correlated with the abundance of SKNA. This study is the first to establish an association between SKNA and gut microbial profiles in ACS patients. SKNA may serve as a potential biomarker reflecting the interaction between the nervous system and gut microbiota in ACS.
Keywords: skin sympathetic nerve activity, gut microbiota, acute coronary syndrome, neurocardiac axis
1. Introduction
Acute coronary syndrome (ACS) is among the leading causes of mortality worldwide [1]. Hemodynamically significant ventricular arrhythmia (VA) during ACS occurs in approximately 8% of patients and can lead to mortality [2]. Sympathetic hyperinnervation caused by ACS can lead to the development of VA. Sympathetic drive leads to increased automaticity, triggered activity, and reentry mechanisms in the heart, all of which can contribute to VA [3,4]. Sympathetic overdrive after ACS can provoke further myocardial ischemia, leading to a vicious cycle of VA and sudden cardiac death. Heart rate variability (HRV), heart rate turbulence, and abnormal T wave alternans can be used to assess the risk of death or VA after MI [5,6]. neuECG is a well-validated noninvasive method for simultaneously recording electrocardiogram and skin sympathetic nerve activity (SKNA) [7]. Increased SKNA is known to precede spontaneous VA in canine models and humans [8-11]. We also reported that SKNA increased in ACS patients and correlated with VA in a clinical study [12].
Accumulating evidence has demonstrated the critical roles of gut dysbiosis and the imbalance of microbial metabolites in the development of ACS. A decrease in butyrate-producing bacteria, along with a corresponding reduction in butyrate concentration, is correlated with elevated inflammation, cardiac damage, and increased mortality [13]. Trimethylamine N-oxide (TMAO), which is formed from trimethylamine (TMA) generated by the action of gut microbiota, has been reported as a novel prognostic marker for ACS [14]. Additionally, the relationships between gut microbiota and circulating metabolites demonstrated by Liu et al. provide a better understanding of the interplay between the host and gut microbiota in atherosclerotic pathogenesis [15]. A canine study revealed that TMAO can activate the cardiac sympathetic nervous system (SNS) and worsen ischemic VA via the left stellate ganglion (SG) pathway or central autonomic activation [16]. The accumulation of branched-chain amino acids (BCAAs) is an alternative biomarker of cardiometabolic disease [17-19]. Pedersen et al. further suggested that elevated serum BCAA levels were attributed to the gut microbiome rather than to dietary intake [20]. Recent studies have further highlighted the complex roles of gut microbiota in host metabolic regulation and functional diversity, which may contribute to cardiometabolic diseases through multiple pathways [21, 22].
As mentioned above, gut microbiota have been reported to play a role in ACS and may modulate sympathetic neurons. However, the interplay between the neurocardiac axis and the microbiome in clinical ACS patients is not clearly understood. Considering the above evidence, we conducted this study to test the hypothesis that SKNA is increased in ACS patients compared with controls and that increased SKNA is associated with specific microbes that may play important roles in linking the microbiota, SNS, and ACS.
2. Materials and Methods
2.1. Patients
This single-center, cross-sectional study was approved by the ethics committee of Kaohsiung Medical University Hospital, and all study subjects provided written informed consent. This study is registered with ClinicalTrials.gov (identifier: NCT03243448). The study participants were enrolled between 2019 and 2021 at Kaohsiung Medical University and Kaohsiung Medical University Hospital. The inclusion criteria were ACS patients and control participants who were 1:1 matched in terms of age and sex. Each group consisted of 15 individuals who were all 20 years of age or older. ACS patients were defined as those with myocardial infarction and unstable angina admitted to the coronary care unit after coronary angiography and/or percutaneous coronary intervention as the standard of care. The enrolled controls were healthy adults who joined the health management program at Kaohsiung Medical University. The exclusion criteria for this study included the use of antibiotics, metformin, or proton pump inhibitors and a diagnosis of diabetes or colon cancer, as all these could have interfered with the results of the microbiota study. Detailed information on medication use is provided in Table S1. These stringent exclusion criteria limited the number of enrolled ACS patients in this study. Demographic and clinical data such as age; sex; body mass index (BMI); clinical factors (hypertension, diabetes, dyslipidemia, and mean arterial pressure); and laboratory data (estimated glomerular filtration rate and serum levels of potassium, triglyceride, low-density lipoprotein (LDL) cholesterol, high-density lipoprotein (HDL) cholesterol, hemoglobin, and hemoglobin A1C) were collected for both the ACS and control groups.
2.2. neuECG, SKNA, and HRV Measurements
The detailed methods of neuECG recording have been reported elsewhere [7]. In brief, the neuECG used conventional lead I ECG electrodes and equipment with a high sampling rate (10,000 Hz) and wide bandwidth (1-2000 Hz) version of the ME6000 Biomonitor System (Mega Electronics Ltd, Finland) to record the electrical signal from the skin of the research subjects. The signals were then bandpass filtered at 500-1000 Hz to display SKNA and at 1-150 Hz to display ECG data. The neuECG was recorded during baseline, stress [23], and recovery (5 minutes for each phase). The stress consisted of mental arithmetic stress induced by arithmetic involving the repeated serial subtraction of the number 13 from a 4-digit number for 5 minutes. The data were analyzed using customized software to determine the average SKNA (aSKNA [µV]) per digitized sample over the monitoring period [7]. The research subjects were asked to lie down and rest for 10 minutes prior to SKNA recording to reduce bias due to motion artifacts and SNS interference.
Short-term HRV analysis was conducted for 5-minute intervals during each phase of the SKNA recording to facilitate comparison. The R peak of the QRS complex in each 5-minute window of the neuECG signal was automatically detected by the modified Pan Tompkins algorithm [24], and the RR interval was obtained beat by beat. We analyzed the time and frequency domains of the HRV using MATLAB (MathWorks, Inc., USA) [24,25].
2.3. Fecal Sample Collection
The fecal samples were frozen immediately after collection and delivered to the laboratory in a cooler bag within 24 hours. The samples were subsequently stored at -80 °C for up to 3 days before processing.
2.4. Fecal DNA Extraction and 16S rRNA Sequencing
Fecal DNA was extracted using a stool DNA extraction kit (Topgen Biotechnology Co., Ltd., Kaohsiung, Taiwan) as previously described [26]. The concentration and quality of the DNA were assessed using a Colibri Microvolume spectrophotometer (Titertek Berthold, Pforzheim, Germany) before it was frozen at -20 °C to preserve its integrity.
The V3-V4 regions of the 16S rRNA gene in each sample were amplified using the primer pairs 341F (5'-TCGTCGGCAGCGTCAGATGTGTATAAGAGACAGCCTACGGGNGGCWGCAG-3') and 805R (5'-GTCTCGTGGGCTCGGAGATGTGTATAAGAGACAGGACTACHVGGGTATCTAATCC -3'). A library was prepared using the Illumina MiSeq platform, generating 2 × 300 bp reads. Raw sequence data were imported into QIIME2 [27], where paired-end reads were merged and denoised into amplicon sequence variants (ASVs) using the DADA2 plugin [28], as previously described [26].
2.5. Statistical Analysis
Disease status (ACS vs. healthy control) was our primary comparison variable, with the baseline SKNA value as a continuous outcome. A priori sample size calculation, assuming a two-sided type I error of 5%, a standard deviation of 0.25 for SKNA, and a 1:1 case/control ratio, estimated a total of 28 participants (14 ACS and 14 controls) to achieve 80% statistical power for detecting an effect size of 0.28.
The significance of differences in the anthropometric data, clinical factors, laboratory results, SKNA parameters, and HRV parameters between the ACS and control groups was assessed using SPSS version 18.0 for Windows (SPSS Inc., Chicago, Illinois). The P values were calculated using the Mann‒Whitney U test for continuous data and the chi‒square test for categorical data. A P value of < 0.05 was considered to indicate statistical significance.
2.6. Bioinformatics
We employed the Chao 1 index and Faith's phylogenetic diversity to assess alpha diversity and compared differences between the ACS and control groups using Kruskal‒Wallis tests. For beta diversity, we performed an analysis of similarity (ANOSIM) and a permutational multivariate analysis of variance (PERMANOVA) with 999 permutations. These analyses were assessed using principal coordinate analyses (PCoAs) based on unweighted UniFrac measurements [29]. Additionally, redundancy analysis was conducted to examine the relationships between microbial beta diversity and clinically relevant factors.
ASV taxonomy was assigned using the SciKit Learn-based approach [30], querying the SILVA reference database (release v138, trimmed to the V3-V4 region, L7 taxonomy) [31]. Significantly different taxa between the ACS and control groups were identified using linear discriminant analysis effect size (LEfSe) with P < 0.05 (factorial Kruskal‒Wallis test) [32]. To increase the stringency, the logarithmic linear discriminant analysis (LDA) score was set to 3. As extensively benchmarked in recent literature, traditional methods can inflate false positive rates in small cohorts. Therefore, ALDEx2 and ANCOM-BC, which are highly conservative and effectively control the False Discovery Rate (FDR) [33], were further employed to identify the genera that were discriminant between the two groups. Generalized linear models were used to explore the relationships between the targeted genera and autonomic parameters, with age and sex included as covariates.
Phylogenetic investigation of communities by reconstruction of observed states 2 (PICRUSt2) was utilized to predict functional differences between the microbial communities of the ACS and control groups based on the MetaCyc database [34].
3. Results
3.1. Clinical Characteristics
A total of 15 patients with ACS were included in this study, along with matched control subjects. The clinical characteristics are shown in Table 1. None of the anthropometric data, health habits, or clinical factors significantly differed between these groups. In terms of laboratory data, the ACS group had significantly elevated fasting glucose and HbA1c levels and markedly reduced HDL levels compared with those in the control group. The SKNA parameters during the baseline and recovery phases (SKNAb and SKNAr) were significantly greater in the ACS group. Additionally, the ACS group had significantly diminished SDNN values during the stress phase (SDNNs) for the HRV parameters.
Characteristics of the ACS and control groups.
| ACS group (n = 15) | Control group (n = 15) | P value | |
|---|---|---|---|
| Anthropometric data | |||
| Sex, male, n (%) | 7 (46.67) | 8 (53.33) | 0.715 |
| Age, y | 64.00 (60.00-68.00) | 63.00 (60.50-68.50) | 0.868 |
| Body mass index, kg/m2 | 24.70 (21.75-27.20) | 22.40 (21.50-23.80) | 0.206 |
| Clinical factors | |||
| Dyslipidemia, n (%) | 7 (46.67) | 7 (46.67) | 1.000 |
| Hypertension, n (%) | 9 (60.00) | 8 (53.33) | 0.713 |
| Smoke, n (%) | 0 (0.0) | 4 (26.7) | 0.043 |
| Alcohol, n (%) | 2 (12.5) | 1 (6.7) | 1 |
| Betel Nut, n (%) | 0(0.0) | 0(0.0) | 1 |
| Systolic BP, mmHg | 139.00 (127.00-157.50) | 137.00 (120.00-141.00) | 0.407 |
| Diastolic BP, mmHg | 86.00 (71.00-91.00) | 79.00 (71.00-87.00) | 0.561 |
| Mean BP, mmHg | 107.00 (91.84-111.00) | 95.67 (89.00-104.50) | 0.330 |
| Laboratory data | |||
| Fasting glucose, mg/dL | 109.00 (101.50-131.00) | 83.00 (78.50-94.00) | < 0.001 |
| HbA1c, % | 5.60 (5.5-5.85) | 5.30 (5.10-5.60) | 0.029 |
| Total cholesterol, mg/dL | 181.00 (151.50-198.50) | 215.00 (179.50-228.00) | 0.059 |
| Triglycerides, mg/dL | 107.00 (67.50-162.50) | 83.00 (75.00-121.50) | 0.520 |
| HDL, mg/dL | 45.20 (30.75-50.90) | 61.20 (53.40-66.15) | < 0.001 |
| LDL, mg/dL | 120.50 (72.25-130.75) | 124.90 (101.35-139.50) | 0.325 |
| Hemoglobin level, g/dL | 13.30 (12.25-14.40) | 14.10 (13.25-14.65) | 0.280 |
| Hematocrit, % | 40.20 (35.15-44.15) | 43.30 (40.85-44.20) | 0.105 |
| Creatinine, mg/dL | 0.81 (0.66-0.98) | 0.72 (0.64-0.98) | 0.756 |
| eGFR, mL/min/1.73m2 | 80.96 (72.90-96.31) | 93.00 (81.00-106.50) | 0.267 |
| K, mmol/L | 3.60 (3.50-3.80) | 3.60 (3.45-3.70) | 0.391 |
| SKNA parameters | |||
| SKNAb, μV | 1.02 (0.96-1.31) | 0.69 (0.60-0.76) | < 0.001 |
| SKNAs, μV | 1.39 (1.27-1.58) | 1.37 (1.20-1.41) | 0.407 |
| SKNAr, μV | 1.12 (0.91-1.20) | 0.72 (0.64-0.80) | < 0.001 |
| HRV parameters | |||
| SDNNb, ms | 29.20 (25.00-41.90) | 35.20 (30.95-4 5.00) | 0.351 |
| RMSSDb, ms | 18.50 (11.6-28.20) | 26.30 (16.35-29.65) | 0.507 |
| LFb | 0.46 (0.41-0.62) | 0.61 (0.52-0.69) | 0.101 |
| HFb | 0.54 (0.38-0.59) | 0.39 (0.31-0.48) | 0.101 |
| LF/HFb | 0.87 (0.70-1.78) | 1.54 (1.1-2.24) | 0.106 |
| SDNNs, ms | 27.30 (23.82-31.68) | 45.10 (40.15-48.60) | < 0.001 |
| RMSSDs, ms | 16.70 (14.15-21.18) | 23.50 (21.25-26.35) | 0.102 |
| LFs | 0.69 (0.63-0.76) | 0.71 (0.65-0.82) | 0.631 |
| HFs | 0.31 (0.24-0.37) | 0.29 (0.18-0.35) | 0.631 |
| LF/HFs | 4.49 (1.71-3.19) | 2.47 (1.85-4.49) | 0.652 |
| SDNNr, ms | 33.65 (22.95-49.15) | 37.50 (30.75-42.90) | 0.395 |
| RMSSDr, ms | 17.85 (10.13-30.13) | 22.60 (17.55-26.65) | 0.451 |
| LFr | 0.59 (0.55-0.71) | 0.61 (0.51-0.74) | 0.880 |
| HFr | 0.41 (0.29-0.45) | 0.39 (0.26-0.49) | 0.880 |
| LF/HFr | 1.47 (1.21-2.49) | 1.55 (1.05-2.96) | 0.880 |
Note: Data are presented as medians (interquartile ranges, 25th-75th percentiles). The b, s, and r values noted after the SKNA and HPV parameters indicate the baseline, stress, and recovery phases, respectively.
Abbreviations: BP, blood pressure; eGFR, estimated glomerular filtration rate; HbA1c, glycated hemoglobin; HDL, high-density lipoprotein; HF, high-frequency power; HPV, heart rate variability; LDL, low-density lipoprotein; LF, low-frequency power; RMSSD, root mean square of the successive differences; SDNN, standard deviation of normal to normal R wave interval; SKNA, skin sympathetic nerve activity.
Medication use differed substantially between the two groups, with ACS patients receiving multiple cardiovascular medications, whereas control participants had minimal medication exposure (Table S1).
3.2. Gut Microbiota Composition Differs between ACS Patients and Healthy Controls
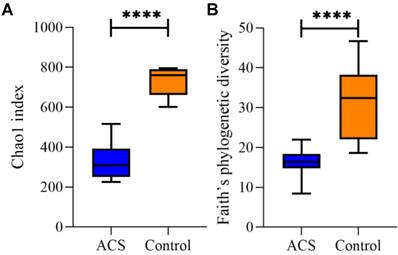
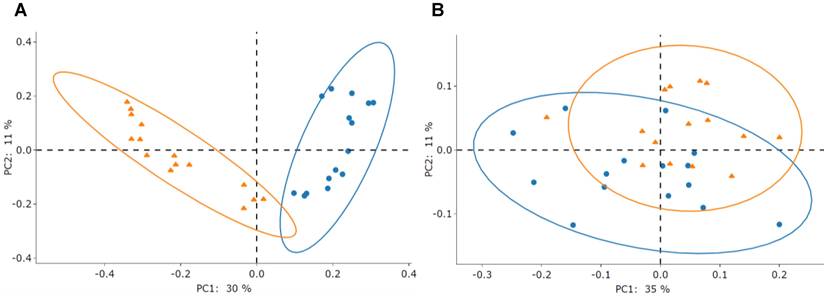
The composition of gut microbiota in the ACS and control groups was determined using 16S rRNA gene sequencing. As depicted in Figure 1, a notable reduction in alpha diversity was observed in the ACS group, as evidenced by the Chao 1 index (P value < 0.001) and Faith's phylogenetic diversity (P value < 0.001). Distinct beta diversity clustering of the gut microbiota between the ACS and control groups was observed using unweighted UniFrac (ANOSIM: R = 0.702, P value = 0.001; PERMANOVA: pseudo-F = 9.573, P value = 0.001) or weighted unnormalized UniFrac measurements (ANOSIM: R = 0.123, P value = 0.008; PERMANOVA: pseudo-F = 2.860, P value = 0.011), as illustrated in Figure 2.
Comparison of the alpha diversity between the ACS and control groups. (A) The median Chao1 index was 309.00 (25th-75th percentile: 257.15-383.27) in the ACS group and 760.38 (671.15-783.42) in the control group. (B) The median Faith's phylogenetic diversity was 16.39 (25th-75th percentile: 14.81-18.20) in the ACS group and 32.46 (23.73-37.83) in the control group.
Beta diversity clustering of the gut microbiota between the ACS and control groups. (A) Unweighted UniFrac measurements. (B) Weighted unnormalized UniFrac measurements. The blue circle indicates the ACS group, and the orange triangle indicates the control group.
3.3. Associations between Clinically Relevant Variables and Microbial Beta Diversity
The association of clinically relevant variables with microbial beta diversity was further investigated by RDA. Fasting glucose was excluded from further analysis due to stress hyperglycemia in the ACS subjects despite significant differences between the ACS and control groups. To mitigate the potential accumulation of signals, the SKNA data were segregated into three distinct phases: baseline, stress, and recovery (Figures 3A to 3C). SKNAb, SKNAr, SDNNs, and HDL had the most potent influences (the longest arrow) on microbial beta diversity. The SKNAb and SKNAr were positively correlated with the ACS group during the baseline and recovery phases, respectively. Conversely, the SDNNs was negatively correlated with the ACS group during the stress phase. HDL levels were positively correlated with the control group in all three phases.
Comparison of clinically relevant factors influencing microbial beta diversity between the ACS and control groups. The clinical confounding factors of BMI (body mass index), Cr (creatinine), Hb (hemoglobin), HbA1c, HDL (high-density lipoprotein), K (potassium), LDL (low-density lipoprotein), LF/HF (low frequency power/high frequency power), MBP (mean blood pressure), SDNN (standard deviation of normal to normal R wave) and SKNA (skin sympathetic nerve activity) were examined by redundancy analysis (RDA) based on unweighted UniFrac measurements. (A) Baseline phase. (B) Stress phase. (C) Recovery phase. The green spot indicates the subjects belonging to the ACS group, and the orange spot indicates the subjects belonging to the control group.
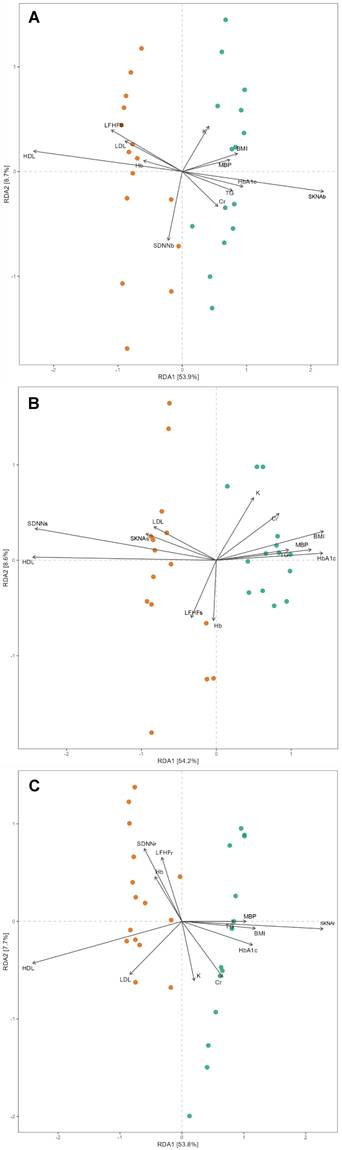
The results of the Mantel test further confirmed that SKNAb (r = 0.151, P value = 0.023), SDNNs (r = 0.249, P value = 0.002), and SKNAr (r = 0.209, P value = 0.007) were significantly related to the gut microbiota profiles during the baseline, stress, and recovery phases, respectively (Table 2). HDL levels were significantly associated with the dissimilarity of the gut microbiota in all three phases. No other clinical parameters were significantly related to microbial beta diversity.
Evaluation of the relationships between clinically relevant factors and gut microbial profiles by the Mantel test.
| Phase | ||||||
|---|---|---|---|---|---|---|
| Baseline | Stress | Recovery | ||||
| Correlation coefficient | P value | Correlation coefficient | P value | Correlation coefficient | P value | |
| SKNA | 0.151 | 0.023 | -0.014 | 0.522 | 0.209 | 0.007 |
| SDNN | -0.028 | 0.603 | 0.249 | 0.002 | -0.090 | 0.942 |
| HDL | 0.273 | 0.003 | 0.235 | 0.002 | 0.262 | 0.002 |
Abbreviations: HDL, high-density lipoprotein; SDNN, standard deviation of normal to normal R wave interval; SKNA, skin sympathetic nerve activity.
3.4. Relative Abundances of Fecal Microbiota between the ACS and Control Groups
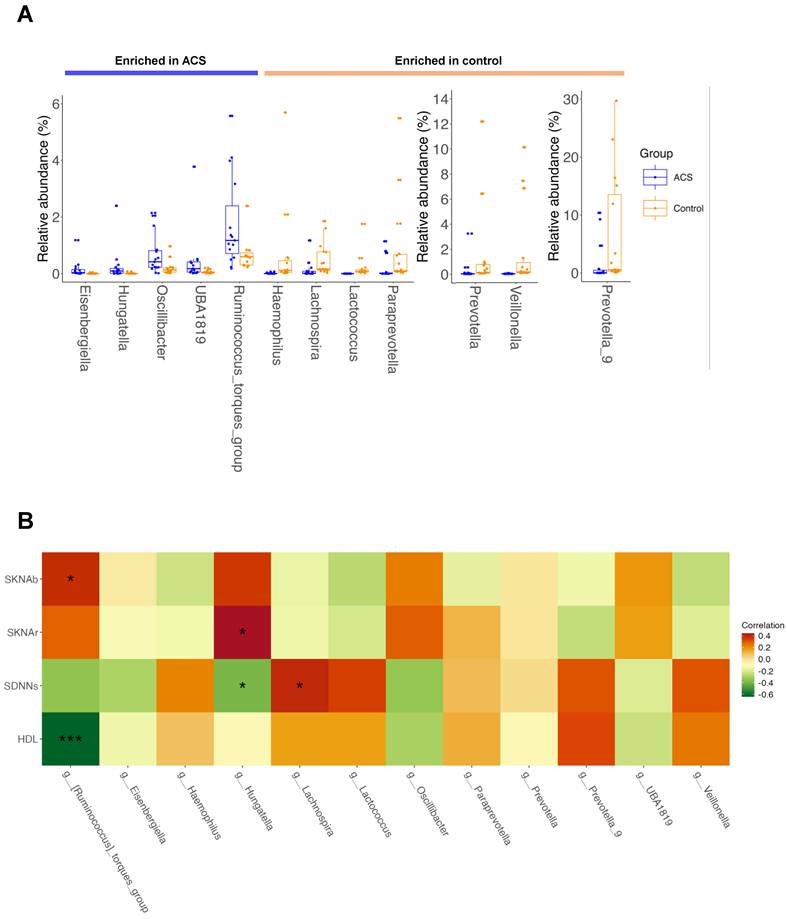
Relative differences in the abundances of fecal microbiota between the ACS and control groups were estimated by LEfSe, employing a logarithmic LDA score threshold of > 3. The phylum Desulfobacterota and the class Desulfovibrionia, as well as 3 orders, 6 families, 15 genera, and 19 species were enriched within the ACS group (Figure S1). Within the control group, enrichment was observed in the phylum Bacteroidota and the classes Actinobacteria and Bacteroidia, as well as in 3 orders, 7 families, 29 genera, and 45 species. Notably, the abundance of Bifidobacterium bifidum, which is classified as a lactic acid bacterium, increased throughout its taxonomic hierarchy to the class level in the control group.
To increase the stringency of discriminant taxa identification and rigorously control for FDRs in our cohort, a consensus approach utilizing three differential abundance algorithms (LEfSe, ALDEx2, and ANCOM-BC) was employed. A total of 12 genera were robustly identified as discriminant across all three methods (Figure 4A). Among them, Eisenbergiella, Hungatella, and Ruminococcaceae UBA1819 were significantly enriched in the ACS group. Conversely, the remaining genera exhibited a decreased abundance in the ACS group. This depletion included key members of the Prevotellaceae family (Paraprevotella, Prevotella, and Prevotella_9), as well as butyrate-producing bacteria Lachnospira and Oscillibacter. Additionally, an unexpected decrease in the opportunistic microbe Haemophilus was observed in the ACS group.
The 12 genera identified across LEfSe, ALDEx2, and ANCOM-BC. (A) The relative abundances. (B) Correlations with SKNAb, SKNAr, SDNNs and HDL.
3.5. Links between the Gut Microbiome and the Clinical Characteristics of ACS
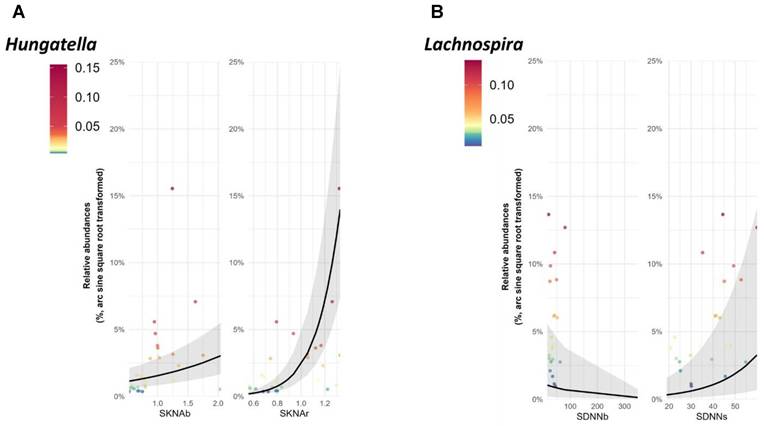
Because HDL-C, SKNAb, SDNNs, and SKNAr were significantly associated with the dissimilarity of the gut microbiome between the ACS and control groups, we proceeded to explore the correlations among the microbial relative abundances of the 12 genera that were identified as robust discriminant taxa by the consensus of the LEfSe, ALDEx2, and ANCOM-BC analyses. As shown in Figure 4B, Hungatella was negatively correlated with the SDNNs (r = -0.392, P value = 0.032) and positively correlated with the SKNAr (r = 0.441, P value = 0.015); notably, it also showed a marginally significant correlation with SKNAb (r = 0.358, P value = 0.052). Additionally, Lachnospira was positively correlated with SDNNs (r = 0.393, P value = 0.032). None of the other robust discriminant taxa were significantly correlated with the four clinical parameters. Based on the results of these highly stringent differential abundance analyses, we further analyzed the fixed effects to determine the correlation between SKNAb, SKNAr, and SDNNs and the abundance of the gut microbiota after controlling for age and sex (Figure 5A and B). The fixed effects of SKNAb and SKNAr on Hungatella were 0.66 (P < 0.001) and 5.757 (P < 0.001), respectively. The fixed effect of SDNNs on Lachnospira was 0.057 (P < 0.001).
Fixed effects after controlling for age and sex to determine the correlation between the microbiota and the results of the autonomic survey. (A) The correlation between Hungatella and SKNA. (B) The correlation between Lachnospira and the SDNN.
3.6. Prediction of Microbial Functions
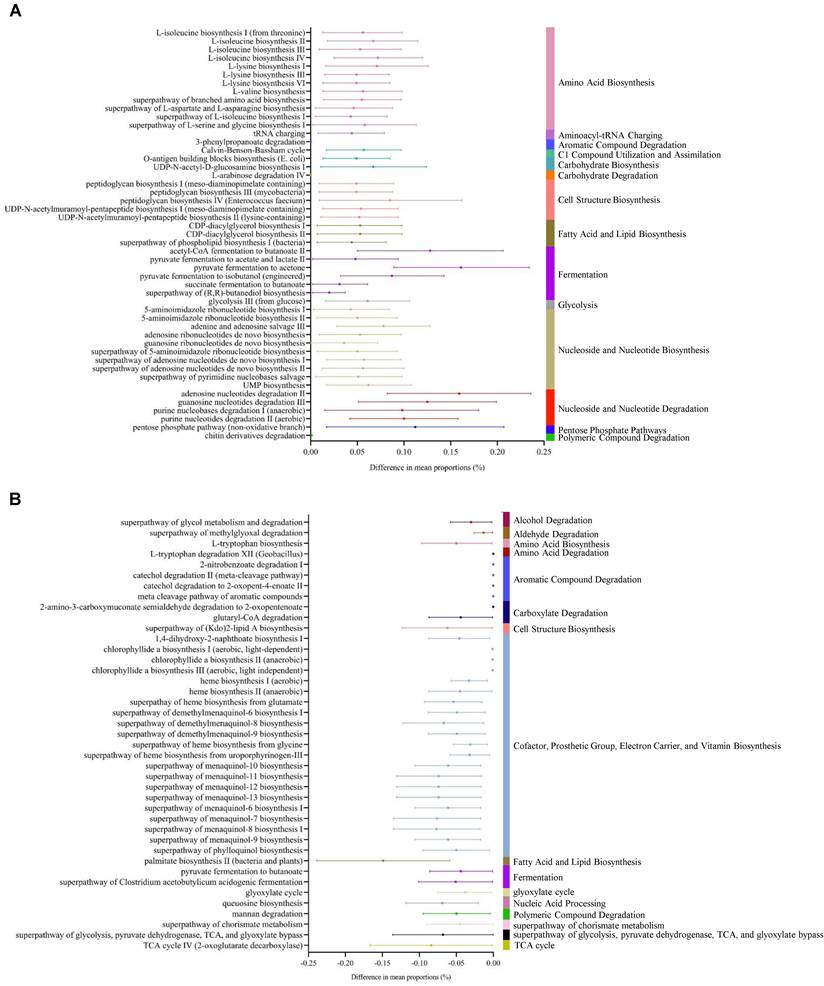
PICRUSt2 analysis revealed that 49 and 41 MetaCyc pathways were enriched in the ACS and control groups, respectively (Figure 6). In the ACS group, 12 and 10 pathways were significantly enriched for amino acid biosynthesis and nucleoside and nucleotide biosynthesis, respectively. Among them, 7 pathways related to the biosynthesis of branched-chain amino acids (BCAAs) were noted. With respect to the control group, 21 pathways were enriched under cofactor, prosthetic group, electron carrier, and vitamin biosynthesis, and 4 pathways were enriched under aromatic compound degradation.
Comparison of PICRUSt2-predicted MetaCyc pathways between the ACS and control groups. (A) Pathways enriched in the ACS group. (B) Pathways enriched in the control group.
4. Discussion
Although Meng et al. highlighted that the gut microbe-derived metabolite TMAO plays an important role in the development of VA by activating the cardiac SNS [16], our study is the first to demonstrate the interplay between the skin SNS and gut dysbiosis in ACS patients. Previously, we showed that SKNA was associated with VA in ACS patients, establishing it as a novel biomarker for ACS risk stratification [12]. The current study further suggests a potential association between SKNA and gut microbiota profiles in ACS patients.
The value of SKNA was positively correlated with the relative abundance of Hungatella, a TMA producer (Figure 4 and Figure 5A). Hungatella, combined with Eggerthella lenta, has been reported to be involved in the conversion of L-carnitine to trimethylamine (TMA) [35]. TMA is the diet-derived precursor of TMAO, the major metabolite of the microbiome correlated with the outcomes of ACS [14]. Altered Hungatella abundance was linked to an increased incidence of unruptured intracranial aneurysms, an atherosclerotic cardiovascular disease [36]. In two independent cross-sectional cohorts of patients with systolic heart failure (HF), increased Hungatella abundance was associated with HF [37]. Hungatella was also negatively correlated with HDL-C levels in stroke patients [38] and positively correlated with IL-10 levels [39]. Therefore, Hungatella is associated with cardiovascular disease and ACS. In addition, SGLT2i can reduce Hungatella abundance in individuals with type 2 diabetes [40]. Furthermore, polyphenol-rich extracts can lower plasma TMAO levels in overweight and obese adults in association with Hungatella modulation [41], suggesting that modulation of Hungatella may be associated with cardiovascular risk. In addition to cardiovascular disease, Hungatella was also found to be more significantly enriched in patients with generalized anxiety disorder [42]. Given that anxiety is thought to be correlated with high SNS status, the association between Hungatella and SNS is reasonable.
Type 2 diabetes, which is often linked with gut dysbiosis, is prevalent among patients with ACS and is recognized as a risk factor for the development of ACS. However, Emoto et al. compared the composition of the gut microbiome among coronary artery disease (CAD) patients, non-CAD controls who have coronary risk factors such as type 2 diabetes, and healthy volunteers and demonstrated that a change in the gut microbiota in the CAD group was not associated with type 2 diabetes [43]. A key aspect of our study was the exclusion of patients with type 2 diabetes to clearly define the changes in the gut microbiota profiles specific to ACS. Compared with the matched controls, ACS patients exhibited a decrease in the abundance of butyrate-producing bacteria and an increase in the abundance of TMA-producing bacteria. These findings align with those of previous studies that included patients with type 2 diabetes [13,15], further supporting their potential involvement in ACS.
Predicted elevated production of BCAAs, including leucine, isoleucine, and valine, was observed in the microbial functional analysis using PICRUSt2 (Figure 6). Among the 12 pathways related to amino acid biosynthesis that were enriched in ACS subjects, five were associated with isoleucine biosynthesis, one with valine biosynthesis, and one with overall BCAA biosynthesis. Previous studies have identified increased plasma BCAA concentrations in patients with heart failure or coronary artery disease that can predict adverse outcomes [17-19]. In addition to impaired cardiac BCAA catabolism, abnormal BCAA accumulation may originate from the gut microbiota [20]. Additionally, BCAA accumulation has been shown to exacerbate microglia-induced neuroinflammation in a rat model of ischemia/reperfusion [44]. These findings may reflect a potential link between the microbiota and SKNA in ACS, as addressed in this study.
This study has several limitations. First, the sample size was relatively small due to the rigorous selection process, including strict exclusion criteria to minimize confounding factors affecting gut microbiota. Although this approach improves internal validity, it may limit generalizability and increase the risk of statistical instability in high-dimensional microbiome analyses. Therefore, the findings should be interpreted as exploratory and require validation in larger independent cohorts. Second, the use of the V3-V4 region for 16S rRNA gene sequencing limited taxonomic resolution to the genus level in some cases. Third, we did not measure TMAO or BCAA levels in the subjects, preventing direct evaluation of their relationships with the gut microbiota and SKNA. Thus, functional interpretations based on PICRUSt2 remain speculative and require validation using targeted metabolomics, metagenomics, or experimental studies (e.g., in vitro or animal models). Fourth, this study was not designed to evaluate the incremental diagnostic or prognostic value of SKNA beyond established HRV parameters; therefore, its clinical implications remain preliminary. Finally, residual confounding cannot be excluded. Differences in metabolic parameters (fasting glucose, HbA1c, and HDL) and other unmeasured factors, such as lifestyle and host metabolic status, may have influenced microbial composition. In addition, the relatively low correlation coefficients suggest that the observed associations are likely multifactorial and should be interpreted with caution. Due to the limited sample size and the relatively large number of potential metabolic and medication-related covariates, multivariable adjustment was not undertaken, as it would likely result in model overfitting and unstable estimates.
In conclusion, this study is the first to demonstrate an association between SKNA and gut microbial profiles in ACS patients. By applying stringent selection criteria to exclude patients with type 2 diabetes, we identified specific patterns in patients with ACS, including alterations in butyrate-producing bacteria, TMA-producing bacteria, and predicted microbial BCAA biosynthesis pathways. These findings provide preliminary evidence of a link between SKNA and gut microbiota in ACS and may contribute to a better understanding of the neurocardiac-microbiota axis. Further studies with larger cohorts and mechanistic validation are required to clarify the clinical relevance of SKNA in ACS.
Supplementary Material
Supplementary figures and tables.

Acknowledgements
Funding
This study was supported in part by grants from the Ministry of Science and Technology, R.O.C “MOST 110-2314-B-037-111”, Kaohsiung Medical University Hospital “KMUH108-8R11”, KMUH111-1T10”, “SI11001”, “SI11101”, “SI11201”, “110KMUOR01”, “NK111P24”, “NSYSU-KMU-112-P13” and “KMUH1111T10”, and Kaohsiung Medical University “KMU-TC114A06-1”.
Author Contributions
WT and WCH were responsible for the study design and wrote the manuscript. PP and PJ analyzed the data. WT, YT, WWH, and WCH were in charge of the final revision of the manuscript. YL, SJ, TH, LC, and TL collected the samples. HS, WL, CL, BW, and SL provided the concept of this study.
Competing Interests
The authors have declared that no competing interest exists.
References
1. Nascimento BR, Brant LCC, Marino BCA, Passaglia LG, Ribeiro ALP. Implementing myocardial infarction systems of care in low/middle-income countries. Heart. 2019;105:20-26
2. Piccini JP, Schulte PJ, Pieper KS, Mehta RH, White HD, Van de Werf F. et al. Antiarrhythmic drug therapy for sustained ventricular arrhythmias complicating acute myocardial infarction. Crit Care Med. 2011;39:78-83
3. Shen MJ, Zipes DP. Role of the autonomic nervous system in modulating cardiac arrhythmias. Circ Res. 2014;114:1004-1021
4. Chen PS, Chen LS, Fishbein MC, Lin SF, Nattel S. Role of the autonomic nervous system in atrial fibrillation: pathophysiology and therapy. Circ Res. 2014;114:1500-1515
5. Malik M, Farrell T, Cripps T, Camm AJ. Heart rate variability in relation to prognosis after myocardial infarction: selection of optimal processing techniques. Eur Heart J. 1989;10:1060-1074
6. Exner DV, Kavanagh KM, Slawnych MP, Mitchell LB, Ramadan D, Aggarwal SG. et al. Noninvasive risk assessment early after a myocardial infarction the REFINE study. J Am Coll Cardiol. 2007;50:2275-2284
7. Kusayama T, Wong J, Liu X, He W, Doytchinova A, Robinson EA. et al. Simultaneous noninvasive recording of electrocardiogram and skin sympathetic nerve activity (neuECG). Nat Protoc. 2020;15:1853-1877
8. Kusayama T, Wan J, Doytchinova A, Wong J, Kabir RA, Mitscher G. et al. Skin sympathetic nerve activity and the temporal clustering of cardiac arrhythmias. JCI Insight. 2019 4
9. Kabir RA, Doytchinova A, Liu X, Adams D, Straka S, Chen LS. et al. Crescendo skin sympathetic nerve activity and ventricular arrhythmia. J Am Coll Cardiol. 2017;70:3201-3202
10. Zhang P, Liang JJ, Cai C, Tian Y, Dai MY, Wong J. et al. Characterization of skin sympathetic nerve activity in patients with cardiomyopathy and ventricular arrhythmia. Heart Rhythm. 2019;16:1669-1675
11. Doytchinova A, Hassel JL, Yuan Y, Lin H, Yin D, Adams D. et al. Simultaneous noninvasive recording of skin sympathetic nerve activity and electrocardiogram. Heart Rhythm. 2017;14:25-33
12. Huang TC, Lin SJ, Chen CJ, Jhuo SJ, Chang CW, Lin SC. et al. Skin sympathetic nerve activity and ventricular arrhythmias in acute coronary syndrome. Heart Rhythm. 2022;19:1613-1619
13. Amiri P, Hosseini SA, Ghaffari S, Tutunchi H, Mosharkesh E, Asghari S. et al. Role of butyrate, a gut microbiota derived metabolite, in cardiovascular diseases: a comprehensive narrative review. Front Pharmacol. 2021;12:837509
14. Li XS, Obeid S, Klingenberg R, Gencer B, Mach F, Räber L. et al. Gut microbiota-dependent trimethylamine N-oxide in acute coronary syndromes: a prognostic marker for incident cardiovascular events beyond traditional risk factors. Eur Heart J. 2017;38:814-824
15. Liu H, Chen X, Hu X, Niu H, Tian R, Wang H. et al. Alterations in the gut microbiome and metabolism with coronary artery disease severity. Microbiome. 2019;7:68
16. Meng G, Zhou X, Wang M, Zhou L, Wang Z, Wang M. et al. Gut microbe-derived metabolite trimethylamine N-oxide activates the cardiac autonomic nervous system and facilitates ischemia-induced ventricular arrhythmia via two different pathways. EBioMedicine. 2019;44:656-664
17. Grajeda-Iglesias C, Rom O, Aviram M. Branched-chain amino acids and atherosclerosis: friends or foes? Curr Opin Lipidol. 2018;29:166-169
18. White PJ, Newgard CB. Branched-chain amino acids in disease. Science. 2019;363:582-583
19. McGarrah RW, White PJ. Branched-chain amino acids in cardiovascular disease. Nat Rev Cardiol. 2023;20:77-89
20. Pedersen HK, Gudmundsdottir V, Nielsen HB, Hyotylainen T, Nielsen T, Jensen BA. et al. Human gut microbes impact host serum metabolome and insulin sensitivity. Nature. 2016;535:376-381
21. Xu Y, An Z, Wang S, Ni Y, Zhou M, Fen Q. et al. Dual role of pregnane X receptor in nonalcoholic fatty liver disease. Current molecular pharmacology. 2024;17:E18761429259143
22. Guan Y, Zhu Z, Peng Q, Li M, Li X, Yang JW. Genomic and metagenomic insights into the distribution of nicotine-degrading enzymes in human microbiota. Current Genomics. 2024;25:226-235
23. Kop WJ, Krantz DS, Nearing BD, Gottdiener JS, Quigley JF, O'Callahan M. et al. Effects of acute mental stress and exercise on T-wave alternans in patients with implantable cardioverter defibrillators and controls. Circulation. 2004;109:1864-1869
24. Pan J, Tompkins WJ. A real-time QRS detection algorithm. IEEE transactions on bio-medical engineering. 1985;32:230-236
25. Chan YH, Tsai WC, Shen C, Han S, Chen LS, Lin SF. et al. Subcutaneous nerve activity is more accurate than heart rate variability in estimating cardiac sympathetic tone in ambulatory dogs with myocardial infarction. Heart Rhythm. 2015;12:1619-1627
26. Hung WW, Peng P, Tsai YC, Jhou PS, Chang CC, Hsieh CC. et al. Gut microbiota compositions and metabolic functions in type 2 diabetes differ with glycemic durability to metformin monotherapy. Diabetes Res Clin Pract. 2021;174:108731
27. Bolyen E, Rideout JR, Dillon MR, Bokulich NA, Abnet CC, Al-Ghalith GA. et al. Reproducible, interactive, scalable and extensible microbiome data science using QIIME 2. Nat Biotechnol. 2019;37:852-857
28. Callahan BJ, McMurdie PJ, Rosen MJ, Han AW, Johnson AJ, Holmes SP. DADA2: High-resolution sample inference from Illumina amplicon data. Nat Methods. 2016;13:581-583
29. Xia Y, Sun J. Hypothesis testing and statistical analysis of microbiome. Genes Dis. 2017;4:138-148
30. Pedregosa F, Varoquaux G, Gramfort A, Michel V, Thirion B, Grisel O. et al. Scikit-learn: Machine learning in Python. J Mach Learn Res. 2011;12:2825-2830
31. Quast C, Pruesse E, Yilmaz P, Gerken J, Schweer T, Yarza P. et al. The SILVA ribosomal RNA gene database project: improved data processing and web-based tools. Nucleic Acids Res. 2012;41:D590-D596
32. Segata N, Izard J, Waldron L, Gevers D, Miropolsky L, Garrett WS. et al. Metagenomic biomarker discovery and explanation. Genome Biol. 2011;12:R60
33. Nearing JT, Douglas GM, Hayes MG, MacDonald J, Desai DK, Allward N. et al. Microbiome differential abundance methods produce different results across 38 datasets. Nat communications. 2022;13:342
34. Douglas GM, Maffei VJ, Zaneveld JR, Yurgel SN, Brown JR, Taylor CM. et al. PICRUSt2 for prediction of metagenome functions. Nat Biotechnol. 2020;38:685-688
35. Koeth RA, Lam-Galvez BR, Kirsop J, Wang Z, Levison BS, Gu X. et al. l-Carnitine in omnivorous diets induces an atherogenic gut microbial pathway in humans. J Clin Invest. 2019;129:373-387
36. Li H, Xu H, Li Y, Jiang Y, Hu Y, Liu T. et al. Alterations of gut microbiota contribute to the progression of unruptured intracranial aneurysms. Nat Commun. 2020;11:3218
37. Kummen M, Mayerhofer CCK, Vestad B, Broch K, Awoyemi A, Storm-Larsen C. et al. Gut microbiota signature in heart failure defined from profiling of 2 independent cohorts. J Am Coll Cardiol. 2018;71:1184-1186
38. Cui W, Xu L, Huang L, Tian Y, Yang Y, Li Y. et al. Changes of gut microbiota in patients at different phases of stroke. CNS Neurosci Ther. 2023;29:3416-3429
39. Sun H, Gu M, Li Z, Chen X, Zhou J. Gut microbiota dysbiosis in acute ischemic stroke associated with 3-month unfavorable outcome. Front Neurol. 2021;12:799222
40. Deng X, Zhang C, Wang P, Wei W, Shi X, Wang P. et al. Cardiovascular benefits of empagliflozin are associated with gut microbiota and plasma metabolites in type 2 diabetes. J Clin Endocrinol Metab. 2022;107:1888-1896
41. Rehman A, Tyree SM, Fehlbaum S, DunnGalvin G, Panagos CG, Guy B. et al. A water-soluble tomato extract rich in secondary plant metabolites lowers trimethylamine-n-oxide and modulates gut microbiota: a randomized, double-blind, placebo-controlled cross-over study in overweight and obese adults. J Nutr. 2023;153:96-105
42. Chen YH, Bai J, Wu D, Yu SF, Qiang XL, Bai H. et al. Association between fecal microbiota and generalized anxiety disorder: Severity and early treatment response. J Affect Disord. 2019;259:56-66
43. Emoto T, Yamashita T, Sasaki N, Hirota Y, Hayashi T, So A. et al. Analysis of gut microbiota in coronary artery disease patients: a possible link between gut microbiota and coronary artery disease. J Atheroscler Thromb. 2016;23:908-921
44. Shen J, Guo H, Liu S, Jin W, Zhang ZW, Zhang Y. et al. Aberrant branched-chain amino acid accumulation along the microbiota-gut-brain axis: Crucial targets affecting the occurrence and treatment of ischaemic stroke. Br J Pharmacol. 2023;180:347-368
Author contact
Corresponding author: Wei-Chun Hung, Ph.D., Department of Microbiology and Immunology, Kaohsiung Medical University, No.100, Shiquan 1st Rd., Sanmin District, Kaohsiung City 807378, Taiwan. TEL: 886-7-312-1101 ext. 2150. E-mail: wchungedu.tw.