Impact Factor ISSN: 1449-1907
- Issue 9; 2026
- Issue 8; 2026
- Issue 7; 2026
- Issue 6; 2026
- Issue 5; 2026
- Volume 23; 2026
- Past Issues
- Editorial Board
- Cover Images
- Index & Coverage
- Cover Suggestion
- Special Issues
Introduction
Material and Methods
Results
Discussion
Conclusions
Abbreviations
Supplementary Material
Acknowledgements
References

 Global reach, higher impact
Int J Med Sci 2025; 22(7):1630-1639. doi:10.7150/ijms.108760 This issue Cite
Research Paper
Association of nutrient intake and dietary patterns with serum folate and anemia-related biomarkers in Taiwanese pregnant women with pre-pregnancy overweightness or obesity
Nhi Thi Hong Nguyen1,2, Chyi-Huey Bai3,4,5, Jung-Su Chang1,5,6,7, Yi-Chun Chen1, Ya-Li Huang3,4, Fan-Fen Wang8, Chien-Yeh Hsu9,10, Arpita Das1, Jane C.-J. Chao1,5,7,10, ![]()
1. School of Nutrition and Health Sciences, Taipei Medical University, Taipei, Taiwan.
2. Health Personnel Training Institute, University of Medicine and Pharmacy, Hue University, Hue city, Vietnam.
3. Department of Public Health, School of Medicine, Taipei Medical University, Taipei, Taiwan.
4. School of Public Health, Taipei Medical University, Taipei, Taiwan.
5. Nutrition Research Center, Taipei Medical University Hospital, Taipei, Taiwan.
6. Graduate Institute of Metabolism and Obesity Sciences, Taipei Medical University, Taipei, Taiwan.
7. TMU Research Center for Digestive Medicine, Taipei Medical University, Taipei, Taiwan.
8. Department of Internal Medicine, Yangming Branch, Taipei City Hospital, Taipei, Taiwan.
9. Department of Information Management, National Taipei University of Nursing and Health Sciences, Taipei, Taiwan.
10. Master Program in Global Health and Health Security, Taipei Medical University, Taipei, Taiwan.
Received 2024-12-13; Accepted 2025-2-21; Published 2025-2-28
Abstract

Pre-pregnancy overweightness or obesity affects nutritional status and micronutrient imbalance such as folate and iron during pregnancy. We studied the relationships between micronutrient intake and dietary patterns with serum folate and iron biomarkers among pregnant population with pre-pregnancy overweightness or obesity. This cross-sectional study utilized data from 2017-2019 Nationwide Nutrition and Health Survey. Participants (n = 436) were Taiwanese pregnant women with pre-pregnancy overweightness or obesity. Dietary evaluation was conducted by food frequency questionnaire and 24-hour dietary recall. Dietary patterns were developed by principal component analysis. Serum folate and iron biomarkers were measured. Logistic and linear regression models were employed to investigate the associations of dietary patterns with serum folate and iron biomarkers. Participants with the highest tertile of serum folate were older, and had less proportion of high parity. After adjusting covariates, the intake of DP-1 (mushrooms, roots, and dairy DP) (β = 0.052; 95% CI = 0.008-0.119; p < 0.05) or DP-3 (vegetables and fruits DP) (β = 0.056; 95% CI = 0.034-0.076; p < 0.05) was associated with increased serum folate. The consumption of DP-4 (animal DP) showed a significant association with elevated serum iron, ferritin, and vitamin B-12. The consumption of DP-1 or DP-3 was linked to a decreased risk of low serum folate. However, the intake of DP-3 was correlated with an increased risk of low serum ferritin. A reduced risk of low serum iron and vitamin B-12 was observed in participants consuming DP-4. The dairy and plant dietary patterns were positively associated with serum folate, and the animal dietary pattern was positively correlated with serum iron and vitamin B-12 in pregnant women with pre-pregnancy overweightness or obesity.
Keywords: pregnant women, serum folate, iron biomarkers, dietary pattern, overweight, obesity
Introduction
Both maternal and fetal health could be influenced by the nutritional status during the periods of pre-pregnancy and pregnancy in expected mothers [1]. Folate deficiency during pregnancy could increase the risk of neural tube defects in the fetus. An additional folate requirement (200 µg) above daily regular requirement of 400 µg for pregnant women was recommended by the Ministry of Health and Welfare (Taiwan) [2]. Women with overweightness or obesity were correlated to reduced serum folate levels [3], and obese women in pre-pregnancy used less folic acid supplement before pregnancy than their counterparts with normal body mass index (BMI) [4]. Additionally, overweight or obese women in pre-pregnancy were associated with increased odds of having preterm delivery compared with those with normal BMI, and with a reduced risk of preterm delivery if they had folic acid supplement from the 1st trimester of the pregnancy [5].
Maternal vitamin B12, vitamin D, and iron status during pregnancy is important for fetal growth and development. Obese women in pre-pregnancy had lower serum vitamin B-12 levels during pregnancy compared with those with normal BMI [6]. Vitamin D deficiency in pregnant women was concerned for public health issue, and crucial to prevent maternal vitamin D deficiency for better infant outcomes [7]. Obesity could be correlated to low serum vitamin D status [8]. Additionally, maternal obesity during pregnancy was reported to raise the risk of having insufficient vitamin D levels for both mothers and infants [9], and vitamin D deficiency was associated with an increased risk of preeclampsia [10]. Recently, maternal obesity has been indicated to have an association with heightened risk of iron deficiency during pregnancy and iron-deficiency anemia in both mothers and infants [11].
The previous studies investigating the dietary habits of pregnant women with overweightness or obesity have primarily concentrated on dietary patterns, energy consumption, and macronutrient intake [12-14]. Furthermore, the research exploring micronutrient intake in pregnant women has focused on the undernourished pregnant women instead of the pregnant women with overweightness or obesity [15]. The study for the utilization of dietary pattern (DP) analysis to comprehend the risk factors related to micronutrient deficiencies during pregnancy remains restricted. Therefore, our study aimed to identify the associated factors of micronutrient intake and DPs with serum folate levels and iron biomarkers in pregnant women with pre-pregnancy overweightness or obesity.
Material and Methods
Data source
The subjects in the Nationwide Nutrition and Health Survey were pregnant individuals and recruited from 11 hospitals using stratified sampling in Taiwan from 2017 to 2019 [16].
Study population
The inclusion criteria for recruited pregnant women were those who had (1) age of 15 years or above, (2) the maternal health assessment booklet, (3) obstetric examination services more than once, (4) the ability to communicate in Mandarin or Taiwanese, (5) the willing to join the study and sign the consent form (for those who were under 20 years, parental permission was obtained from the informed agreement), and (5) pre-pregnancy BMI ≥ 24 kg/m2. Pre-pregnancy BMI was computed by dividing body weight (kg) by height (m2), and classified as overweight or obesity if the BMI value was ≥ 24 kg/m² [17]. Participants having non-singleton pregnancies, multiparity (> 4), or being nonresponsive were excluded from the study. A total of 436 participants were finally incorporated in the analysis.
Dietary assessment
The dietary assessment was performed by a standardized semi-quantitative food frequency questionnaire (FFQ) derived from the NAHSIT FFQ [18], and by a 24-hour dietary recall method. The supplement intake was also recorded as monthly frequency using the questionnaire. The FFQ was utilized to identify the habitual dietary consumption of a total of 59 food items as described in detail elsewhere [18]. The consumption frequency of each food item in the FFQ was evaluated according to daily, weekly, or monthly consumption, and the overall monthly frequency of a specific food category was finally calculated. To calculate the dietary pattern (DP) score, 59-item in the FFQ was further derived into 26 food groups [18]. The food items with comparable nutrients were assigned to the same food group (Supplementary Table S1). Different DPs were determined by principal component analysis (PCA), a multivariate technique for analyzing variation and categorizing strong patterns in the dataset [19]. The 24-hour dietary recall data were assessed by the well-trained registered dietitian via face-to-face interview. Nutrient intake was standardized by Taiwan's food nutrient database, and calculated using Cofit Pro (Cofit Healthcare, Taipei, Taiwan).
Assessment of anemia-related biomarkers
After blood samples were collected at the baseline during the prenatal visit, serum biomarkers associated with both micronutrient intake and iron biomarkers including folate, vitamin B12, 25(OH) vitamin D, hemoglobin (Hb), iron, ferritin, total iron-binding capacity (TIBC), and transferrin saturation were assessed.
Serum folate [20] and vitamin B12 concentrations [21] were evaluated by a SimulTRAC-SNB radioimmunoassay kit (MB Biomedicals, Santa Ana, CA) with 125I or 57Co as the tracer. Serum levels of 25(OH) vitamin D were assessed utilizing the Elecsys vitamin D total reagent kit by an electrochemiluminescence immunoassay with ruthenium-labeled vitamin-D-binding protein (Roche Diagnostics Ltd., Taipei, Taiwan) [22]. Serum Hb levels (g/dL) were measured using a hematology analyzer from Sysmex Corp., Kobe, Japan. Serum iron concentrations (µmol/L) were analyzed by a ferrozine-based colorimetric assay. Serum ferritin was evaluated by a chemiluminescence immunoassay. Additionally, TIBC levels (µmol/L) were identified by an immunoturbidimetric method. These indicators (serum iron, ferritin, and TIBC) were assessed using a Beckman Coulter Unicel DxC 800 instrument [23]. Transferrin saturation (%) was calculated by dividing serum iron levels by TIBC value and multiplying by 100% [24].
We categorized these gestational anemia-related biomarkers into either normal or abnormal levels using the clinical cutoffs established by the World Health Organization and the Centers for Disease Control and Prevention. For serum folate across all age groups, the standard reference range was 13.6-45.3 nmol/L (6-20 ng/mL) [25]. The cutoff for vitamin B12 deficiency was defined as < 149.8 pmol/L (< 203 pg/mL) [26]. Serum 25(OH) vitamin D was classified as a deficiency if its concentration was < 75 nmol/L (< 30 ng/mL) [27]. The standard reference ranges for serum iron and TIBC in non-anemic women were 10.7 µmol/L (60 µg/dL) [28] and 42.96-80.55 µmol/L (240-450 µg/dL), respectively [29]. Gestational anemia was identified as serum ferritin level <0.034 nmol/L (< 15 µg/L) [30], and transferrin saturation < 16% [31].
Assessment of covariates
Information about sociodemographic data and daily micronutrient intake was assessed at the baseline. Sociodemographic factors including age (years), region of residence (northern, central, southern, eastern, and other), education level (high school, undergraduate school, or graduate school), parity (1, 2, or ≥ 3), number of pregnancies, household income (NTD), and gestational trimester (first: 0-12 weeks, second: 13-26 weeks, and third: 27-40 weeks) [32]. Daily micronutrient intake comprised the consumption of energy (kcal), macronutrients (g and % of energy), folate (µg), vitamin B12 (µg), vitamin D (µg), and iron (mg).
Statistical analysis
Participants' baseline characteristics were compared across serum folate tertiles using Krusal-Wallis test for continuous variables and chi-square test for categorical variables. Kolmogorov-Smirnov test was applied to determine the distribution of the data. Spearman correlation coefficients were computed between micronutrient intake and serum folate levels. The PCA method was performed by PROC PLS tool in SAS 9.4 (SAS, Cary, NC, USA) to categorize 26 food groups into 4 DPs. Factor loadings less than 0.30 were eliminated to streamline the analysis [33]. High factor loadings highlight robust associations of food groups with disease.
We identified the associations of the DPs with iron biomarker levels by generalized linear regression analysis for computing β values and 95% confidence intervals (CIs). Model 1 was a crude model. Model 2 was adjusted for sociodemographic factors. Model 3 was adjusted for model 2 and daily nutrient consumption. Next, we classified the DP scores in each DP into 3 equally dispersed groups tertiles 1-3 (T1-T3) with increased DP scores, and T1 was designated as the reference group.
Subsequently, we determined the odds ratio (OR) and its respective 95% CIs to evaluate the relationship between DPs (across the tertiles of each DP) and abnormal levels of serum biomarkers. This analysis employed the multivariable logistic regression with adjustments for the identical covariates incorporated in the generalized linear regression models mentioned previously. Incorporating categorical variables into the model involved dummy coding where binary variables were generated to represent every category within the categorical variables. The reference group for region of residence, education level, parity, or trimester was northern region, high school, 1 parity, or trimester first, respectively. Analyses were performed utilizing R programming software (version 4.1.3, R Development Core Team, Vienna, Austria). All p values of ≤ 0.05 were identified as the statistical significance.
Results
Subject characteristics
Table 1 presents participants' characteristics stratified by the tertiles of serum folate levels. Individuals in T3 of serum folate had the highest average age. The participants in T3 of serum folate had a higher proportion of being resident in the northern region (35.6%), having an undergraduate degree (74.5%), having one parity (52.1%), and being in trimester first (31.5%) compared to those in other tertiles.
Characteristics of pregnant women with pre-pregnancy overweightness or obesity across the tertiles of serum folate (n = 436)
| Variables | Total (n) | Tertiles of serum folate | p | |||
|---|---|---|---|---|---|---|
| T1 (n = 140- 145) | T2 (n = 140- 146) | T3 (n = 141-146) | ||||
| Age, years | 436 | 31.9 ± 5.2 | 32.9 ± 4.9 | 33.9 ± 4.9 | 0.003 | |
| Region of residence, n (%) | 435 | < 0.001 | ||||
| Northern | 116 (26.7) | 26 (8.1) | 38 (26.2) | 52 (35.6) | ||
| Central | 108 (24.8) | 45 (31.2) | 36 (24.8) | 27 (18.5) | ||
| Southern | 98 (22.5) | 22 (15.3) | 33 (23.1) | 43 (29.5) | ||
| Easter and other | 113 (26.0) | 51 (35.4) | 38 (25.9) | 24 (16.4) | ||
| Education level, n (%) | 435 | < 0.001 | ||||
| High school | 90 (20.7) | 50 (34.5) | 24 (16.7) | 16 (11.0) | ||
| Undergraduate | 297 (68.3) | 86 (59.3) | 104 (70.1) | 107 (74.5) | ||
| Graduate | 48 (11.0) | 9 (6.2) | 18 (13.2) | 21 (14.5) | ||
| Parity, n (%) | 434 | < 0.001 | ||||
| 1 | 195 (44.9) | 45 (31.0) | 75 (51.7) | 75 (52.1) | ||
| 2 | 183 (42.2) | 68 (46.9) | 57 (39.3) | 58 (40.3) | ||
| ≥ 3 | 56 (12.9) | 32 (22.1) | 13 (9.0) | 11 (7.6) | ||
| Number of pregnancies, n (%) | 424 | 0.699 | ||||
| 1 | 413 (97.4) | 140 (97.9) | 137 (97.9) | 136 (96.5) | ||
| ≥ 2 | 11 (2.6) | 3 (2.1) | 3 (2.1) | 5 (3.5) | ||
| Household income, n (%) | 424 | 0.160 | ||||
| < 30,000 NTD | 63 (14.8) | 28 (20.0) | 13 (9.2) | 22 (15.4) | ||
| 30,000-60,000 NTD | 197 (46.5) | 61 (43.6) | 71 (50.4) | 65 (45.5) | ||
| ≥ 60,000 NTD | 164 (38.7) | 51 (36.4) | 57 (40.4) | 56 (39.1) | ||
| Trimesters, n (%) | 436 | 0.003 | ||||
| First | 104 (23.8) | 25 (17.2) | 33 (22.8) | 46 (31.5) | ||
| Second | 146 (33.5) | 41 (28.3) | 56 (38.6) | 49 (33.6) | ||
| Third | 186 (42.7) | 79 (54.5) | 56 (38.6) | 51 (34.9) | ||
Data are given as mean ± SD or n (%). Kruskal-Wallis test was used for continuous variables, and chi-square test was used for categorical variables. SD: standard deviation; T: tertile.
The participants in T3 of serum folate (46.7 ± 7.2 nmol/L) tended to have elevated levels of serum vitamin B12 (325.3 ± 139.0 pmol/L), iron (14.9 ± 7.0 mmol/L), and ferritin (0.07 ± 0.06 nmol/L), however, their TIBC levels were comparatively lower (78.9 ± 16.2 µmol/L) (Table 2).
Biochemical characteristics of pregnant women with pre-pregnancy overweightness or obesity across the tertiles of serum folate (n = 436)
| Serum variables | Tertiles of serum folate | |||
|---|---|---|---|---|
| T1 (n = 145) | T2 (n = 145) | T3 (n = 146) | p | |
| Folate, nmol/L | 10.9 ± 3.8 | 24.8 ± 4.2 | 46.7 ± 7.2 | <0.05 |
| Vitamin B12, pmol/L | 240.2 ± 129.8 | 298.1 ± 146.9 | 325.3 ± 139.0 | <0.05 |
| 25(OH) Vitamin D, nmol/L | 60.6 ± 20.2 | 65.1 ± 19.2 | 70.8 ± 23.1 | 0.051 |
| Hemoglobin, mmol/L | 7.2 ± 1.3 | 7.5 ± 1.3 | 7.5 ± 1.2 | 0.070 |
| Iron, µmol/L | 9.6 ± 4.5 | 11.9 ± 4.9 | 14.9 ± 7.0 | <0.05 |
| Ferritin, nmol/L | 0.04 ± 0.06 | 0.05 ± 0.05 | 0.07 ± 0.06 | <0.05 |
| TIBC, µmol/L | 90.6 ± 19.8 | 82.3 ± 15.6 | 78.9 ± 16.2 | <0.05 |
| Transferrin saturation, % | 18.0 ± 10.7 | 16.1 ± 9.5 | 16.3 ± 8.9 | 0.172 |
Data are given as mean ± SD. Kruskal-Wallis test was used for continuous variables. SD: standard deviation; T: tertile; TIBC: total iron-binding capacity
Association of nutrient intake with serum folate levels
Table 3 indicates Spearman's correlation coefficients of daily nutrient intake with serum folate levels among pregnant women with pre-pregnancy overweightness or obesity. The intakes of protein in terms of g (ρ: 0.18; p = 0.044) or % of energy (ρ: 0.15; p = 0.002), folate (ρ: 0.12; p = 0.010), and iron (ρ: 0.11; p = 0.018) were positively correlated to serum folate levels. Supplement intake including multivitamins/multiminerals (ρ: 0.39; p < 0.001), folate (ρ: 0.50; p = 0.042), and calcium (ρ: 0.12; p = 0.043) had a positive correlation with serum folate levels (Supplementary Table 2). Milk powder, vitamin B complex, vitamin D, and iron supplements were not evaluated because the consumption frequency was below 20%.
Spearman's correlation coefficients between nutrient intake and serum folate levels among pregnant women with pre-pregnancy overweightness or obesity (n = 436)
| Nutrient intake | Serum folate | |
|---|---|---|
| ρ | p | |
| Energy, kcal | 0.01 | 0.785 |
| Carbohydrate, g | -0.03 | 0.943 |
| Carbohydrate, % of energy | -0.05 | 0.921 |
| Protein, g | 0.18 | 0.044 |
| Protein, % of energy | 0.15 | 0.002 |
| Fat, g | -0.02 | 0.615 |
| Fat, % of energy | -0.04 | 0.461 |
| Folate, µg | 0.12 | 0.010 |
| Vitamin B12, µg | 0.03 | 0.499 |
| Vitamin D, µg | 0.02 | 0.959 |
| Iron, mg | 0.11 | 0.018 |
Dietary patterns
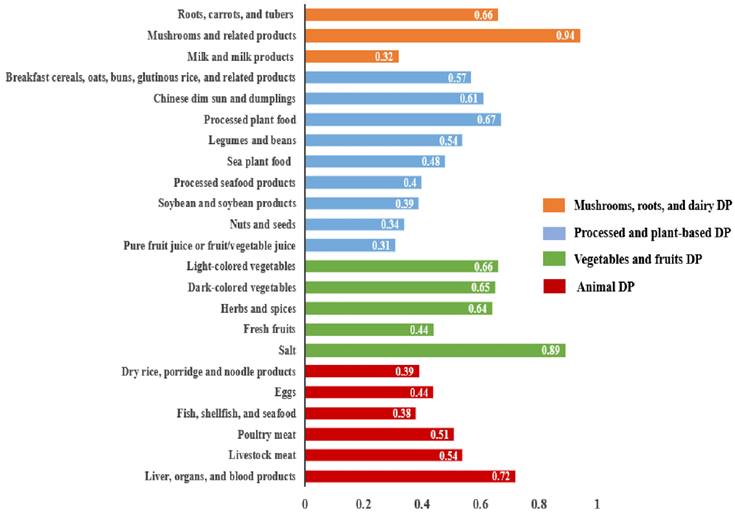
The PCA results indicated 4 distinct DPs shown in Figure 1. These 4 DPs accounted for a total variance of 10.1% (2.8%, 2.6%, 2.5%, and 2.2%, respectively). DPs were classified and ranked based on a threshold factor loading value of > 0.30. Each DP was named regarding its respective factor loading values and the underlying structure of dietary components. The DP-1 was named as mushrooms, roots, and dairy DP, consisting of 3 food groups: mushrooms and related products; roots, carrots, and tubers; and milk and milk products. The DP-2 was named as processed and plant-based DP. It encompassed 9 food groups: processed plant foods; Chinese dim sun and dumplings; breakfast, cereals, oats, buns, glutinous rice, and related products; legumes and beans; sea plant food; processed seafood products; soybean and soybean products; nuts and seeds; and pure fruit juice or fruit/vegetable juice. The DP-3 was named as vegetables and fruits DP, comprising 5 food groups: salt; light-colored vegetables; dark-colored vegetables; herbs and spices; and fresh fruits. The DP-4 was named as animal DP which consisted of 6 food groups: liver, organs, and blood products; livestock meat; poultry meat; eggs; dry rice, porridge, and noodle products; and fish, shellfish, and seafood.
Four distinct dietary patterns derived from principal component analysis.
Associations of DPs with serum anemia-related biomarkers
Table 4 shows the association of mushrooms, roots, and dairy DP (DP-1) with serum anemia-related biomarkers among pregnant women with pre-pregnancy overweightness or obesity. In all 3 models, the DP-1 was positively associated with an elevation in serum folate levels, with values ranging from 0.038 to 0.052 nmol/L across the 3 models. Additionally, the DP-1 was linked to a 0.004 nmol/L reduction in serum ferritin level in model 1 (β = -0.004, 95% CI = -0.008-(-0.001); p < 0.05), however, there was no association after covariate adjustment. The processed and plant-based DP (DP-2) presented no association with anemia-related biomarkers (Supplementary Table 3).
Generalized linear regression analysis for the association of mushrooms, roots, and dairy DP (DP-1) with serum anemia-related biomarkers among pregnant women with pre-pregnancy overweightness or obesity (n = 436)
| Variables | Model 1 | Model 2 | Model 3 |
|---|---|---|---|
| β (95% CI) | β (95% CI) | β (95% CI) | |
| Folate, nmol/L | 0.038 (0.007, 0.112)* | 0.052 (0.008, 0.118)* | 0.052 (0.008, 0.119)* |
| Vitamin B12, pmol/L | -0.536 (-1.160, 0.089) | -0.328 (-0.921, 0.265) | -0.287 (-0.888, 0.314) |
| 25(OH) Vitamin D, nmol/L | 0.027 (-0.011, 0.064) | 0.022 (-0.002, 0.006) | 0.024 (-0.068, 0.117) |
| Hemoglobin, mmol/L | -0.003 (-0.008, 0.003) | -0.001 (-0.006, 0.005) | 0.001 (-0.006, 0.005) |
| Iron, µmol/L | -0.007 (-0.034, 0.019) | -0.001 (-0.024, 0.027) | -0.002 (-0.003, 0.029) |
| Ferritin, nmol/L | -0.004 (-0.008, -0.001)* | -0.001 (-0.002, 0.001) | -0.001 (-0.003, 0.002) |
| TIBC, µmol/L | 0.077 (-0.002, 0.155) | 0.037 (-0.026, 0.099) | 0.037 (-0.026, 0.101) |
| Transferrin saturation, % | -0.011 (-0.053, 0.032) | -0.012 (-0.055, 0.032) | -0.009 (-0.052, 0.035) |
Model 1 was for crude values from an unadjusted model. Model 2 was adjusted for age, region, education level, parity, and trimester. Model 3 was adjusted for model 2 plus daily nutrient intake such as protein (g and % of energy), folate (µg), and iron (mg). * p ≤ 0.05. CI: confidence interval; DP: dietary pattern; TIBC: total iron-binding capacity.
The DP rich in vegetables and fruits (DP-3) exhibited increased associations in serum folate levels by 0.039 nmol/L, 0.049 nmol/L, and 0.056 nmol/L in models 1-3, respectively (Table 5). The DP-3 was related to a decrease in serum iron levels by 0.031 µmol/L in model 1 (95% CI = -0.052- (-0.010); p < 0.05), and a decline in serum ferritin levels ranging between 0.015 and 0.016 nmol/L in all 3 models.
Generalized linear regression analysis for the association of vegetables and fruits DP (DP-3) with serum anemia-related biomarkers among pregnant women with pre-pregnancy overweightness or obesity (n = 436)
| Variables | Model 1 | Model 2 | Model 3 |
|---|---|---|---|
| β (95% CI) | β (95% CI) | β (95% CI) | |
| Folate, nmol/L | 0.039 (0.021, 0.051)* | 0.049 (0.022, 0.065)* | 0.056 (0.034, 0.076)* |
| Vitamin B12, pmol/L | -0.055 (-0.564, 0.453) | 0.066 (-0.421, 0.554) | 0.129 (-0.365, 0.623) |
| 25(OH) Vitamin D, nmol/L | 0.012 (-0.064, 0.088) | -0.019 (-0.094, 0.057) | -0.034 (-0.110, 0.041) |
| Hemoglobin, mmol/L | -0.004 (-0.008, 0.001) | -0.002 (-0.006, 0.003) | -0.002 (-0.006, 0.003) |
| Iron, µmol/L | -0.031 (-0.052, -0.010)* | -0.019 (-0.040, 0.002) | -0.020 (-0.041, 0.001) |
| Ferritin, nmol/L | -0.016 (-0.028, -0.009)* | -0.015 (-0.026, -0.008)* | -0.016 (-0.025, -0.007)* |
| TIBC, µmol/L | 0.062 (-0.001, 0.126) | 0.042 (-0.009, 0.093) | 0.045 (-0.006, 0.097) |
| Transferrin saturation, % | 0.003 (-0.032, 0.038) | 0.001 (-0.035, 0.036) | 0.002 (-0.034, 0.038) |
Model 1 was for crude values from an unadjusted model. Model 2 was adjusted for age, region, education level, parity, and trimester. Model 3 was adjusted for model 2 plus daily nutrient intake such as protein (g and % of energy), folate (µg), and iron (mg). * p ≤ 0.05. CI: confidence interval; DP: dietary pattern; TIBC: total iron-binding capacity.
Animal DP (DP-4) exhibited the associations with anemia-related biomarkers among pregnant women with pre-pregnancy overweightness or obesity (Table 6). Across the 3 models, the DP-4 was associated with elevated serum vitamin B12 levels by 0.244-0.321 pmol/L. Correspondingly, the DP-4 was also correlated to increased serum iron levels by 0.015-0.025 µmol/L and elevated serum ferritin levels by 0.014-0.022 µmol/L across the 3 models.
Generalized linear regression analysis for the association of animal DP (DP-4) with serum anemia-related biomarkers among pregnant women with pre-pregnancy overweightness or obesity (n = 436)
| Variables | Model 1 | Model 2 | Model 3 |
|---|---|---|---|
| β (95% CI) | β (95% CI) | β (95% CI) | |
| Folate, nmol/L | 0.002 (-0.071, 0.072) | 0.025 (-0.043, 0.092) | 0.024 (-0.046, 0.093) |
| Vitamin B12, pmol/L | 0.244 (0.066, 0.509)* | 0.248 (0.073, 0.567)* | 0.321 (0.089, 0.571)* |
| 25(OH) Vitamin D, nmol/L | 0.053 (-0.037, 0.142) | 0.034 (-0.054, 0.122) | 0.009 (-0.080, 0.098) |
| Hemoglobin, mmol/L | 0.017 (-0.008, 0.023) | 0.018 (-0.006, 0.024) | 0.020 (-0.007, 0.040) |
| Iron, µmol/L | 0.015 (0.007, 0.026)* | 0.016 (0.009, 0.040)* | 0.025 (0.017, 0.049)* |
| Ferritin, nmol/L | 0.014 (0.008, 0.028)* | 0.016 (0.009, 0.032)* | 0.022 (0.009, 0.046)* |
| TIBC, µmol/L | -0.068 (-0.088, 0.143) | -0.033 (-0.057, 0.093) | -0.038 (-0.063, 0.100) |
| Transferrin saturation, % | 0.002 (-0.039, 0.043) | 0.002 (-0.039, 0.043) | 0.005 (-0.037, 0.047) |
Model 1 was for crude values from an unadjusted model. Model 2 was adjusted for age, region, education level, parity, and trimester. Model 3 was adjusted for model 2 plus daily nutrient intake such as protein (g and % of energy), folate (µg), and iron (mg). * p ≤ 0.05. CI: confidence interval; DP: dietary pattern; TIBC: total iron-binding capacity.
Associations of DPs with the risk of low serum anemia-related biomarkers
The results of the binomial logistic regression analysis for the relationship between DP-1 and the risk of low anemia-related biomarkers among pregnant women with pre-pregnancy overweightness or obesity are presented in Table 7. The participants consuming DP-1 at higher levels (T2 and/or T3) demonstrated a lower risk of low serum folate levels than those who had less DP-1 consumption (T1) in all 3 models. In model 1, the participants with a higher consumption level (T2) of DP-1 showed a reduced risk of low serum ferritin levels (OR = 0.806, 95% CI = 0.604-0.976; p < 0.05) compared to those consumed lower DP-1 (T1), however, no significant associations were observed after adjusting for covariates. The DP-2 did not indicate foremost relationships with serum anemia-related biochemical indicators, except for serum folate levels (Supplementary Table 4). The respondents consuming higher levels (T2 and/or T3) of DP-2 had a decreased risk of low serum folate levels in all 3 models.
Odds ratios for low serum anemia-related biomarkers across the tertiles of mushrooms, roots, and dairy DP (DP-1) by binomial logistic regression analysis among pregnant women with pre-pregnancy overweightness or obesity (n = 436)
| Mushrooms, roots, and dairy DP (DP-1) | ||||||||
|---|---|---|---|---|---|---|---|---|
| Variables | Model 1 OR (95% CI) | Model 2 OR (95% CI) | Model 3 OR (95% CI) | |||||
| T2 | T3 | T2 | T3 | T2 | T3 | |||
| Folate, nmol/L | 0.508 (0.296, 0.872)* | 0.482 (0.280, 0.830)* | 0.637 (0.349, 1.163) | 0.395 (0.214, 0.730)* | 0.650 (0.354, 1.192) | 0.378 (0.202, 0.709)* | ||
| Vitamin B12, pmol/L | 0.952 (0.469, 1.930) | 0.944 (0.466, 1.915) | 0.972 (0.455, 2.077) | 0.853 (0.407, 1.788) | 1.013 (0.472, 2.178) | 0.895 (0.418, 1.194) | ||
| 25(OH) Vitamin D, nmol/L | 0.856 (0.513, 1.438) | 0.693 (0.419, 1.144) | 0.860 (0.503, 1.470) | 0.757 (0.451, 1.272) | 0.813 (0.492, 1.178) | 0.705 (0.418, 1.114) | ||
| Hemoglobin, mmol/L | 0.602 (0.316, 1.145) | 1.291 (0.735, 2.267) | 0.806 (0.402, 1.616) | 1.214 (0.661, 2.231) | 0.821 (0.408, 1.654) | 1.257 (0.676, 2.338) | ||
| Iron, µmol/L | 0.819 (0.588, 1.187) | 0.836 (0.527, 1.324) | 0.660 (0.406, 1.073) | 0.775 (0.480, 1.251) | 0.663 (0.406, 1.083) | 0.757 (0.463, 1.238) | ||
| Ferritin, nmol/L | 0.806 (0.604, 0.976) | 1.413 (0.891, 2.243) | 1.188 (0.693, 2.036) | 1.295 (0.756, 2.221) | 1.174 (0.683, 2.016) | 1.245 (0.721, 2.149) | ||
| TIBC, µmol/L | 0.005 (0.004, 0.006) | 0.005 (0.004, 0.006) | 0.004 (0.003, 0.005) | 0.004 (0.003, 0.005) | 0.004 (0.02, 0.005) | 0.004 (0.02, 0.005) | ||
| Transferrin saturation, % | 1.030 (0.649, 1.633) | 0.934 (0.590, 1.479) | 1.013 (0.631, 1.625) | 0.932 (0.583, 1.489) | 1.009 (0.628, 1.621) | 0.887 (0.551, 1.428) | ||
Model 1 was for crude values from an unadjusted model. Model 2 was adjusted for age, region, education level, parity, and trimester. Model 3 was adjusted for model 2 plus daily nutrient intake such as protein (g and % of energy), folate (µg), and iron (mg). Serum anemia-related variables were categorized into two levels based on serum cutoff values: folate, 13.6 nmol/L (6 ng/mL); vitamin B12, 149.8 pmol/L (203 pg/mL); 25(OH) vitamin D, 75 nmol/L (30 ng/mL); hemoglobin, 6.52 mmol/L (10.5 g/dL); iron, 10.7 µmol/L (60 µg/dL), ferritin, 0.034 nmol/L (15 ng/mL); TIBC, 42.96 µmol/L (240 µg/dL); and transferrin saturation, 16%. Dietary pattern scores were classified into tertiles: T1 (reference), 0.49-13.68; T2, > 13.90-21.09; and T3 > 21.12-136.20. * p ≤ 0.05. CI: confidence interval; DP: dietary pattern; ORs: Odds ratios; TIBC: total iron-binding capacity.
Table 8 depicts the association of DP-3 with the risk of low anemia-related biomarkers among pregnant women with pre-pregnancy overweightness or obesity. In all 3 models, the participants with increased DP-3 intake (T2 and T3) were associated with a decreased risk of low serum folate. The subjects with the highest consumption (T3) of DP-3 were correlated to an increased risk of low serum vitamin B12 (OR = 2.115, 95% CI = 1.036-4.321; p < 0.05) in model 1. The participants with the highest intake (T3) of DP-3 were linked to an elevated risk of low serum ferritin levels with ORs of 2.390 (95% CI = 1.491-3.833; p < 0.05) in model 1, 2.414 (95% CI = 1.391-4.189; p < 0.05) in model 2, and 2.367 (95% CI = 1.356-4.132; p < 0.05) in model 3.
Odds ratios for low serum anemia-related biomarkers across the tertiles of vegetables and fruits DP (DP-3) by binomial logistic regression analysis among pregnant women with pre-pregnancy overweightness or obesity (n = 436)
| Vegetables and fruits DP (DP-3) | ||||||||
|---|---|---|---|---|---|---|---|---|
| Variables | Model 1 OR (95% CI) | Model 2 OR (95% CI) | Model 3 OR (95% CI) | |||||
| T2 | T3 | T2 | T3 | T2 | T3 | |||
| Folate, nmol/L | 0.610 (0.510, 0.861)* | 0.552 (0.469, 0.8.97)* | 0.852 (0.524, 0.942)* | 0.763 (0.450, 0.895)* | 0.756 (0.430, 0.915)* | 0.462 (0.342, 0.714)* | ||
| Vitamin B12, pmol/L | 1.077 (0.488, 2.379) | 2.115 (1.036, 4.321)* | 1.036 (0.458, 2.342) | 1.901 (0.902, 4.004) | 1.062 (0.466, 2.422) | 1.975 (0.922, 4.231) | ||
| 25(OH) Vitamin D, nmol/L | 0.835 (0.509, 1.369) | 1.107 (0.665, 1.842) | 0.898 (0.537, 1.500) | 1.303 (0.765, 2.219) | 0.953 (0.565, 1.606) | 1.515 (0.873, 2.630) | ||
| Hemoglobin, mmol/L | 0.852 (0.456, 1.592) | 1.470 (0.825, 2.619) | 0.754 (0.386, 1.473) | 1.100 (0.588, 2.056) | 0.728 (0.370, 1.434) | 1.081 (0.572, 2.043) | ||
| Iron, µmol/L | 1.348 (0.845, 2.149) | 1.703 (1.068, 2.716)* | 1.319 (0.815, 2.133) | 1.456 (0.897, 2.363)* | 1.315 (0.808, 2.139) | 1.435 (0.876, 2.352) | ||
| Ferritin, nmol/L | 1.377 (0.867, 2.187) | 2.390 (1.491, 3.833)* | 1.460 (0.857, 2.488) | 2.414 (1.391, 4.189)* | 1.458 (0.853, 2.493) | 2.367 (1.356, 4.132)* | ||
| TIBC, µmol/L | 0.05 (0.03, 0.07) | 0.05 (0.03, 0.07) | 0.003 (0.002, 0.004) | 0.003 (0.002, 0.004) | 0.003 (0.001, 0.004) | 0.003 (0.001, 0.004) | ||
| Transferrin saturation, % | 0.705 (0.443, 1.121) | 0.623 (0.391, 0.991)* | 0.720 (0.450, 1.152) | 0.632 (0.392, 1.017) | 0.713 (0.445, 1.143) | 0.601 (0.371, 0.975) | ||
Model 1 was for crude values from an unadjusted model. Model 2 was adjusted for age, region, education level, parity, and trimester. Model 3 was adjusted for model 2 plus daily nutrient intake such as protein (g and % of energy), folate (µg), and iron (mg). Serum anemia-related variables were categorized into two levels based on serum cutoff values: folate, 13.6 nmol/L (6 ng/mL); vitamin B12, 149.8 pmol/L (203 pg/mL); 25(OH) vitamin D, 75 nmol/L (30 ng/mL); hemoglobin, 6.52 mmol/L (10.5 g/dL); iron, 10.7 µmol/L (60 µg/dL), ferritin, 0.034 nmol/L (15 ng/mL); TIBC, 42.96 µmol/L (240 µg/dL); and transferrin saturation, 16%. Dietary pattern scores were classified into tertiles: T1 (reference), 5.37-49.06; T2, > 49.50-77.47; and T3 > 77.54-121.80. * p ≤ 0.05. CI: confidence interval; DP: dietary pattern; ORs: Odds ratios; TIBC: total iron-binding capacity.
The relationship between DP-4 and the risk of low anemia-related biomarkers among pregnant women with pre-pregnancy overweightness or obesity is displayed in Table 9. The participants with higher intake (T2 and T3) of DP-4 were correlated to a decreased likelihood of low serum vitamin B12 levels in both models 2 and 3, and associated with a reduced risk of low serum iron levels in all 3 models.
Odds ratios for low serum anemia-related biomarkers across the tertiles of animal DP (DP-4) by binomial logistic regression analysis among pregnant women with pre-pregnancy overweightness or obesity (n = 436)
| Animal DP (DP-4) | |||||||
|---|---|---|---|---|---|---|---|
| Variables | Model 1 OR (95% CI) | Model 2 OR (95% CI) | Model 3 OR (95% CI) | ||||
| T2 | T3 | T2 | T3 | T2 | T3 | ||
| Folate, nmol/L | 0.617 (0.354, 1.075) | 0.931 (0.552, 1.572) | 0.598 (0.325, 1.099) | 0.702 (0.392, 1.259) | 0.600 (0.324, 1.111) | 0.698 (0.386, 1.262) | |
| Vitamin B12, pmol/L | 0.827 (0.449, 1.213) | 0.840 (0.564, 1.284) | 0.626 (0.413, 0.852)* | 0.615 (0.470, 0.819)* | 0.705 (0.511, 0.874)* | 0.456 (0.302, 0.629)* | |
| 25(OH) Vitamin D, nmol/L | 1.400 (0.847, 2.315) | 1.172 (0.715, 1.920) | 1.394 (0.828, 2.348) | 1.235 (0.740, 2.060) | 1.449 (0.851, 2.469) | 1.436 (0.845, 2.439) | |
| Hemoglobin, mmol/L | 0.806 (0.429, 1.217) | 1.027 (0.860, 1.214) | 0.785 (0.400, 1.138) | 0.953 (0.675, 1.326) | 0.775 (0.403, 1.167) | 0.877 (0.684, 2.384) | |
| Iron, µmol/L | 0.802 (0.639, 0.959)* | 0.804 (0.642, 0.962)* | 0.805 (0.640, 0.964)* | 0.809 (0.654, 0.968)* | 0.806 (0.651, 0.965)* | 0.810 (0.673, 0.967)* | |
| Ferritin, nmol/L | 0.832 (0.715, 1.092) | 0.837 (0.754, 1.153) | 0.863 (0.698, 1.140) | 0.902 (0.750, 1.146) | 0.865 (0.779, 1.167) | 0.927 (0.756, 1.238) | |
| TIBC, µmol/L | 0.005 (0.003, 0.007) | 0.005 (0.003, 0.007) | 0.005 (0.002, 0.006) | 0.004 (0.002, 0.005) | 0.004 (0.002, 0.005) | 0.003 (0.002, 0.004) | |
| Transferrin saturation, % | 0.882 (0.556, 1.399) | 0.758 (0.478, 1.203) | 0.879 (0.551, 1.405) | 0.759 (0.475, 1.211) | 0.872 (0.545, 1.397) | 0.730 (0.454, 1.172) | |
Model 1 was for crude values from an unadjusted model. Model 2 was adjusted for age, region, education level, parity, and trimester. Model 3 was adjusted for model 2 plus daily nutrient intake such as protein (g and % of energy), folate (µg), and iron (mg). Serum anemia-related variables were categorized into two levels based on serum cutoff values: folate, 13.6 nmol/L (6 ng/mL); vitamin B12, 149.8 pmol/L (203 pg/mL); 25(OH) vitamin D, 75 nmol/L (30 ng/mL); hemoglobin, 6.52 mmol/L (10.5 g/dL); iron, 10.7 µmol/L (60 µg/dL), ferritin, 0.034 nmol/L (15 ng/mL); TIBC, 42.96 µmol/L (240 µg/dL); and transferrin saturation, 16%. Dietary pattern scores were classified into tertiles: T1 (reference), 3.56-28.29; T2, > 28.41-46.67; and T3 > 46.74-162.00. * p ≤ 0.05. CI: confidence interval; DP: dietary pattern; ORs: Odds ratios; TIBC: total iron-binding capacity.
Discussion
Our study highlighted significant associations of nutrient intake such as protein, folate, and iron with serum folate levels in pregnant women with pre-pregnancy overweightness or obesity. Additionally, serum vitamin B12, iron, ferritin, and TIBC exhibited positive associations with serum folate. These findings are supported by previous studies. Iron-deficiency anemia was identified as being related to low serum folate levels in pregnant women [34], and the normalization of folate distribution between plasma and erythrocytes was observed with oral iron treatment only [35], suggesting that iron intake could be positively correlated with serum folate status. Furthermore, a substantial prevalence of serum folate insufficiency was found in iron-deficiency anemia patients, and could be improved with intravenous iron treatment [36]. The interaction of iron and folate absorption may be promoted by heme carrier protein 1 that acts as a proton-coupled folate transporter [37]. Our finding showed that serum vitamin D status tended to be increased with elevated serum folate levels, but did not reach to the significant level (P = 0.051). A previous study found that serum vitamin D levels were not correlated to serum folate levels (r = 0.09) in pregnant women [38].
Our study indicated that the intake of DP-1 (mushrooms, roots, and dairy DP) and DP-3 (vegetables and fruits DP) were associated with an increase in serum folate levels. These findings are supported by previous studies. Vegetables, fruits, legumes, and cereals are recognized as the primary dietary sources of folate [39]. Pregnant women who had knowledge about folate-rich foods were observed to be less likely to experience folate deficiency [40]. A DP rich in vegetables and fruits positively influenced folate intake during pregnancy [41, 42]. Additionally, dietary folate intake was found to be associated with serum folate levels in pregnant women [43]. Pregnant women with obesity were found to be associated with insufficient DP of vegetables [44]. Women with pre-pregnancy overweightness and obesity were reported to have lower serum folate and an increased risk of serum folate deficiency [45]. Pregnant women with ovo-lacto vegetarian had higher plasma folate concentration, and a lower risk of folate deficiency [46]. Since serum folate concentration could reflect recent dietary folate intake [47], the associations we identified between the DP and serum folate levels are likely to be comparable and reasonable.
The current study observed an association between the consumption of fruits and vegetables and a decrease in serum ferritin, but no such association was found with serum hemoglobin levels. Flynn et al. (2018) observed no difference in serum ferritin levels between the pregnant women with obesity and those with normal weight [48]. Serum ferritin serves as an indicator of iron status during pregnancy [49]. Fruits and vegetables, rich in dietary fiber, are good sources of nonheme iron which could be absorbed less efficiently in the intestine compared to heme iron [50] due to the inhibitory effect of phytates co-existing in fruits and vegetables on nonheme iron absorption [51]. In addition, polyphenols presented in fruits and vegetables could also decrease iron absorption and further lower ferritin concentrations [52]. Our study revealed that the consumption of DP-4 exhibited a significant reduction in the risk of low serum iron and vitamin B12. Animal foods are the most abundant sources of bioavailable dietary iron. Approximately 40% of total iron in meat, fish, and poultry is in the heme form, which is more readily absorbed than non-heme iron [53]. The consumption of iron-rich food from fish and seafood was commonly reported, while the intake of other animal sources of iron, such as organ meat and flesh meat, was less among pregnant women from a rural area in Northern Ghana [54]. Higher red and processed meat consumption had a positive association with increased levels of proinflammatory markers among women with overweightness and obesity [55]. Adiposity-driven low-grade inflammation reduced iron bioavailability by elevating hepcidin levels, which inhibited iron absorption and efflux [56, 57]. Low intake of iron-rich foods from animal sources could potentially increase the risk of iron-deficiency anemia among pregnant women [54]. Women with pre-pregnancy overweightness or obesity had increased risks of developing iron and vitamin B12 deficiencies compared to those with normal weight [45, 58]. In addition, pregnant women adhering to carnivore DP exhibited a reduced risk of low serum vitamin B12 [59]. A low-animal-product diet increased the risk of vitamin B12 insufficiency because nutrient-dense animal foods are major sources of vitamin B12 [60]. A previous study also indicated that higher intakes of meat and fish were positively associated with increased plasma concentration of vitamin B12 and a reduced risk of vitamin B12 deficiency in pregnant Dutch women [61].
The current study has several strengths. First, our study undertook a comprehensive assessment of both micronutrient intake and DPs with serum folate status and iron biomarkers in a well-defined population. The novel evidence of our results could assist healthcare professionals and pregnant women in making informed decisions regarding the consumption of dietary supplement. Second, data were collected from diverse regions in Taiwan, and served as a representative sample for the Taiwanese population.
Nonetheless, our study comes with certain limitations. First, we depended on self-administrated dietary data such as FFQ, which could introduce systematic under-reporting or recall bias in energy and/or nutrient consumption. To address and mitigate the biases associated with the FFQ, we took additional measures by collecting 24-hour dietary recall data. Second, certain confounders such as pathological conditions, parathyroid hormone levels, hepcidin levels, and intake of vitamin C among these pregnant women were not available for our analysis. Third, this study could not incorporate some lifestyle factors such as physical activity, cigarette smoking, and alcohol use.
Conclusions
The intake of protein, folate, and iron was associated with serum folate levels. The consumption of DP-1 (mushrooms, roots, and dairy dietary pattern) or DP-3 (vegetables and fruits dietary pattern) was associated with an elevation in serum folate levels. Additionally, the intake of DP-4 (animal dietary pattern) exhibited a significant association with higher levels of serum iron, ferritin, and vitamin B12.
DP-1 consumption was associated with a decreased risk of low serum folate. DP-3 use had an association with an increased risk of low serum ferritin, but with a reduced odds of low serum folate levels. Pregnant women consuming DP-4 had a lower risk of low serum iron and vitamin B12 levels. Our findings could contribute to raising awareness on this topic for healthcare professionals and researchers, and provide novel evidence for further investigations to confirm the associations of DPs with iron biomarkers among pregnant women with pre-pregnancy overweightness or obesity.
Abbreviations
BMI: body mass index; CI: confidence interval; DP: dietary pattern; FFQ: food frequency questionnaire; Hb: hemoglobin; OR: odds ratio; PCA: principal component analysis; RBC: red blood cells; TIBC: total iron-binding capacity.
Supplementary Material
Supplementary tables.
Acknowledgements
We express our gratitude to the team responsible for Nationwide Nutrition and Health Survey in Taiwan among pregnant women for providing their data accessibility for our study.
Funding
This research did not receive any specific grant from funding agencies in the public, commercial, or not-for-profit sectors.
Data availability statement
Data were extracted from the database of the Nationwide Nutrition and Health Survey in Taiwan and were not publicly accessible.
Ethics statement
The approved research was obtained from the Joint Institutional Review Board of Taipei Medical University (TMU-JIRB N201707039). All the participants signed the written informed consent.
Author contributions
NTH Nguyen, JC-J Chao designed the study. C-H Bai, J-S Chang, Y-C Chen, Y-L Huang, F-F Wang, and C-Y Hsu participated in data curation and validation. NTH Nguyen and A Das performed formal analysis. NTH Nguyen and J-C-J Chao wrote the original draft. NTH Nguyen and J-C-J Chao reviewed and edited the manuscript. All the authors read and approved the final manuscript.
Competing Interests
The authors have declared that no competing interest exists.
References
1. Institute of Medicine. Nutrition during pregnancy: part I weight gain, part II nutrient supplements. Washington DC: National Academies Press. 1990
2. Health Promotion Administration, Ministry of Health, Welfare, Taiwan. Dietary reference intakes. Taipei: Ministry of Health and Welfare, Taiwan. 2020
3. Li M, Chen X, Zhang Y. et al. RBC folate and serum folate, vitamin B-12, and homocysteine in Chinese couples prepregnancy in the Shanghai Preconception Cohort. J Nutr. 2022;152:1496-506
4. Farah N, Kennedy C, Turner C, O'Dwyer V, Kennelly MM, Turner MJ. Maternal obesity and pre-pregnancy folic acid supplementation. Obes Facts. 2013;6:211-5
5. Wang Y, Cao Z, Peng Z. et al. Folic acid supplementation, preconception body mass index, and preterm delivery: findings from the preconception cohort data in a Chinese rural population. BMC Pregnancy Childbirth. 2015;15:336
6. Rayis DA, Karar A, Alshareef SA, Eltayeb R, Adam I. Early pregnancy serum levels of folate and vitamin B12 in overweight and obese women in Khartoum, Sudan. Trans R Soc Trop Med Hyg. 2023;117:128-31
7. Fiscaletti M, Stewart P, Munns CF. The importance of vitamin D in maternal and child health: a global perspective. Public Health Rev. 2017;38:19
8. Migliaccio S, Nisio AD, Magno S. Vitamin D deficiency: a potential risk factor for cancer in obesity? Int J Obes (Lond). 2022;46:707-17
9. Wu Y, Zeng Y, Zhang Q, Xiao X. The role of maternal vitamin D deficiency in offspring obesity: a narrative review. Nutrients. 2023;15:533
10. Bodnar LM, Catov JM, Simhan HN, Holick MF, Powers RW, Roberts J. Maternal vitamin D deficiency increases the risk of preeclampsia. J Clin Endocrinol Metab. 2007;92:3517-22
11. Wawer AA, Hodyl NA, Fairweather-Tait S, Froessler B. Are pregnant women who are living with overweight or obesity at greater risk of developing iron deficiency/anaemia? Nutrients. 2021;13:1572
12. Charnley M, Newson L, Weeks A, Abayomi J. Pregnant women living with obesity: a cross-sectional observational study of dietary quality and pregnancy outcomes. Nutrients. 2021;13:1652
13. Flynn AC, Seed PT, Patel N. et al. Dietary patterns in obese pregnant women; influence of a behavioral intervention of diet and physical activity in the UPBEAT randomized controlled trial. Int J Behav Nutr Phys Act. 2016;13:124
14. Harreiter J, Simmons D, Desoye G. et al. Nutritional lifestyle intervention in obese pregnant women, including lower carbohydrate intake, is associated with increased maternal free fatty acids, 3-β-hydroxybutyrate, and fasting glucose concentrations: a secondary factorial analysis of the European multicenter, randomized controlled DALI lifestyle intervention trial. Diabetes Care. 2019;42:1380-9
15. Bailey RL, West Jr KP, Black RE. The epidemiology of global micronutrient deficiencies. Ann Nutr Metab. 2015;66:22-33
16. Mayasari NR, Hu TY, Chao JCJ. et al. Associations of the pre-pregnancy weight status with anemia and the erythropoiesis-related micronutrient status. Public Health Nutr. 2021;24:6247-57
17. Health Promotion Administration, Ministry of Health, Welfare, Taiwan. Health Promotion Administration annual report. Taipei: Ministry of Health and Welfare, Taiwan. 2016
18. Mayasari NR, Bai CY, Hu TY. et al. Associations of food and nutrient intake with serum hepcidin and the risk of gestational iron-deficiency anemia among pregnant women: a population-based study. Nutrients. 2021;13:3501
19. Jolliffe IT, Cadima J. Principal component analysis: a review and recent developments. Philos Trans A Math Phys Eng Sci. 2016;374:20150202
20. Shane B. Folate status assessment history: implications for measurement of biomarkers in NHANES. Am J Clin Nutr. 2011;94:S337-S342
21. Tsiminis G, Schartner EP, Brooks JL, Hutchinson MR. Measuring and tracking vitamin B12: a review of current methods with a focus on optical spectroscopy. Appl Spectrosc Rev. 2017;52:439-55
22. Abdel-Wareth L, Haq A, Turner A. et al. Total vitamin D assay comparison of the Roche Diagnostics "Vitamin D total" electrochemiluminescence protein binding assay with the Chromsystems HPLC method in a population with both D2 and D3 forms of vitamin D. Nutrients. 2013;5:971-80
23. Pfeiffer CM, Looker AC. Laboratory methodologies for indicators of iron status: strengths, limitations, and analytical challenges. Am J Clin Nutr. 2017;106(Suppl 6):S1606-S1614
24. Yamanishi H, Iyama S, Yamaguchi Y, Kanakura Y, Iwatani Y. Total iron-binding capacity calculated from serum transferrin concentration or serum iron concentration and unsaturated iron-binding capacity. Clin Chem. 2003;49:175-8
25. World Health Organization. Serum and red blood cell folate concentrations for assessing folate status in populations. Geneva: Word Health Organization. 2015
26. de Benoist B. Conclusions of a WHO technical consultation on folate and vitamin B12 deficiencies. Nutr Bull. 2008;29:S238-44
27. Holick F, Binkley NC, Bischoff-Ferrari HA. et al. Evaluation, treatment, and prevention of vitamin D deficiency: an Endocrine Society clinical practice guideline. J Clin Endocrinol Metab. 2011;96:1911-30
28. Bellanger RA. Iron deficiency anemia in women. US Pharm. 2010;35:50-8
29. Sukla SK, Mohanty PK, Patel S. et al. Iron profile of pregnant sickle cell anemia patients in Odisha, India. Hematol Transfus Cell Ther. 2023;45(Suppl 2):S11-S17
30. Word Health Organization. WHO guideline on use of ferritin concentrations to assess iron status in individuals and populations. Geneva: Word Health Organization. 2020
31. World Health Organization. Archived: iron deficiency anemia: assessment, prevention and control. Geneva: Word Health Organization. 2001
32. Amare YE, Haile D. Evaluation of pulmonary function tests among pregnant women of different trimesters in Debre Berhan Referral Hospital, Shoa, Ethiopia. Int J Womens Health. 2020;12:1135-43
33. Kurniawan AL, Hsu CY, Rau HH, Lin LY, Chao JCJ. Dietary patterns in relation to testosterone levels and severity of impaired kidney function among middle-aged and elderly men in Taiwan: a cross-sectional study. Nutr J. 2019;18:42
34. Scholl TO, Johnson WG. Folic acid: influence on the outcome of pregnancy. Am J Clin Nutr. 2000;71(Suppl 5):S1295-S1303
35. Omer A, Finlayson ND, Shearman DJ, Samson RR, Girdwood RH. Plasma and erythrocyte folate in iron deficiency and folate deficiency. Blood. 1970;35:821-8
36. Roberts PD, John DJS, Sinha R. et al. Apparent folate deficiency in iron-deficiency anaemia. Br J Haematol. 1971;20:165-76
37. Lafta AH, Latunde-Dada G, Fakih S, Hider RC, Simpson RJ, McKie AT. Haem and folate transport by proton-coupled folate transporter/haem carrier protein 1 (SLC46A1). Br J Nutr. 2009;101:1150-6
38. Mustafa A. Assessment of vitamin D, vitamin B12, and folate levels in recently identified pregnant females. Cureus. 2024;16:e68514
39. de Bree A, van Dusseldorp M, Brouwer IA, van het Hof KH, Steegers-Theunissen RP. Folate intake in Europe: recommended, actual and desired intake. Eur J Clin Nutr. 1997;51:643-60
40. Mamme NY, Roba HS, Fite MB. et al. Serum folate deficiency and associated factors among pregnant women in Haramaya District, Eastern Ethiopia: a community-based study. BMJ Open. 2023;13:e068076
41. Simmons K, Meloncelli N, Kearney L, Maher J. Low vegetable intake in pregnancy and associated maternal factors: a scoping review. Nutr Res. 2022;99:78-97
42. Mitran AM, Popa AD, Gherasim A. et al. Dietary patterns of pregnant women and their association with diet quality measures: a comparative analysis. Nutrients. 2024;16:1736
43. Berti C, Fekete K, Dullemeijer C. et al. Folate intake and markers of folate status in women of reproductive age, pregnant and lactating women: a meta-analysis. J Nutr Metab. 2012;2012:470656
44. Laraia BA, Bodnar LM, Siega-Riz AM. Pregravid body mass index is negatively associated with diet quality during pregnancy. Public Health Nutr. 2007;10:920-6
45. Scholing JM, Olthof MR, Jonker FA, Vrijkotte TG. Association between pre-pregnancy weight status and maternal micronutrient status in early pregnancy. Public Health Nutr. 2018;21:2046-55
46. Koebnick C, Heins UA, Hoffmann I, Dagnelie PC, Leitzmann C. Folate status during pregnancy in women is improved by long-term high vegetable intake compared with the average western diet. J Nutr. 2001;131:733-9
47. Wild CP, Andersson C, O'Brien NM, Wilson L, Woods JA. A critical evaluation of the application of biomarkers in epidemiological studies on diet and health. Br J Nutr. 2001;86(Suppl 1):S37-S53
48. Flynn AC, Begum S, White SL. et al. Relationships between maternal obesity and maternal and neonatal iron status. Nutrients. 2018;10:1000
49. Arija V, Hernández-Martínez C, Tous M. et al. Association of iron status and intake during pregnancy with neuropsychological outcomes in children aged 7 years: the prospective birth cohort Infancia y Medio Ambiente (INMA) study. Nutrients. 2019;11:2999
50. Hurrell R, Egli I. Iron bioavailability and dietary reference values. Am J Clin Nutr. 2010;91(Suppl):S1461-S1467
51. Al Hasan SM, Hassan M, Saha S, Islam M, Billah M, Islam S. Dietary phytate intake inhibits the bioavailability of iron and calcium in the diets of pregnant women in rural Bangladesh: a cross-sectional study. BMC Nutr. 2016;2:24
52. Xu T, Zhang X, Liu Y. et al. Effects of dietary polyphenol supplementation on iron status and erythropoiesis: a systematic review and meta-analysis of randomized controlled trials. Am J Clin Nutr. 2021;114:780-93
53. Schönfeldt HC, Hall NG. Determining iron bio-availability with a constant heme iron value. J Food Compos Anal. 2011;24:738-40
54. Adjei-Banuah NY, Aduah VA, Ziblim SD, Ayanore MA, Amalba A, Mogre V. Nutrition knowledge is associated with the consumption of iron rich foods: a survey among pregnant women from a rural district in Northern Ghana. Nutr Metab Insights. 2021;14:11786388211039427
55. Shiraseb F, Hosseininasab D, Mirzababaei A. et al. Red, white, and processed meat consumption related to inflammatory and metabolic biomarkers among overweight and obese women. Front Nutr. 2022;9:1015566
56. Sangkhae V, Nemeth E. Regulation of the iron homeostatic hormone hepcidin. Adv Nutr. 2017;8:126-36
57. Köse S, Sözlü S, Bölükbaşi H, Ünsal N, Gezmen-Karadağ M. Obesity is associated with folate metabolism. Int J Vitam Nutr Res. 2020;90:353-64
58. Mayasari NR, Hu TY, Chao JC. et al. Associations of the pre-pregnancy weight status with anaemia and the erythropoiesis-related micronutrient status. Public Health Nutr. 2021;24:6247-57
59. Das A, Bai CH, Chang JS. et al. Associations of dietary patterns and vitamin D levels with iron status in pregnant women: a cross-sectional study in Taiwan. Nutrients. 2023;15:1805
60. Obeid R, Heil SG, Verhoeven MMA, van den Heuvel E, de Groot L, Eussen S. Vitamin B12 intake from animal foods, biomarkers, and health aspects. Front Nutr. 2019;6:93
61. Denissen KFM, Heil SG, Eussen SJPM. et al. Intakes of vitamin B-12 from dairy food, meat, and fish and shellfish are independently and positively associated with vitamin B-12 biomarker status in pregnant Dutch women. J Nutr. 2019;149:131-8
Author contact
![]() Corresponding author: Jane C.-J. Chao, Ph.D., School of Nutrition and Health Sciences, College of Nutrition, Taipei Medical University, 250 Wu-Hsing Street, Taipei 110, Taiwan; Tel.: +886-2-27361661 ext. 6548; Fax: +886-2-27373112; E-mail: chenjuiedu.tw.
Corresponding author: Jane C.-J. Chao, Ph.D., School of Nutrition and Health Sciences, College of Nutrition, Taipei Medical University, 250 Wu-Hsing Street, Taipei 110, Taiwan; Tel.: +886-2-27361661 ext. 6548; Fax: +886-2-27373112; E-mail: chenjuiedu.tw.