Impact Factor ISSN: 1449-1907

 Global reach, higher impact
Int J Med Sci 2025; 22(6):1437-1449. doi:10.7150/ijms.109915 This issue Cite
Research Paper
Preoperative integrated oxidative stress score as a prognostic factor for predicting clinical outcomes in breast cancer patients received neoadjuvant chemotherapy: a real-world retrospective study
Li Chen1*, Caixia Dai2*, Shu Peng3*, Hao Dong1, Xiangyu Wang1 ![]() , Yanfei Liu4
, Yanfei Liu4 ![]() , Jing Wang1
, Jing Wang1 ![]()
1. Department of Breast Surgical Oncology, National Cancer Center/National Clinical Research Center for Cancer/Cancer Hospital, Chinese Academy of Medical Sciences and Peking Union Medical College, Beijing, 100021, P.R. China.
2. Department of Hepatobiliary&Pancreatic Surgery, Zhongnan Hospital of Wuhan University, Wuhan, Hubei, 430071, P.R. China.
3. Department of Thoracic Surgery, Tongji Hospital, Tongji Medical College, Huazhong University of Science and Technology, Wuhan, Hubei 430030, P.R. China.
4. Department of Oncology, Puren Hospital Affiliated to Wuhan University of Science and Technology, Wuhan, Hubei 430081, P.R. China.
* These authors contributed equally to this article.
Received 2025-1-5; Accepted 2025-2-14; Published 2025-2-26
Abstract

Objective: The current study aims to investigate the prognostic value of breast cancer integrated oxidative stress score (BCIOSS) in patients with breast cancer who received neoadjuvant chemotherapy (NACT).
Methods: A retrospective analysis of 104 breast cancer patients who underwent NACT from June 2009 to December 2015 was performed. The differences of BCIOSS of breast cancers in regard to variables were analyzed using Chi-square test and Fisher's exact test. The Kaplan-Meier method was used to evaluate survival curve between low BCIOSS group and high BCIOSS group, and the two groups were compared by Log-rank tests at the individual index level. The univariate and multivariate Cox regression analyses were established by the important predictive factors determined based on univariate analysis. The nomograms were further conducted based on the factors by the multivariate analyses.
Results: Patients were assigned to low BCIOSS group (BCIOSS≤2.54) or high BCIOSS group (BCIOSS>2.54) via ROC curve. BCIOSS was a latent prognostic factor for patient survival [DFS; hazard ratio (HR): 0.163, 95%CI: 0.045-0.596, P=0.006; and OS; HR: 0.168, 95%CI: 0.056-0.500, P=0.001]. Patients with a high BCIOSS had longer survival time than those with a low BCIOSS (DFS: χ2=7.317, P=0.0068; and OS: χ2=9.407, P=0.0022). Calibration curves shown that the predicted line conformed well to the reference line for the 5-year survival category. DCA revealed that the nomograms conducted had a better clinical predictive application than only by BCIOSS.
Conclusion: BCIOSS is a latent prognostic factor, and patients with high oxidative stress scores have a better prognosis and longer survival time.
Keywords: breast cancer, breast cancer integrated oxidative stress score, neoadjuvant chemotherapy, nomogram, survival
Introduction
Breast cancer is the most common type of malignant tumors in women [1]. Data from the International Agency for Research on Cancer (IARC) shows that the morbidity rate of breast cancer ranks second and the mortality rate ranks fourth in the world. Compared with other malignant tumors (hepatoma, carcinoma of the lungs, and pancreatic cancer), the prognosis and survival outcomes of breast cancer are relatively satisfactory. However, advanced and distant metastatic breast cancer has poor prognosis because of its occurrence and metastasis [2, 3]. Because of the strong heterogeneity of tumors, patients with equal immunohistochemical subtypes and tumor-node-metastasis (TNM) stages are significantly different [4, 5]. That is to say, although there are known risk factors, such as immunohistochemical subtype and TNM stage system, some subtle indicators still affect the prognosis of breast cancer patients.
Reactive oxygen species (ROS), a class of molecules with high biological activity, are supposed to be normal residual products of many cellular processes [6]. ROS play a crucial role in cell metabolism: 1) ROS, as a signal transducer, activate angiogenesis, cell proliferation, migration, and invasion at low to medium levels; 2) ROS destroy nucleic acids, proteins, membranes, and lipids, resulting in high levels of cell death [7]. ROS play a noteworthy role in the body's defense and killing of tumor cells in many malignant tumors [8, 9]. Oxidative stress is a state of linkage disequilibration between oxidants and antioxidants and is associated with the development, occurrence, and aggressiveness of tumors [10, 11]. Research has shown that high oxidative stress increases the risk of developing tumors due to impaired antioxidant systems; ROS in oxidative stress will lead to post-translational modification and genetic instability of cancer-involved proteins [12-14].
A large amount of studies declared that ROS played a critical role in tumor tissues. One study on critically ill polytrauma patients with multiple injuries shown significant statistical differences in interleukin 6, total protein, serum albumin, lactate dehydrogenase, and C-reactive protein (CRP) levels with antioxidant treatment compared with those without antioxidant treatment [15]. Another study indicated that inflammation and oxidative stress might play important roles in inducing multiorgan damage in a mouse model, and sleep-deprived mice had significantly higher levels of total bilirubin (TBIL), lactic dehydrogenase (LDH), blood urea nitrogen (BUN), creatine phosphokinase myocardial band (CKMB), and glutamic pyruvic transaminase (GPT) [16]. Another study also shown that they conducted a systematic oxidative stress scoring system to calculate the prognosis of colorectal carcinoma patients according to oxidative stress indexes [17]. These results suggested that biochemical markers might be effective indicators of systemic oxidative stress.
At present, assessment of systemic oxidative stress, antioxidants, and prognosis is crucial for the preventive and therapeutic effects on tumors, such as colorectal carcinoma and T lymphoblastic lymphoma/leukemia [17, 18]. However, the relation between systemic oxidative stress and the prognosis of breast cancer patients is still unclear. In the current study, we aim to explore the potential prognostic value of systemic oxidative stress in terms of biochemical markers of oxidative stress. We conduct an integrated oxidative stress score, named breast cancer integrated oxidative stress score (BCIOSS), and investigate the potential prognostic significance of BCIOSS in breast cancer patients who underwent NACT.
Materials and Methods
Patients and study design
A total of 104 female patients diagnosed breast cancer underwent NACT between June 2009 and December 2015 at our hospital were enrolled into this study. We searched and collected clinical data, pathological data, and follow-up data from electronic medical records. This study was approved by the ethics review committee of the Cancer Hospital, Chinese Academy of Medical Sciences. And this study was performed in compliance with the 1964 Declaration of Helsinki and its later amendments. The patients were selected and signed informed consent forms.
Inclusion criteria and exclusion criteria
The inclusion criteria were as follows: 1) diagnosis of breast cancer by histopathology; 2) all enrolled patients received surgical operation after NACT; 3) without anti-tumor therapy before enrollment in our hospital; 4) complete clinical pathology data and follow-up information; and 5) absence of hematological diseases, inflammation, or infection. Patients were excluded if they 1) had multiple primary malignant tumors; 2) lacked definite and clear diagnosis and treatment information; 3) had chronic inflammatory or autoimmune diseases; 4) had cardiovascular disease, kidney dysfunction, and metabolic diseases; and 5) received blood transfusion treatment.
Breast cancer integrated oxidative stress score (BCIOSS)
In the current study, the BCIOSS was composed of BUN, albumin (ALB), direct bilirubin (DBIL). BCIOSS was calculated as below: 0.074 × ALB (g/L) - 0.094 × DBIL (μmol/L) - 0.099 × BUN (mmol/L), referred to a previous study [17]. These blood indicators were detected on the first day after admission in patients with breast cancer.
Follow-up
Follow-up data were collected via routine outpatient, inpatient, telephonic interviews. The follow-up schedule was based on the NCCN guidelines. In the current study, disease free survival (DFS), which was calculated from the time from operation to distant disease progression and metastasis, local recurrence of the tumor. Overall survival (OS) was calculated as the time from operation to death or last follow-up.
Statistical analysis
SPSS statistics software (version 23.0), GraphPad Prism software (version 8.0), and R (version 4.2.2; URL: http://www.R-project.org/) were used for all statistical analyses. The optimal cutoff value for BCIOSS was calculated by ROC curve. The variables of breast cancer by BCIOSS were analyzed using Chi-square test and Fisher's exact test. The Kaplan-Meier method was used to evaluate survival curve between low BCIOSS group and high BCIOSS group, and the two groups were compared by Log-rank tests at the individual index level. The univariate Cox proportional hazard model was performed the enrolled variables, and the multivariate Cox regression analyses were established by the important predictive factors determined based on univariate analysis. The nomograms were further conducted based on the factors by the multivariate analyses. The accuracy of the predictive performance was assessed by comparing the observation results and prediction results using calibration curve and decision curve analysis (DCA). P<0.05 was supposed to indicate a statistically significant result.
Results
Study population and the characteristics
There were 104 breast cancer patients enrolled the study. The optimal BCIOSS cutoff value was determined to be 2.54. Then, the patients were separated into two groups: low BCIOSS group (BCIOSS≤2.54) and high BCIOSS group (BCIOSS>2.54). Compared to patient characteristics, BCIOSS was associated with ultrasonic sound-breast imaging reporting and data system (US-BI-RADS) (P=0.044) and mammography-lymph node metastasis (M-LNM) (P=0.015) (Table 1).
Patient characteristics
| Level | Low BCIOSS | High BCIOSS | p | |
|---|---|---|---|---|
| n | 52 | 52 | ||
| Age | <46 | 21 (40.4) | 27 (51.9) | 0.325 |
| ≥46 | 31 (59.6) | 25 (48.1) | ||
| BMI | <23.63 | 22 (42.3) | 27 (51.9) | 0.432 |
| ≥23.63 | 30 (57.7) | 25 (48.1) | ||
| Family history | No | 38 (73.1) | 42 (80.8) | 0.485 |
| Yes | 14 (26.9) | 10 (19.2) | ||
| Menarche age | <14 | 18 (34.6) | 21 (40.4) | 0.685 |
| ≥14 | 34 (65.4) | 31 (59.6) | ||
| Menopause | No | 29 (55.8) | 35 (67.3) | 0.314 |
| Yes | 23 (44.2) | 17 (32.7) | ||
| ABO blood type | A | 14 (26.9) | 14 (26.9) | 0.504 |
| B | 20 (38.5) | 14 (26.9) | ||
| O | 13 (25.0) | 15 (28.8) | ||
| AB | 5 (9.6) | 9 (17.3) | ||
| US-primary tumor site | Upper outer quadrant | 30 (57.7) | 40 (76.9) | 0.130 |
| Lower outer quadrant | 4 (7.7) | 4 (7.7) | ||
| Lower inner quadrant | 3 (5.8) | 0 (0.0) | ||
| Upper inner quadrant | 11 (21.2) | 7 (13.5) | ||
| Central | 4 (7.7) | 1 (1.9) | ||
| US-LNM | No | 37 (71.2) | 32 (61.5) | 0.406 |
| Yes | 15 (28.8) | 20 (38.5) | ||
| US-BIRADS | 4 | 7 (13.5) | 3 (5.8) | 0.044 |
| 5 | 15 (28.8) | 27 (51.9) | ||
| 6 | 30 (57.7) | 22 (42.3) | ||
| M-primary tumor site | Upper outer quadrant | 32 (61.5) | 33 (63.5) | 0.795 |
| Lower outer quadrant | 2 (3.8) | 4 (7.7) | ||
| Lower inner quadrant | 4 (7.7) | 2 (3.8) | ||
| Upper inner quadrant | 10 (19.2) | 7 (13.5) | ||
| Central | 1 (1.9) | 1 (1.9) | ||
| Unknown | 3 (5.8) | 5 (9.6) | ||
| M-LNM | No | 39 (75.0) | 26 (50.0) | 0.015 |
| Yes | 13 (25.0) | 26 (50.0) | ||
| M-BIRADS | 4 | 6 (11.5) | 6 (11.5) | 0.451 |
| 5 | 20 (38.5) | 13 (25.0) | ||
| 6 | 22 (42.3) | 26 (50.0) | ||
| Others | 4 (7.7) | 7 (13.5) | ||
| R-primary tumor site | Upper outer quadrant | 20 (38.5) | 32 (61.5) | 0.265 |
| Lower outer quadrant | 2 (3.8) | 1 (1.9) | ||
| Lower inner quadrant | 3 (5.8) | 1 (1.9) | ||
| Upper inner quadrant | 7 (13.5) | 4 (7.7) | ||
| Central | 3 (5.8) | 1 (1.9) | ||
| Unknown | 17 (32.7) | 13 (25.0) | ||
| R-LNM | No | 38 (73.1) | 29 (55.8) | 0.101 |
| Yes | 14 (26.9) | 23 (44.2) | ||
| R-BIRADS | 4 | 3 (5.8) | 0 (0.0) | 0.238 |
| 5 | 9 (17.3) | 11 (21.2) | ||
| 6 | 23 (44.2) | 28 (53.8) | ||
| Others | 17 (32.7) | 13 (25.0) | ||
| Clinical T stage | T1 | 8 (15.4) | 7 (13.5) | 0.946 |
| T2 | 29 (55.8) | 28 (53.8) | ||
| T3 | 6 (11.5) | 8 (15.4) | ||
| T4 | 9 (17.3) | 9 (17.3) | ||
| Clinical N stage | N0 | 11 (21.2) | 5 (9.6) | 0.240 |
| N1 | 15 (28.8) | 20 (38.5) | ||
| N2 | 20 (38.5) | 17 (32.7) | ||
| N3 | 6 (11.5) | 10 (19.2) | ||
| Clinical TNM stage | I | 2 (3.8) | 1 (1.9) | 0.663 |
| II | 21 (40.4) | 18 (34.6) | ||
| III | 29 (55.8) | 33 (63.5) | ||
| Type of surgery | Mastectomy | 48 (92.3) | 40 (76.9) | 0.057 |
| Breast-conserving surgery | 4 (7.7) | 12 (23.1) | ||
| P-tumor size | ≤2cm | 25 (48.1) | 20 (38.5) | 0.383 |
| >2 and <5cm | 25 (48.1) | 27 (51.9) | ||
| ≥5cm | 2 (3.8) | 5 (9.6) | ||
| Histologic grade | I | 2 (3.8) | 4 (7.7) | 0.458 |
| II | 31 (59.6) | 34 (65.4) | ||
| III | 19 (36.5) | 14 (26.9) | ||
| Pathological T stage | Tis/T0 | 4 (7.7) | 0 (0.0) | 0.196 |
| T1 | 21 (40.4) | 20 (38.5) | ||
| T2 | 24 (46.2) | 25 (48.1) | ||
| T3 | 1 (1.9) | 1 (1.9) | ||
| T4 | 2 (3.8) | 6 (11.5) | ||
| Pathological N stage | N0 | 19 (36.5) | 12 (23.1) | 0.489 |
| N1 | 12 (23.1) | 15 (28.8) | ||
| N2 | 8 (15.4) | 11 (21.2) | ||
| N3 | 13 (25.0) | 14 (26.9) | ||
| Pathological TNM stage | Tis/T0 | 2 (3.8) | 0 (0.0) | 0.171 |
| I | 11 (21.2) | 5 (9.6) | ||
| II | 17 (32.7) | 21 (40.4) | ||
| III | 22 (42.3) | 26 (50.0) | ||
| Total lymph node | <24 | 25 (48.1) | 28 (53.8) | 0.695 |
| ≥24 | 27 (51.9) | 24 (46.2) | ||
| Positive lymph node | <2 | 24 (46.2) | 19 (36.5) | 0.426 |
| ≥2 | 28 (53.8) | 33 (63.5) | ||
| Lymph vessel invasion | Negative | 28 (53.8) | 34 (65.4) | 0.318 |
| Positive | 24 (46.2) | 18 (34.6) | ||
| Neural invasion | Negative | 40 (76.9) | 41 (78.8) | 1.000 |
| Positive | 12 (23.1) | 11 (21.2) | ||
| Postoperative complications | No | 47 (90.4) | 51 (98.1) | 0.207 |
| Yes | 5 (9.6) | 1 (1.9) | ||
| Postoperative chemotherapy | No | 18 (34.6) | 12 (23.1) | 0.279 |
| Yes | 34 (65.4) | 40 (76.9) | ||
| Postoperative radiotherapy | No | 15 (28.8) | 10 (19.2) | 0.359 |
| Yes | 37 (71.2) | 42 (80.8) | ||
| Postoperative endocrine therapy | No | 21 (40.4) | 23 (44.2) | 0.843 |
| Yes | 31 (59.6) | 29 (55.8) | ||
| Postoperative targeted therapy | No | 34 (65.4) | 38 (73.1) | 0.524 |
| Yes | 18 (34.6) | 14 (26.9) |
#Abbreviations: BMI, Body mass index; US, Ultrasonic sound; LNM, Lymph node metastasis; TNM; Tumor node metastasis; M, Mammography; BIRADS, Breast Imaging Reporting and Data System.
The common hematologic index and oxidative stress indicators
We used the median values for these hematologic indices and oxidative stress indicators as the cut-off values. Table 2 shown the distribution of common hematologic indices and systematic oxidative stress indices in the patients. Based on the hematologic index, BCIOSS was significantly related to homocysteine (HCY), red blood cells (R), and eosinophils (E) (P<0.05). Of all enrolled oxidative stress indicators, BCIOSS was found to be significantly related to albumin and direct bilirubin (P < 0.05).
Common hematologic index and oxidative stress indicators
| Level | Low BCIOSS | High BCIOSS | p | |
|---|---|---|---|---|
| n | 52 | 52 | ||
| ALT | <17 | 23 (44.2) | 29 (55.8) | 0.327 |
| ≥17 | 29 (55.8) | 23 (44.2) | ||
| AST | <17 | 24 (46.2) | 22 (42.3) | 0.843 |
| ≥17 | 28 (53.8) | 30 (57.7) | ||
| LDH | <166 | 26 (50.0) | 26 (50.0) | 1.000 |
| ≥166 | 26 (50.0) | 26 (50.0) | ||
| GGT | <17 | 24 (46.2) | 24 (46.2) | 1.000 |
| ≥17 | 28 (53.8) | 28 (53.8) | ||
| ALP | <65 | 24 (46.2) | 25 (48.1) | 1.000 |
| ≥65 | 28 (53.8) | 27 (51.9) | ||
| ALB | <45.0 | 41 (78.8) | 12 (23.1) | <0.001 |
| ≥45.0 | 11 (21.2) | 40 (76.9) | ||
| CRP | <0.35 | 21 (40.4) | 30 (57.7) | 0.117 |
| ≥0.35 | 31 (59.6) | 22 (42.3) | ||
| BUN | <4.3 | 21 (40.4) | 30 (57.7) | 0.117 |
| ≥4.3 | 31 (59.6) | 22 (42.3) | ||
| CRE | <56.60 | 26 (50.0) | 27 (51.9) | 1.000 |
| ≥56.60 | 26 (50.0) | 25 (48.1) | ||
| URIC | <253 | 21 (40.4) | 29 (55.8) | 0.169 |
| ≥253 | 31 (59.6) | 23 (44.2) | ||
| TBA | <2.5 | 26 (50.0) | 24 (46.2) | 0.844 |
| ≥2.5 | 26 (50.0) | 28 (53.8) | ||
| TBIL | <8.81 | 21 (40.4) | 32 (61.5) | 0.050 |
| ≥8.81 | 31 (59.6) | 20 (38.5) | ||
| DBIL | <3 | 18 (34.6) | 33 (63.5) | 0.006 |
| ≥3 | 34 (65.4) | 19 (36.5) | ||
| IBIL | <5.9 | 21 (40.4) | 32 (61.5) | 0.050 |
| ≥5.9 | 31 (59.6) | 20 (38.5) | ||
| TP | <70.6 | 30 (57.7) | 21 (40.4) | 0.117 |
| ≥70.6 | 22 (42.3) | 31 (59.6) | ||
| G | <25.80 | 27 (51.9) | 24 (46.2) | 0.695 |
| ≥25.80 | 25 (48.1) | 28 (53.8) | ||
| A/G | <1.72 | 28 (53.8) | 19 (36.5) | 0.115 |
| ≥1.72 | 24 (46.2) | 33 (63.5) | ||
| Lpa | <22.50 | 27 (51.9) | 25 (48.1) | 0.845 |
| ≥22.50 | 25 (48.1) | 27 (51.9) | ||
| SOD | <164.10 | 31 (59.6) | 21 (40.4) | 0.078 |
| ≥164.10 | 21 (40.4) | 31 (59.6) | ||
| HCY | <10.80 | 19 (36.5) | 30 (57.7) | 0.049 |
| ≥10.80 | 33 (63.5) | 22 (42.3) | ||
| PALB | <23.80 | 28 (53.8) | 22 (42.3) | 0.326 |
| ≥23.80 | 24 (46.2) | 30 (57.7) | ||
| CA125 | <14.85 | 29 (55.8) | 24 (46.2) | 0.433 |
| ≥14.85 | 23 (44.2) | 28 (53.8) | ||
| CA153 | <12.70 | 27 (51.9) | 26 (50.0) | 1.000 |
| ≥12.70 | 25 (48.1) | 26 (50.0) | ||
| CEA | <1.81 | 23 (44.2) | 30 (57.7) | 0.239 |
| ≥1.81 | 29 (55.8) | 22 (42.3) | ||
| DD | <0.30 | 26 (50.0) | 19 (36.5) | 0.235 |
| ≥0.30 | 26 (50.0) | 33 (63.5) | ||
| FIB | <2.87 | 29 (55.8) | 24 (46.2) | 0.433 |
| ≥2.87 | 23 (44.2) | 28 (53.8) | ||
| INR | <0.93 | 20 (38.5) | 27 (51.9) | 0.237 |
| ≥0.93 | 32 (61.5) | 25 (48.1) | ||
| FDP | <1.50 | 19 (36.5) | 28 (53.8) | 0.115 |
| ≥1.50 | 33 (63.5) | 24 (46.2) | ||
| W | <5.92 | 29 (55.8) | 22 (42.3) | 0.239 |
| ≥5.92 | 23 (44.2) | 30 (57.7) | ||
| R | <4.36 | 34 (65.4) | 17 (32.7) | 0.002 |
| ≥4.36 | 18 (34.6) | 35 (67.3) | ||
| Hb | <130 | 30 (57.7) | 20 (38.5) | 0.077 |
| ≥130 | 22 (42.3) | 32 (61.5) | ||
| N | <3.66 | 29 (55.8) | 22 (42.3) | 0.239 |
| ≥3.66 | 23 (44.2) | 30 (57.7) | ||
| L | <1.75 | 23 (44.2) | 28 (53.8) | 0.433 |
| ≥1.75 | 29 (55.8) | 24 (46.2) | ||
| M | <0.37 | 27 (51.9) | 23 (44.2) | 0.556 |
| ≥0.37 | 25 (48.1) | 29 (55.8) | ||
| E | <0.06 | 17 (32.7) | 28 (53.8) | 0.048 |
| ≥0.06 | 35 (67.3) | 24 (46.2) | ||
| B | <0.02 | 12 (23.1) | 14 (26.9) | 0.821 |
| ≥0.02 | 40 (76.9) | 38 (73.1) | ||
| P | <234 | 28 (53.8) | 22 (42.3) | 0.326 |
| ≥234 | 24 (46.2) | 30 (57.7) |
#Abbreviations: ALT, Alanine aminotransferase; AST, Aspartate aminotransferase; LDH, Lactate dehydrogenase; GGT, γ-glutamyl transpeptidase; ALP, Alkaline phosphatase; ALB, Albumin; CRP, C-reactive protein; BUN, Blood urea nitrogen; CRE, Creatinine; URIC, Uric acid; TBA, Total bile acids; TBIL, Total bilirubin; DBIL, Direct bilirubin; IBIL, Indirect bilirubin; TP, Total protein; G, Globularproteins; A/G, Albumin/Globularproteins; Lpa, Lipoprotein; SOD, Superoxide dismutase; HCY, Homocysteine; PALB, Prealbumin; CA125, Cancer antigen 125; CA153, Cancer antigen 153; CEA, Carcinoembryonic antigen; DD, D-Dimer; FIB, Fibrinogen; INR, international normalized ratio; FDP, Fibrinogen degradation products; W, White blood cell; R, Red blood cell; Hb, Hemoglobin; N, Neutrophils; L, Lymphocyte; M, Monocyte; E, eosinophil; B, Basophil; P, Platelet.
Association between BCIOSS and chemotherapy
In this study, there were 74 cases received postoperative chemotherapy after NACT and surgery. After two cycles of NACT, we evaluated the response to breast cancer, and all patients who received NACT were effectively relieved, except for one patient who had progressive disease. The toxic side effects of chemotherapy, including NACT and postoperative chemotherapy, were mainly gastrointestinal and hematologic reactions. After receiving chemotherapy when received surgery, there was no statistically significant difference between the two groups (P > 0.05, Table 3).
Association between BCIOSS and chemotherapy
| Level | Low BCIOSS | High BCIOSS | p | |
|---|---|---|---|---|
| n | 52 | 52 | ||
| Neoadjuvant chemotherapy regimen | AC/ACF | 3 (5.8) | 1 (1.9) | 0.636 |
| CT/ACT | 4 (7.7) | 6 (11.5) | ||
| AT | 24 (46.2) | 29 (55.8) | ||
| TP | 12 (23.1) | 9 (17.3) | ||
| Others | 9 (17.3) | 7 (13.5) | ||
| Neoadjuvant chemotherapy times | <6 | 18 (34.6) | 16 (30.8) | 0.834 |
| ≥6 | 34 (65.4) | 36 (69.2) | ||
| Response | PR | 29 (55.8) | 31 (59.6) | 0.580 |
| SD | 22 (42.3) | 21 (40.4) | ||
| PD | 1 (1.9) | 0 (0.0) | ||
| Decreased appetite | No | 9 (17.3) | 8 (15.4) | 1.000 |
| Yes | 43 (82.7) | 44 (84.6) | ||
| Nausea | No | 5 (9.6) | 6 (11.5) | 1.000 |
| Yes | 47 (90.4) | 46 (88.5) | ||
| Vomiting | No | 28 (53.8) | 22 (42.3) | 0.326 |
| Yes | 24 (46.2) | 30 (57.7) | ||
| Diarrhea | No | 49 (94.2) | 48 (92.3) | 1.000 |
| Yes | 3 (5.8) | 4 (7.7) | ||
| Mouth ulcers | No | 52 (100.0) | 50 (96.2) | 0.475 |
| Yes | 0 (0.0) | 2 (3.8) | ||
| Alopecia | No | 27 (51.9) | 21 (40.4) | 0.325 |
| Yes | 25 (48.1) | 31 (59.6) | ||
| Peripheral neurotoxicity | No | 45 (86.5) | 42 (80.8) | 0.596 |
| Yes | 7 (13.5) | 10 (19.2) | ||
| Anemia | Grade 0 | 26 (50.0) | 29 (55.8) | 0.694 |
| Grade 1-2 | 26 (50.0) | 23 (44.2) | ||
| Leukopenia | Grade 0 | 12 (23.1) | 12 (23.1) | 0.483 |
| Grade 1-2 | 25 (48.1) | 30 (57.7) | ||
| Grade 3-4 | 15 (28.8) | 10 (19.2) | ||
| Neutropenia | Grade 0 | 9 (17.3) | 11 (21.2) | 0.801 |
| Grade 1-2 | 22 (42.3) | 19 (36.5) | ||
| Grade 3-4 | 21 (40.4) | 22 (42.3) | ||
| Thrombocytopenia | Grade 0 | 37 (71.2) | 42 (80.8) | 0.359 |
| Grade 1-2 | 15 (28.8) | 10 (19.2) | ||
| Gastrointestinal reaction | Grade 0 | 6 (11.5) | 6 (11.5) | 0.603 |
| Grade 1-2 | 45 (86.5) | 46 (88.5) | ||
| Grade 3-4 | 1 (1.9) | 0 (0.0) | ||
| Myelosuppression | Grade 0 | 7 (13.5) | 8 (15.4) | 0.919 |
| Grade 1-2 | 15 (28.8) | 16 (30.8) | ||
| Grade 3-4 | 30 (57.7) | 28 (53.8) | ||
| Hepatic dysfunction | Grade 0 | 33 (63.5) | 33 (63.5) | 1.000 |
| Grade 1-2 | 19 (36.5) | 19 (36.5) | ||
| Miller-Payne grade | 1 | 3 (5.8) | 6 (11.5) | 0.082 |
| 2 | 17 (32.7) | 25 (48.1) | ||
| 3 | 27 (51.9) | 21 (40.4) | ||
| 4 | 1 (1.9) | 0 (0.0) | ||
| 5 | 4 (7.7) | 0 (0.0) | ||
| Postoperative chemotherapy | No | 18 (34.6) | 12 (23.1) | 0.279 |
| Yes | 34 (65.4) | 40 (76.9) | ||
| Postoperative chemotherapy regimen | AC/ACF | 4 (7.7) | 5 (9.6) | 0.715 |
| CT/ACT | 2 (3.8) | 4 (7.7) | ||
| AT | 5 (9.6) | 4 (7.7) | ||
| TP | 9 (17.3) | 8 (15.4) | ||
| Others | 14 (26.9) | 19 (36.5) | ||
| No | 18 (34.6) | 12 (23.1) | ||
| Postoperative chemotherapy times | <4 | 26 (50.0) | 22 (42.3) | 0.555 |
| ≥4 | 26 (50.0) | 30 (57.7) | ||
| Postoperative gastrointestinal reaction | Grade 0 | 24 (46.2) | 17 (32.7) | 0.107 |
| Grade 1-2 | 28 (53.8) | 32 (61.5) | ||
| Grade 3-4 | 0 (0.0) | 3 (5.8) | ||
| Postoperative myelosuppression | Grade 0 | 24 (46.2) | 19 (36.5) | 0.466 |
| Grade 1-2 | 17 (32.7) | 23 (44.2) | ||
| Grade 3-4 | 11 (21.2) | 10 (19.2) | ||
| Postoperative hepatic dysfunction | Grade 0 | 33 (63.5) | 33 (63.5) | 1.000 |
| Grade 1-2 | 19 (36.5) | 19 (36.5) |
#Abbreviations: A, Anthracyclines; C, Cyclophosphamide; F, 5-Fluorouracil; T, Taxol; P, Platinum compounds.
The relationship between BCIOSS and molecular pathology
Immunohistochemistry was performed to detect pathological molecular indicators, such as androgen receptor (AR), epidermal growth factor receptor (EGFR), E-cadherin (E-cad), and Topoisomerase II-α (TOP2A). There were no differences in molecular pathology between the two groups (P > 0.05, Table 4).
The relationship between BCIOSS and molecular pathology
| Level | Low BCIOSS | High BCIOSS | p | |
|---|---|---|---|---|
| n | 52 | 52 | ||
| Core needle biopsy | ||||
| Molecular subtype | Luminal A | 5 (9.6) | 3 (5.8) | 0.651 |
| Luminal B HER2+ | 5 (9.6) | 9 (17.3) | ||
| Luminal B HER2- | 16 (30.8) | 19 (36.5) | ||
| HER2 enriched | 8 (15.4) | 7 (13.5) | ||
| Triple negative | 18 (34.6) | 14 (26.9) | ||
| ER | Negative | 22 (42.3) | 21 (40.4) | 1.000 |
| Positive | 30 (57.7) | 31 (59.6) | ||
| PR | Negative | 22 (42.3) | 20 (38.5) | 0.842 |
| Positive | 30 (57.7) | 32 (61.5) | ||
| HER2 | Negative | 39 (75.0) | 37 (71.2) | 0.825 |
| Positive | 13 (25.0) | 15 (28.8) | ||
| Ki-67 | Negative | 9 (17.3) | 11 (21.2) | 0.804 |
| Positive | 43 (82.7) | 41 (78.8) | ||
| Pathology after surgery | ||||
| Molecular subtype | Luminal A | 7 (13.5) | 10 (19.2) | 0.619 |
| Luminal B HER2+ | 3 (5.8) | 6 (11.5) | ||
| Luminal B HER2- | 14 (26.9) | 9 (17.3) | ||
| HER2 enriched | 9 (17.3) | 9 (17.3) | ||
| Triple negative | 19 (36.5) | 18 (34.6) | ||
| ER | Negative | 26 (50.0) | 22 (42.3) | 0.555 |
| Positive | 26 (50.0) | 30 (57.7) | ||
| PR | Negative | 25 (48.1) | 25 (48.1) | 1.000 |
| Positive | 27 (51.9) | 27 (51.9) | ||
| HER2 | Negative | 40 (76.9) | 40 (76.9) | 1.000 |
| Positive | 12 (23.1) | 12 (23.1) | ||
| Ki-67 | Negative | 16 (30.8) | 20 (38.5) | 0.536 |
| Positive | 36 (69.2) | 32 (61.5) | ||
| AR | Negative | 46 (88.5) | 45 (86.5) | 1.000 |
| Positive | 6 (11.5) | 7 (13.5) | ||
| CK5/6 | Negative | 37 (71.2) | 38 (73.1) | 1.000 |
| Positive | 15 (28.8) | 14 (26.9) | ||
| E-cad | Negative | 15 (28.8) | 9 (17.3) | 0.245 |
| Positive | 37 (71.2) | 43 (82.7) | ||
| EGFR | Negative | 30 (57.7) | 27 (51.9) | 0.694 |
| Positive | 22 (42.3) | 25 (48.1) | ||
| P53 | Negative | 22 (42.3) | 22 (42.3) | 1.000 |
| Positive | 30 (57.7) | 30 (57.7) | ||
| TOP2A | Negative | 13 (25.0) | 10 (19.2) | 0.637 |
| Positive | 39 (75.0) | 42 (80.8) |
#Abbreviations: ER: Estrogen receptor, PR: Progesterone receptor; HER2: Human Epidermal Growth Factor Receptor 2; AR: Androgen receptor; E-cad: E-Cadherin; EGFR: Epidermal growth factor receptor; TOP2A: Topoisomerase II-α.
The univariate and multivariate analyses for DFS and OS
The multivariate Cox regression analysis was applied to determine potential factors that were indicated to be significant in univariate regression analysis. BCIOSS, total bile acid (TBA), carcinoembryonic antigen 153 (CA153), ultrasonic sound-lymph node metastasis (US-LNM), pathological tumor size (P-tumor size), postoperative endocrine therapy were potential prognostic factors for DFS. Furthermore, BCIOSS and postoperative endocrine therapy were potential prognostic factors for OS. Detailed information was presented in Table 5.
Univariate and multivariate Cox proportional hazards regression model analysis of the potential factors associated with disease free survival (DFS) and overall survival (OS)
| DFS | OS | |||||||||||
|---|---|---|---|---|---|---|---|---|---|---|---|---|
| Univariate | Multivariate | Univariate | Multivariate | |||||||||
| Characteristics | HR | 95%CI | P | HR | 95%CI | P | HR | 95%CI | P | HR | 95%CI | P |
| BCIOSS (low vs. High) | 0.326 | 0.138-0.767 | 0.010 | 0.163 | 0.045-0.596 | 0.006 | 0.284 | 0.121-0.670 | 0.004 | 0.168 | 0.056-0.500 | 0.001 |
| Age (<46 vs. ≥46) | 1.725 | 0.778-3.821 | 0.179 | 1.822 | 0.824-4.032 | 0.139 | ||||||
| BMI (<23.63 vs. ≥23.63) | 1.203 | 0.569-2.544 | 0.629 | 1.256 | 0.594-2.656 | 0.550 | ||||||
| Family history (No vs. Yes) | 0.960 | 0.408-2.260 | 0.926 | 1.057 | 0.449-2.486 | 0.900 | ||||||
| Menopause (No vs. Yes) | 0.892 | 0.416-1.911 | 0.768 | 0.934 | 0.437-1.996 | 0.860 | ||||||
| ALT (<17 vs. ≥17) | 1.770 | 0.816-3.838 | 0.148 | 2.005 | 0.925-4.347 | 0.078 | ||||||
| AST (<17 vs. ≥17) | 1.972 | 0.868-4.479 | 0.105 | 2.114 | 0.928-4.815 | 0.075 | ||||||
| LDH (<166 vs. ≥166) | 1.517 | 0.717-3.208 | 0.276 | 1.416 | 0.670-2.994 | 0.363 | ||||||
| GGT (<17 vs. ≥17) | 1.717 | 0.776-3.798 | 0.182 | 1.952 | 0.881-4.323 | 0.099 | ||||||
| ALP (<65 vs. ≥65) | 2.738 | 1.163-6.446 | 0.021 | 0.580 | 0.150-2.240 | 0.430 | 2.763 | 1.174-6.502 | 0.020 | 1.049 | 0.321-3.433 | 0.937 |
| ALB (<45.0 vs. ≥45.0) | 0.960 | 0.457-2.020 | 0.915 | 0.927 | 0.441-1.948 | 0.841 | ||||||
| CRP (<0.35 vs. ≥0.35) | 0.927 | 0.441-1.949 | 0.841 | 0.850 | 0.403-1.793 | 0.670 | ||||||
| BUN (<4.3 vs. ≥4.3) | 1.606 | 0.741-3.480 | 0.230 | 1.771 | 0.817-3.841 | 0.148 | ||||||
| CRE (<56.60 vs. ≥56.60) | 0.945 | 0.450-1.985 | 0.881 | 1.029 | 0.490-2.159 | 0.940 | ||||||
| URIC (<253 vs. ≥253) | 0.968 | 0.460-2.037 | 0.931 | 1.050 | 0.498-2.213 | 0.898 | ||||||
| TBA (<2.5 vs. ≥2.5) | 2.735 | 1.230-6.083 | 0.014 | 5.607 | 1.783-17.635 | 0.003 | 2.538 | 1.143-5.636 | 0.022 | 2.861 | 0.927-8.828 | 0.067 |
| TBIL (<8.81 vs. ≥8.81) | 0.567 | 0.262-1.230 | 0.151 | 0.551 | 0.253-1.198 | 0.132 | ||||||
| DBIL (<3 vs. ≥3) | 0.874 | 0.414-1.846 | 0.725 | 0.909 | 0.430-1.922 | 0.803 | ||||||
| IBIL (<5.9 vs. ≥5.9) | 0.545 | 0.251-1.183 | 0.125 | 0.550 | 0.253-1.196 | 0.131 | ||||||
| TP (<70.6 vs. ≥70.6) | 1.933 | 0.892-4.190 | 0.095 | 1.870 | 0.862-4.058 | 0.113 | ||||||
| G (<25.80 vs. ≥25.80) | 1.747 | 0.817-3.734 | 0.150 | 1.550 | 0.722-3.327 | 0.261 | ||||||
| A/G (<1.72 vs. ≥1.72) | 0.360 | 0.166-0.782 | 0.010 | 0.977 | 0.264-3.608 | 0.972 | 0.406 | 0.187-0.884 | 0.023 | 0.881 | 0.273-2.842 | 0.832 |
| Lpa (<22.50 vs. ≥22.50) | 1.274 | 0.606-2.680 | 0.523 | 0.964 | 0.459-2.024 | 0.923 | ||||||
| SOD (<164.10 vs. ≥164.10) | 0.263 | 0.112-0.620 | 0.002 | 1.573 | 0.402-6.161 | 0.515 | 0.285 | 0.121-0.673 | 0.004 | 1.033 | 0.318-3.352 | 0.957 |
| HCY (<164.10 vs. ≥164.10) | 0.982 | 0.467-2.065 | 0.962 | 1.001 | 0.476-2.109 | 0.997 | ||||||
| PALB (<23.80 vs. ≥23.80) | 2.199 | 0.993-4.871 | 0.052 | 2.031 | 0.919-4.492 | 0.080 | ||||||
| CA125 (<14.85 vs. ≥14.85) | 0.847 | 0.400-1.794 | 0.665 | 0.760 | 0.359-1.609 | 0.474 | ||||||
| CA153 (<12.70 vs. ≥12.70) | 2.772 | 1.220-6.301 | 0.015 | 5.149 | 1.442-18.381 | 0.012 | 2.975 | 1.300-6.808 | 0.010 | 1.829 | 0.566-5.909 | 0.313 |
| CEA (<1.81 vs. ≥1.81) | 2.596 | 1.143-5.897 | 0.023 | 0.990 | 0.312-3.145 | 0.986 | 3.022 | 1.329-6.870 | 0.008 | 1.937 | 0.673-5.578 | 0.221 |
| ABO blood type (A+B+O vs. AB) | 1.089 | 0.758-1.566 | 0.643 | 1.084 | 0.749-1.570 | 0.667 | ||||||
| W (<5.92 vs. ≥5.92) | 0.627 | 0.296-1.328 | 0.223 | 0.700 | 0.329-1.490 | 0.355 | ||||||
| R (<4.36 vs. ≥4.36) | 0.614 | 0.288-1.312 | 0.208 | 0.536 | 0.250-1.147 | 0.108 | ||||||
| Hb (<130 vs. ≥130) | 0.817 | 0.389-1.717 | 0.594 | 0.785 | 0.372-1.657 | 0.526 | ||||||
| N (<3.66 vs. ≥3.66) | 0.608 | 0.287-1.289 | 0.195 | 0.677 | 0.318-1.440 | 0.311 | ||||||
| L (<1.75 vs. ≥1.75) | 0.814 | 0.387-1.714 | 0.588 | 0.863 | 0.409-1.821 | 0.700 | ||||||
| M (<0.37 vs. ≥0.37) | 1.149 | 0.547-2.416 | 0.714 | 0.978 | 0.466-2.053 | 0.952 | ||||||
| E (<0.06 vs. ≥0.06) | 2.507 | 1.065-5.903 | 0.035 | 1.836 | 0.631-5.342 | 0.265 | 2.352 | 0.999-5.537 | 0.050 | |||
| B (<0.02 vs. ≥0.02) | 0.830 | 0.365-1.887 | 0.657 | 0.800 | 0.352-1.820 | 0.594 | ||||||
| P (<234 vs. ≥234) | 1.603 | 0.749-3.429 | 0.224 | 1.561 | 0.731-3.334 | 0.250 | ||||||
| Primary tumor site (Upper outer quadrant vs. Others) | 0.813 | 0.591-1.118 | 0.202 | 0.835 | 0.607-1.150 | 0.270 | ||||||
| US-LNM (No vs. Yes) | 2.777 | 1.314-5.866 | 0.007 | 3.625 | 1.079-12.173 | 0.037 | 2.577 | 1.207-5.500 | 0.014 | 1.878 | 0.641-5.506 | 0.251 |
| US-BIRADS (4+5 vs. 6) | 1.572 | 0.842-2.933 | 0.155 | 1.680 | 0.882-3.199 | 0.114 | ||||||
| Clinical T stage (T1 vs. T2+ T3+T4) | 1.594 | 1.098-2.313 | 0.014 | 1.387 | 0.693-2.779 | 0.356 | 1.591 | 1.090-2.321 | 0.016 | 1.376 | 0.698-2.710 | 0.356 |
| Clinical N stage (N0 vs. N1+N2+N3) | 1.317 | 0.876-1.981 | 0.186 | 1.232 | 0.827-1.835 | 0.305 | ||||||
| Clinical TNM stage (I vs. II+III) | 1.676 | 0.810-3.465 | 0.164 | 1.486 | 0.726-3.040 | 0.279 | ||||||
| Type of surgery (Mastectomy vs. Breast-conserving surgery) | 0.386 | 0.092-1.626 | 0.194 | 0.359 | 0.085-1.515 | 0.163 | ||||||
| Pathological tumor size (≤2cm vs. >2cm) | 2.237 | 1.194-4.193 | 0.012 | 2.752 | 1.008-7.509 | 0.048 | 2.147 | 1.131-4.076 | 0.020 | 1.585 | 0.622-4.042 | 0.335 |
| Miller-Payne grade (MPG) (1+2+3 vs. 4+5) | 1.079 | 0.682-1.709 | 0.744 | 1.134 | 0.710-1.809 | 0.599 | ||||||
| Histologic.grade (I vs. II+III) | 1.782 | 0.900-3.528 | 0.097 | 1.474 | 0.749-2.901 | 0.262 | ||||||
| Pathological T stage (T1 vs. T2+ T3+T4) | 1.611 | 1.122-2.312 | 0.010 | 0.557 | 0.250-1.242 | 0.153 | 1.777 | 1.204-2.622 | 0.004 | 1.380 | 0.714-2.667 | 0.338 |
| Pathological N stage (N0 vs. N1+N2+N3) | 1.275 | 0.915-1.776 | 0.151 | 1.275 | 0.920-1.767 | 0.144 | ||||||
| Pathological TNM stage (Tis/T0+I vs. II+III) | 1.487 | 0.887-2.495 | 0.132 | 1.518 | 0.881-2.618 | 0.133 | ||||||
| TLN (<24 vs. ≥24) | 0.600 | 0.276-1.300 | 0.195 | 0.532 | 0.245-1.153 | 0.110 | ||||||
| PLN (<2 vs. ≥2) | 1.111 | 0.520-2.375 | 0.786 | 1.226 | 0.573-2.624 | 0.600 | ||||||
| Molecular subtype (Luminal A+Luminal B HER2+/ HER2- vs. HER2 enriched + Triple negative) | 1.246 | 0.946-1.640 | 0.118 | 1.175 | 0.900-1.535 | 0.235 | ||||||
| ER (Negative vs. Positive) | 0.837 | 0.398-1.762 | 0.640 | 0.977 | 0.464-2.058 | 0.952 | ||||||
| PR (Negative vs. Positive) | 0.914 | 0.434-1.925 | 0.813 | 1.106 | 0.525-2.328 | 0.791 | ||||||
| HER2 (Negative vs. Positive) | 1.218 | 0.514-2.886 | 0.655 | 1.270 | 0.539-2.995 | 0.585 | ||||||
| Ki-67 (Negative vs. Positive) | 2.395 | 0.970-5.914 | 0.058 | 2.094 | 0.849-5.167 | 0.109 | ||||||
| AR (Negative vs. Positive) | 1.164 | 0.403-3.361 | 0.778 | 1.192 | 0.412-3.453 | 0.746 | ||||||
| CK5/6 (Negative vs. Positive) | 1.306 | 0.574-2.968 | 0.524 | 1.007 | 0.443-2.292 | 0.986 | ||||||
| E-cad (Negative vs. Positive) | 1.234 | 0.519-2.931 | 0.634 | 1.029 | 0.434-2.441 | 0.948 | ||||||
| EGFR (Negative vs. Positive) | 1.317 | 0.626-2.770 | 0.469 | 1.095 | 0.521-2.302 | 0.811 | ||||||
| P53 (Negative vs. Positive) | 1.605 | 0.739-3.486 | 0.231 | 1.564 | 0.721-3.393 | 0.257 | ||||||
| TOP2A (Negative vs. Positive) | 0.647 | 0.293-1.432 | 0.283 | 0.618 | 0.279-1.368 | 0.235 | ||||||
| Lymph vessel invasion (No vs. Yes) | 1.947 | 0.924-4.105 | 0.080 | 2.050 | 0.974-4.315 | 0.059 | ||||||
| Neural invasion (No vs. Yes) | 2.232 | 1.028-4.848 | 0.042 | 3.054 | 0.801-11.640 | 0.102 | 2.170 | 1.000-4.706 | 0.050 | |||
| Postoperative chemotherapy (No vs. Yes) | 0.963 | 0.409-2.268 | 0.930 | 1.073 | 0.453-2.539 | 0.873 | ||||||
| Postoperative radiotherapy (No vs. Yes) | 0.382 | 0.179-0.817 | 0.013 | 1.265 | 0.429-3.732 | 0.670 | 0.449 | 0.210-0.958 | 0.038 | 1.193 | 0.397-3.582 | 0.753 |
| Postoperative endocrine therapy (No vs. Yes) | 0.375 | 0.177-0.795 | 0.011 | 0.166 | 0.051-0.543 | 0.003 | 0.442 | 0.209-0.935 | 0.033 | 0.226 | 0.074-0.695 | 0.009 |
| Postoperative targeted therapy (No vs. Yes) | 2.374 | 1.117-5.045 | 0.025 | 1.776 | 0.560-5.638 | 0.330 | 2.388 | 1.132-5.036 | 0.022 | 2.440 | 0.809-7.360 | 0.113 |
#Abbreviations: BMI, Body mass index; US, Ultrasonic sound; TNM; Tumor node metastasis; BIRADS, Breast Imaging Reporting and Data System; ALT, Alanine aminotransferase; AST, Aspartate aminotransferase; LDH, Lactate dehydrogenase; GGT, γ-glutamyl transpeptidase; ALP, Alkaline phosphatase; ALB, Albumin; CRP, C-reactive protein; BUN, Blood urea nitrogen; CRE, Creatinine; URIC, Uric acid; TBA, Total bile acids; TBIL, Total bilirubin; DBIL, Direct bilirubin; IBIL, Indirect bilirubin; TP, Total protein; G, Globularproteins; A/G, Albumin/Globularproteins; Lpa, Lipoprotein; SOD, Superoxide dismutase; HCY, Homocysteine; PALB, Prealbumin; CA125, Cancer antigen 125; CA153, Cancer antigen 153; CEA, Carcinoembryonic antigen; DD, D-Dimer; FIB, Fibrinogen; INR, international normalized ratio; FDP, Fibrinogen degradation products; W, White blood cell; R, Red blood cell; Hb, Hemoglobin; N, Neutrophils; L, Lymphocyte; M, Monocyte; E, eosinophil; B, Basophil; P, Platelet; MPG: Miller-Payne grade; TLN: Total lymph node; PLN: Positive lymph node; ER: Estrogen receptor, PR: Progesterone receptor; HER2: Human Epidermal Growth Factor Receptor 2; AR: Androgen receptor; E-cad: E-Cadherin; EGFR: Epidermal growth factor receptor; TOP2A: Topoisomerase II-α.
Survival analysis by BCIOSS
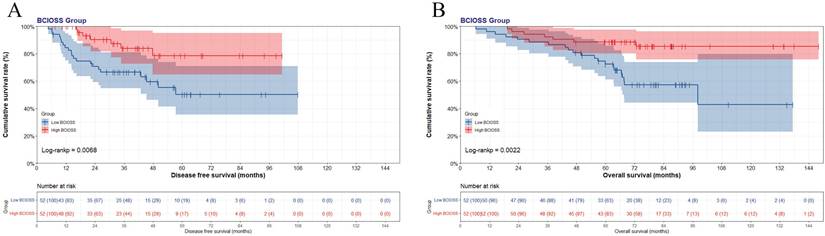
In view of the optimal BCIOSS cut-off value, the mean DFS time was 37.82 months in low BCIOSS group, and 38.59 months in high BCIOSS group. The mean OS time was 66.38 months in low BCIOSS group, and 76.66 months in high BCIOSS group. Patients with high BCIOSS had longer survival time than those with low BCIOSS (χ2=7.317, P=0.0068 and χ2=9.407, P=0.0022) (Figure 1). Moreover, the 1-, 3-, and 5-year survival rates for DFS and OS in low BCIOSS group were 89.4%, 72.2%, 54.5%; and 95.8%, 87.5%, 78.6%, respectively. Furthermore, the 1-, 3-, and 5-year survival rates for DFS and OS in high BCIOSS group were 94.4%, 77.5%, 72.7%; and 100.0%, 92.9%, 82.1%, respectively.
Kaplan-Meier curve of BCIOSS divided group: (A) disease free survival (DFS) and (B) overall survival (OS).
Nomograms constructed
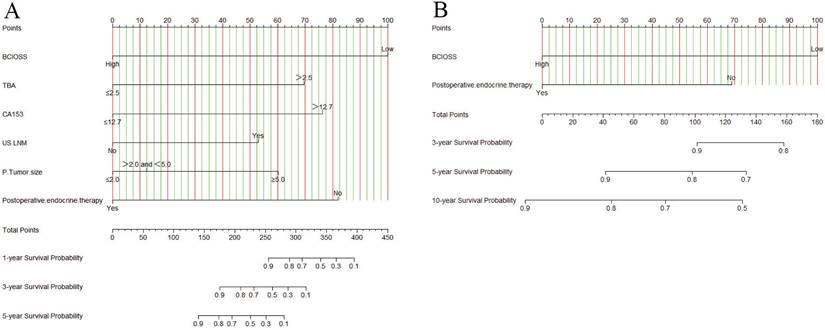
A nomogram for individualized assessment was established using multivariate analysis. According to this nomogram, patients with higher grades had a lower survival probability. Nomogram for DFS included BCIOSS, TBA, CA153, US-LNM, P-tumor size, and postoperative endocrine therapy. Nomograms for OS included the BCIOSS and postoperative endocrine therapy. These nomograms were shown in Figure 2. Calibration curves shown that the predicted line conformed well to the reference line for the 5-year survival category (Figure 3).
Nomogram based on BCIOSS for predicting disease free survival (A) and overall survival (B).
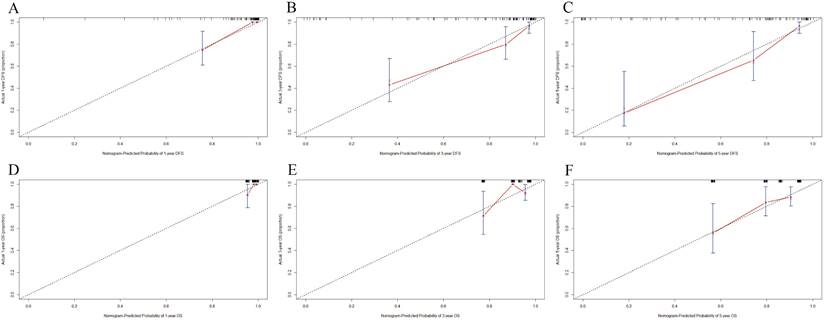
Calibration curves predicting 1-, 3-, 5-year disease free survival (DFS) and overall survival (OS). A) for predicting the 1-year DFS; 2) for predicting the 3-year DFS; C) for predicting the 5-year DFS; D) for predicting the 1-year OS; E) for predicting the 3-year OS; F) for predicting the 5-year OS.
Predictive accuracy by decision curve analysis (DCA) and time dependent ROC for DFS and OS
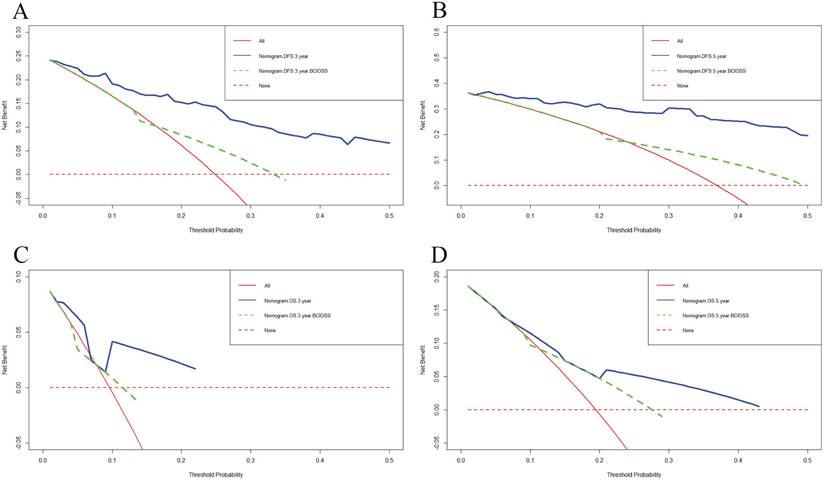
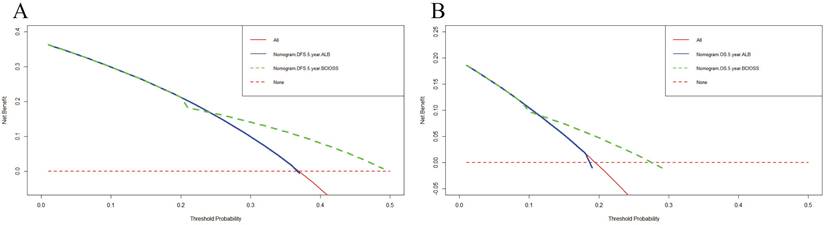
DCA was applied to appraise the benefits and clinical utility of different survival time points between the nomogram model and BCIOSS alone. The results shown that the nomogram of the 3-and 5-year survival time had a better predictive value than BCIOSS alone (Figure 4). We also analyzed the clinical efficacy of BCIOSS and ALB. Compared with ALB, the BCIOSS had better clinical predictive value by DCA (Figure 5).
Decision curve analysis (DCA) for evaluating predictive value of the nomogram and the BCIOSS on DFS and OS. A) DCA of the nomogram and BCIOSS for predicting the 3-year DFS; B) DCA of the nomogram and BCIOSS for predicting the 5-year DFS; C) DCA of the nomogram and BCIOSS for predicting the 3-year OS; D) DCA of the nomogram and BCIOSS for predicting the 5-year OS.
Decision curve analysis (DCA) evaluating BCIOSS and ALB in prediction of 5-year DFS (A) and 5-year OS(B).
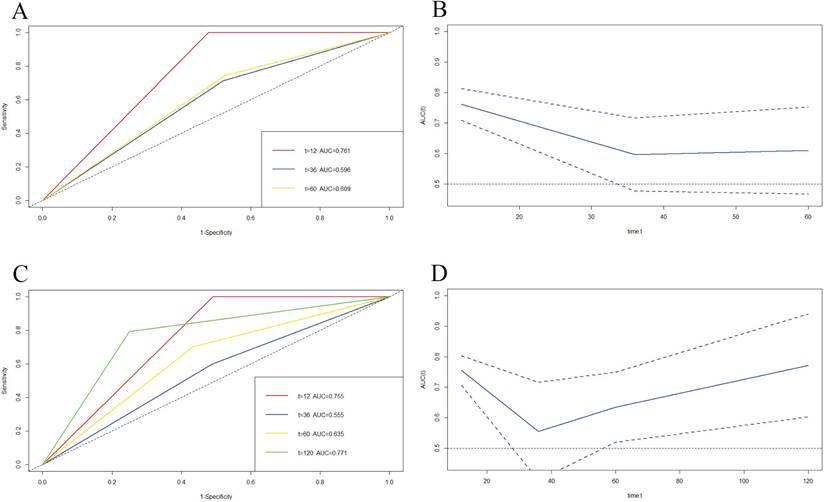
We also used time-dependent ROC (TDROC) and AUC analyses to appraise the prediction accuracy of DFS and OS. TDROC curve of BCIOSS was used to predict 1-, 3-, 5-year or 10-year survival rates. The time-dependent ROC analysis shown that the prognostic accuracy of BCIOSS were 0.761 at 1 year, 0.596 at 3 year, 0.609 at 5 year for DFS (Figure 6A), and Figure 6B shown the AUC and 95%CI changes over 1-, 3-, and 5-year DFS survival rate. In addition, TDROC analysis shown that the prognostic accuracy of BCIOSS were 0.755 at 1 year, 0.555 at 3 year, 0.635 at 5 year, 0.771 at 10 year for OS, respectively (Figure 6C), and Figure 6D shown the AUC and 95%CI changes over 1-, 3-, 5-, and 10-year OS survival rate.
Time-dependent ROC curve for 1-, 3-, 5-year or 10-year survival. A) Time-dependent survival ROC curve for 1-, 3- and 5-year DFS survival; B) AUC and 95%CI changes over 1-, 3-, and 5-year DFS times; C) Time-dependent survival ROC curve for 1-, 3-, 5-, and 10-year OS times; D) AUC and 95%CI changes over 1-, 3-, 5-, and 10-year OS times.
Discussion
Oxidative stress is closely related to formation, advancement, and prognosis of malignant tumors [19, 20]. Prior to tumor determination, superfluous oxidants can cause DNA damage and increase the incidence of tumors [21]. The reduction in oxidation levels induced by antioxidants may diminish the ability to kill cancer cells, thereby leading to the development of cancer and a reduction in therapeutic effects [22]. Breast cancer is a complicated disease that involves tumors and stromal cells [23]. Carcinoma-associated fibroblasts (CAFs) located in the CAFs in cancer stroma enhance angiogenesis and promote tumor growth in the tumor microenvironment [24]. Under systematic oxidative stress, CAFs in the tumor matrix discharge high-energy nutrients to provide fuel for cancer cells, further stimulating cancer cell growth [25]. Oxidative stress is a prominent factor in the progression of breast cancer; however, the relationship between prognosis and the level of systemic oxidative stress remains not known.
In the current study, we explored the latent prognostic significance of BCIOSS in breast cancer patients who underwent NACT and developed a prognostic nomogram model including BCIOSS. The BCIOSS was calculated using ALB, DBIL, and BUN levels. Combined with our data, we included most of the reported biochemical markers related to oxidative stress, such as LDH, ALB, CRP, TBIL, DBIL, SOD, and FIB. In Li L's study, serum LDH > 244 U / L before the T-DM1 treatment was prognostic risk factors for patients with advanced HER2 positive breast cancer receiving T-DM1 treatment, and LDH uptrend after T-DM1 treatment was also related to the poor prognosis [26]. Grupińska J's study demonstrated that adjuvant chemotherapy causes systemic inflammation, manifested by increased hs-CRP and altered markers of oxidative stress in the blood of breast cancer patients [27]. Li Y's study also indicated that significant expression of superoxide dismutase in luminal B breast cancer and its potential as a prospective marker for this specific molecular subtype [28]. Another study also shown that albumin-bilirubin (ALBI) score has high prognostic ability for survival time in breast cancer with liver metastasis after surgery [29]. We analyzed the prognostic significance of systematic oxidative stress according to biochemical oxidative stress markers and the significant differences in ALB and DBIL levels.
Based on the univariate and multivariate analyses, the potential independent predictors of DFS were mainly associated with BCIOSS, TBA, CA153, US-LNM, P-tumor size, and postoperative endocrine therapy, and the potential independent predictors of OS were mainly associated with BCIOSS and postoperative endocrine therapy. Liu YH's study demonstrated that IOSS is a nonspecific tumor predictor based on available oxidative stress index, and low IOSS is found to be a vigorous factor of better prognosis in stage III gastric cancer [30]. In our study, BCIOSS is a potential prognostic indicator, and lower BCIOSS is associated with poorer prognosis and shorter survival time. The 1-, 3-, and 5-year survival rates in high BCIOSS group were higher than those in low BCIOSS group.
We then established a prognostic nomogram identified by BCIOSS and other indicators that could provide higher accuracy in predicting 1-, 3-, 5-year or 10-year survival probabilities than single traditional prognostic indicators. We also used calibration curves to evaluate the probability in patients with breast cancer between prediction and observation, and the results indicated that the predicted line conformed well to the reference line for the 5-year survival category. DCA was used to determine the benefits and clinical utility of different survival time points between the nomogram and BCIOSS, and the results shown that the nomogram of the 3-and 5-year survival probabilities had better predictive clinical application than BCIOSS alone.
Moreover, we went a step further to compare the benefits and clinical utility of BCIOSS and ALB, and the results shown that the nomogram for BCIOSS displayed a better clinical predictive usefulness than ALB. Furthermore, the time dependent ROC curve and AUC were used to evaluate the 1-, 3-, 5-year or 10-year survival rates, and the results indicated that the value of AUC and 95% CI in predicting the 1-year DFS rate and 10-year OS rate were the highest; however, the value of AUC and 95%CI in predicting the 3-year survival rate was lower than other survival time points. These results shown that BCIOSS had a prominence influence on the prognosis of breast cancer and demonstrated the convincingness traditional biomarkers, such as ALB, in improving the prognostic ability of breast cancer patients.
Several reasonable mechanisms expound the relationship between BCIOSS and breast cancer prognosis. BCIOSS is composed of three parts, including the levels of ALB, DBIL, BUN in the peripheral blood. ALB is associated with inflammation, nutritional status, and antioxidant function [31-33]. Elevated ALB can prolong survival in different tumors [34-37]. Owing to its antioxidant function, bilirubin is thought to be an anticancer factor. However, the relationship between bilirubin levels and tumor prognosis is contradictory. Evidence has shown that increased bilirubin levels have a worse prognosis in rectal, lung, colorectal cancer [38-40]. BUN is discharged by the kidney; however, systemic oxidative stress decreases the ability of the kidney to exhaust urea, resulting in an increase in the level of BUN in peripheral blood, which further influences antioxidant treatment [41, 42]. Furthermore, the composition of BUN is the main approach to debase ammonia [43]. Supposing that the composition of BUN is obstructed, this results in an increase in the level of ammonia, which facilitates the production of reactive oxygen species. Elevated BUN is related to shorter survival time in different tumors, including carcinoma of the lungs and breast cancer [44, 45].
Additionally, several studies have reported that antioxidants could reduce the therapeutic effect of breast cancer and may even be conducive to the progression of breast cancer. Vitamin E, an antioxidant, can remarkably decrease reactive oxygen species and expression of P53, then to promote the cell proliferation of MCF-7 [46]. Tamoxifen, an important drug for endocrine therapy of breast cancer, can induce apoptosis in MCF-7 cells by inducing an increase in ROS in the mitochondria, but Vitamin C can protect cancer cells from tamoxifen-induced oxidation, thus inhibiting the death of MCF-7 cells [47]. These findings indicate a complex relationship between oxidative stress and breast cancer.
However, this clinical study had some limitations. First, this was a retrospective study on breast cancer patients with a relatively small sample size. More patients should be enrolled, and validated the prognostic value of BCIOSS in the further study. Second, selection deviation is difficult to dispel because of the eligibility criteria. Third, the nomogram was determined by restricted independent factors and lacked external validation. Finally, owing to clinical limitations, the specific mechanisms of oxidative stress and the indicators included remain unclear. Therefore, further clinical studies with more patients are required to verify our results.
Conclusion
In conclusion, BCIOSS is a breast cancer-integrated oxidative stress score that stems from a combination of oxidative stress indicators. BCIOSS can predict the prognosis of breast cancer patients, and high oxidative stress scores are significantly associated with better prognosis and longer survival time. The nomogram, which combines BCIOSS and other characteristics, can be a predictive layering tool for improving clinical decision making.
Acknowledgements
Funding
This work was partly supported by research grants from the National Natural Science Foundation of China (No.82173328, No.82371842, No.82473205) by Jing Wang and Xiangyu Wang, Hubei Province Postdoctoral Innovation Research Post Fund Project (No.0106540096) by Li Chen, Open Fund for the Key Laboratory of Organ Transplantation of Ministry of Education and National Health Commission (No.2021QYKF03) by Li Chen, Tongji Hospital Cultivation Project (No.2022B03) by Li Chen, Chen Xiao-ping Foundation for the Development of Science and Technology of Hubei province, Youth Science Special Fund (No.CXPJJH123001-2308) by Li Chen.
Data availability statement
The materials supporting the conclusions of this article have been included.
Ethics approval and consent to participate
This study was approved by the ethics review committee of the Cancer Hospital, Chinese Academy of Medical Sciences (approval no. 82173328). And this study was performed in compliance with the 1964 Declaration of Helsinki and its later amendments. The patients were selected and signed informed consent forms.
Author contributions
Investigation and data curation, Li Chen and Caixia Dai; Formal analysis and methodology, Shu Peng and Hao Dong; Project administration and funding acquisition, Xiangyu Wang, Yanfei Liu and Jing Wang; Writing-original draft and review, Li Chen, Caixia Dai, and Shu Peng.
Competing Interests
The authors have declared that no competing interest exists.
References
1. Sung H, Ferlay J, Siegel RL. et al. Global Cancer Statistics 2020: GLOBOCAN Estimates of Incidence and Mortality Worldwide for 36 Cancers in 185 Countries. CA Cancer J Clin. 2021;71:209-249
2. Zhang J, Guan H, Song C. et al. Locoregional treatments of metastatic internal mammary node following neoadjuvant chemotherapy. Chin Med J (Engl). 2025;138:358-360
3. Jia F, Sun S, Li J. et al. Neoadjuvant chemotherapy-induced remodeling of human hormonal receptor-positive breast cancer revealed by single-cell RNA sequencing. Cancer Lett. 2024;585:216656
4. Wu HJ, Chu PY. Recent Discoveries of Macromolecule and Cell-Based Biomarkers and Therapeutic Implications in Breast Cancer. Int J Mol Sci. 2021;22:636
5. Hu J, Fung MW, Tsang JY. et al. Improved Prognostication for the Updated AJCC Breast Cancer Pathological Prognostic Staging Varied in Higher-Stage Groups. Clin Breast Cancer. 2020;20:253-261.e7
6. Nakamura H, Takada K. Reactive oxygen species in cancer: Current findings and future directions. Cancer Sci. 2021;112:3945-3952
7. Aggarwal V, Tuli HS, Varol A. et al. Role of Reactive Oxygen Species in Cancer Progression: Molecular Mechanisms and Recent Advancements. Biomolecules. 2019;9:735
8. Moloney JN, Cotter TG. ROS signalling in the biology of cancer. Semin Cell Dev Biol. 2018;80:50-64
9. Srinivas US, Tan BWQ, Vellayappan BA. et al. ROS and the DNA damage response in cancer. Redox Biol. 2019;25:101084
10. Jelic MD, Mandic AD, Maricic SM. et al. Oxidative stress and its role in cancer. J Cancer Res Ther. 2021;17:22-28
11. Ali SS, Ahsan H, Zia MK. et al. Understanding oxidants and antioxidants: Classical team with new players. J Food Biochem. 2020;44:e13145
12. Hayes JD, Dinkova-Kostova AT, Tew KD. Oxidative Stress in Cancer. Cancer Cell. 2020;38:167-197
13. Sapra A, Jaksik R, Mehta H. et al. Effect of the unfolded protein response and oxidative stress on mutagenesis in CSF3R: a model for evolution of severe congenital neutropenia to myelodysplastic syndrome/acute myeloid leukemia. Mutagenesis. 2020;35:381-389
14. Arfin S, Jha NK, Jha SK. et al. Oxidative Stress in Cancer Cell Metabolism. Antioxidants (Basel). 2021;10:642
15. Sandesc M, Rogobete AF, Bedreag OH. et al. Analysis of oxidative stress-related markers in critically ill polytrauma patients: An observational prospective single-center study. Bosn J Basic Med Sci. 2018;18:191-197
16. Periasamy S, Hsu DZ, Fu YH. et al. Sleep deprivation-induced multi-organ injury: role of oxidative stress and inflammation. EXCLI J. 2015;14:672-683
17. Cao Y, Deng S, Yan L. et al. An Oxidative Stress Index-Based Score for Prognostic Prediction in Colorectal Cancer Patients Undergoing Surgery. Oxid Med Cell Longev. 2021;2021:6693707
18. Ping L, Gao Y, He Y. et al. Systematic Oxidative Stress Indexes Associated with the Prognosis in Patients with T Lymphoblastic Lymphoma/Leukemia. Oxid Med Cell Longev. 2022;2022:2679154
19. Chun KS, Kim DH, Surh YJ. Role of Reductive versus Oxidative Stress in Tumor Progression and Anticancer Drug Resistance. Cells. 2021;10:758
20. Talib WH, Al-Ataby IA, Mahmod AI. et al. The Impact of Herbal Infusion Consumption on Oxidative Stress and Cancer: The Good, the Bad, the Misunderstood. Molecules. 2020;25:4207
21. Shi T, van Soest DMK, Polderman PE. et al. DNA damage and oxidant stress activate p53 through differential upstream signaling pathways. Free Radic Biol Med. 2021;172:298-311
22. Preci DP, Almeida A, Weiler AL. et al. Oxidative damage and antioxidants in cervical cancer. Int J Gynecol Cancer. 2021;31:265-271
23. Mehraj U, Dar AH, Wani NA. et al. Tumor microenvironment promotes breast cancer chemoresistance. Cancer Chemother Pharmacol. 2021;87:147-158
24. Costa A, Kieffer Y, Scholer-Dahirel A. et al. Fibroblast Heterogeneity and Immunosuppressive Environment in Human Breast Cancer. Cancer Cell. 2018;33:463-479.e10
25. Jezierska-Drutel A, Rosenzweig SA, Neumann CA. Role of oxidative stress and the microenvironment in breast cancer development and progression. Adv Cancer Res. 2013;119:107-125
26. Li L, Ai L, Jia L. et al. High score of LDH plus dNLR predicts poor survival in patients with HER2-positive advanced breast cancer treated with trastuzumab emtansine. BMC Cancer. 2022;22:29
27. Grupińska J, Budzyń M, Janowski J. et al. The evaluation of the inflammatory status and systemic antioxidant-oxidant balance of women with breast cancer during adjuvant chemotherapy. Rep Pract Oncol Radiother. 2024;29:488-500
28. Li Y, Du W, Yang R. et al. Copper Chaperone for Superoxide Dismutase Subtypes as a Prognostic Marker in Luminal B Breast Cancer. Clin Med Insights Oncol. 2024;18:11795549231219239
29. Chen L, Tan C, Li Q. et al. Assessment of the albumin-bilirubin score in breast cancer patients with liver metastasis after surgery. Heliyon. 2023;9:e21772
30. Liu YH, Meng R, Zhu B. et al. Integrated oxidative stress score for predicting prognosis in stage III gastric cancer undergoing surgery. Pathol Oncol Res. 2023;29:1610897
31. Sheinenzon A, Shehadeh M, Michelis R. et al. Serum albumin levels and inflammation. Int J Biol Macromol. 2021;184:857-862
32. Eckart A, Struja T, Kutz A. et al. Relationship of Nutritional Status, Inflammation, and Serum Albumin Levels During Acute Illness: A Prospective Study. Am J Med. 2020;133:713-722.e7
33. Madhumita R, Nanda N, Sethi P. et al. Comparison of albumin adjusted ischemia-modified albumin and total antioxidant status in patients with locally advanced head and neck cancer: A pilot study. J Cancer Res Ther. 2022;18:76-80
34. Fang KC, Kao WY, Su CW. et al. The Prognosis of Single Large Hepatocellular Carcinoma Was Distinct from Barcelona Clinic Liver Cancer Stage A or B: The Role of Albumin-Bilirubin Grade. Liver Cancer. 2018;7:335-358
35. Zhang Y, Zhu JY, Zhou LN. et al. Predicting the Prognosis of Gastric Cancer by Albumin/Globulin Ratio and the Prognostic Nutritional Index. Nutr Cancer. 2020;72:635-644
36. Huang H, Zhang L, Chen DB. et al. Validation of Prognosis Value of Cumulative Prognostic Scores Based on Serum High-Density Lipoprotein Cholesterol and Albumin Levels in Patients with Colorectal Cancer. J Cancer. 2019;10:35-42
37. Zhou L, Ma S, Balde AI. et al. A Retrospective Propensity Score Matched Study of the Preoperative C-Reactive Protein to Albumin Ratio and Prognosis in Patients with Resectable Non-Metastatic Breast Cancer. Med Sci Monit. 2019;25:4342-4352
38. Gao C, Fang L, Li JT. et al. Significance and prognostic value of increased serum direct bilirubin level for lymph node metastasis in Chinese rectal cancer patients. World J Gastroenterol. 2016;22:2576-2584
39. Zhang Y, Xu J, Lou Y. et al. Pretreatment direct bilirubin and total cholesterol are significant predictors of overall survival in advanced non-small-cell lung cancer patients with EGFR mutations. Int J Cancer. 2017;140:1645-1652
40. Ma Y, Shi L, Lu P. et al. Creation of a Novel Nomogram Based on the Direct Bilirubin-To-Indirect Bilirubin Ratio and Lactate Dehydrogenase Levels in Resectable Colorectal Cancer. Front Mol Biosci. 2021;8:751506
41. Lopes RCSO, Balbino KP, Jorge MP. et al. Modulation of intestinal microbiota, control of nitrogen products and inflammation by pre/probiotics in chronic kidney disease: a systematic review. Nutr Hosp. 2018;35:722-730
42. Dai Y, Quan J, Xiong L. et al. Probiotics improve renal function, glucose, lipids, inflammation and oxidative stress in diabetic kidney disease: a systematic review and meta-analysis. Ren Fail. 2022;44:862-880
43. Litman T, Søgaard R, Zeuthen T. Ammonia and urea permeability of mammalian aquaporins. Handb Exp Pharmacol. 2009;190:327-358
44. Peng X, Huang Y, Fu H. et al. Prognostic Value of Blood Urea Nitrogen to Serum Albumin Ratio in Intensive Care Unit Patients with Lung Cancer. Int J Gen Med. 2021;14:7349-7359
45. Zhang K, Ping L, Du T. et al. A Novel Systematic Oxidative Stress Score Predicts the Prognosis of Patients with Operable Breast Cancer. Oxid Med Cell Longev. 2021;2021:9441896
46. Diao QX, Zhang JZ, Zhao T. et al. Vitamin E promotes breast cancer cell proliferation by reducing ROS production and p53 expression. Eur Rev Med Pharmacol Sci. 2016;20:2710-2717
47. Subramani T, Yeap SK, Ho WY. et al. Vitamin C suppresses cell death in MCF-7 human breast cancer cells induced by tamoxifen. J Cell Mol Med. 2014;18:305-313
Author contact
![]() Corresponding authors: Professor Jing Wang, Department of Breast Surgical Oncology, National Cancer Center/National Clinical Research Center for Cancer/Cancer Hospital, Chinese Academy of Medical Sciences and Peking Union Medical College, Beijing, 100021, P.R. China. Email: wangjingac.cn. Professor Yanfei Liu, Department of Oncology, Puren Hospital Affiliated to Wuhan University of Science and Technology, Wuhan Hubei 430081 P.R. China. Email: 522057482com. Professor Xiangyu Wang, Department of Breast Surgical Oncology, National Cancer Center/National Clinical Research Center for Cancer/Cancer Hospital, Chinese Academy of Medical Sciences and Peking Union Medical College, Beijing, 100021, P.R. China. Email: doctorwangxycom.
Corresponding authors: Professor Jing Wang, Department of Breast Surgical Oncology, National Cancer Center/National Clinical Research Center for Cancer/Cancer Hospital, Chinese Academy of Medical Sciences and Peking Union Medical College, Beijing, 100021, P.R. China. Email: wangjingac.cn. Professor Yanfei Liu, Department of Oncology, Puren Hospital Affiliated to Wuhan University of Science and Technology, Wuhan Hubei 430081 P.R. China. Email: 522057482com. Professor Xiangyu Wang, Department of Breast Surgical Oncology, National Cancer Center/National Clinical Research Center for Cancer/Cancer Hospital, Chinese Academy of Medical Sciences and Peking Union Medical College, Beijing, 100021, P.R. China. Email: doctorwangxycom.