Impact Factor ISSN: 1449-1907

 Global reach, higher impact
Int J Med Sci 2025; 22(5):1138-1149. doi:10.7150/ijms.103892 This issue Cite
Research Paper
Galactose-Induced Cataracts in Rats: A Machine Learning Analysis
Ahmed Jasim Mahmood Al-Mashhadani1#, Qi Gong1#, Franko Shehaj2, Lianhong Zhou1 ![]()
1. Department of Ophthalmology, Renmin Hospital of Wuhan University, Wuhan 430060, Hubei Province, P.R. China.
2. Department of Orthopedics, Renmin Hospital of Wuhan University, Wuhan 430060, Hubei Province, P.R. China.
# Ahmed Jasim Mahmood Al-Mashhadani and Qi Gong contributed equally and are considered joint first authors.
Received 2024-9-19; Accepted 2024-12-12; Published 2025-2-10
Abstract

Background: Rat models are widely used to study cataracts due to their cost-effectiveness and prominent physiological and genetic similarities to humans The objective of this study was to identify genes involved in cataractogenesis due to galactose exposure in rats.
Methods: We analyzed four datasets from the Gene Expression Omnibus, including both ex vivo and in vivo models of cataracts in different rat strains. Feature selection tools were used to identify genes potentially relevant in cataract-related gene expression. A decision tree algorithm was implemented, and its predictions were interpreted using SHAP and LIME. To validate gene expression levels, PCR was conducted on six rat lenses cultured in M199 medium and galactose to induce cataract and six lenses cultured in M199 alone.
Results: Using feature selection tools, four key genes—PLAGL2, CMTM7, PCYT1B, and NR1D2—were identified. Only PCYT1B was significantly differentially expressed between the cataract and control groups across analyzed datasets. The model showed strong predictive performance, particularly in ex vivo datasets. SHAP and LIME analyses revealed that CMTM7 had the largest impact on model predictions. PCR results did not show significant differences in gene expression between the cataract and control groups.
Conclusion: The decision tree model trained on an in vivo dataset could predict ex vivo and in vivo cataracts despite no significant gene expression differences found between the cataract and control groups. Given a small number of samples, larger studies are needed to validate our findings.
Keywords: eye, cataract, rat, decision tree, PCR
Introduction
Cataract is a common ocular condition characterized by the gradual clouding of the lens, which leads to impaired vision. It is a leading cause of blindness worldwide, affecting millions of people and significantly impacting the quality of life[1, 2]. The primary risk factors for cataract development include aging, use of medications, such as corticosteroids, smoking, alcohol consumption, and certain systemic diseases, such as diabetes mellitus[3, 4]. The etiology of cataracts is multifactorial, involving a combination of genetic, environmental, and lifestyle factors. Oxidative stress, protein aggregation, alterations in lens metabolism, and many other mechanisms have been implicated in the pathogenesis of cataract, leading to the formation of opacities that obstruct light transmission through the lens[5].
Numerous animal models have been used to study cataractogenesis and evaluate potential therapeutic interventions[6-9]. Among these, rat models are widely used due to their cost-effectiveness and prominent physiological and genetic similarities to humans[10, 11]. Cataracts in rat models can be induced through various methods. The galactose-induced cataract model, both in vivo and ex vivo, is particularly notable. In the in vivo approach, rats are administered a high-galactose diet, which leads to the development of cataracts over time. This method mimics the gradual onset of cataracts as seen in human patients with diabetes mellitus. The ex vivo model involves incubating isolated rat lenses in a galactose solution, which induces cataract formation more rapidly and allows for controlled examination of lens pathology[12]. Moreover, specific rat strains, such as Lewis, Royal College of Surgeons (RCS), Sprague-Dawley (SD), Ihara Cataract Rat (ICR), and others, are invaluable in ophthalmic research[13-17]. Rat strains such as ICR (not to be confused with ICR mice, which were developed by the Institute of Cancer Research), which are exclusively used by Japanese researchers, make a great model for studying cataracts as they are prone to the spontaneous development of this disorder[18].
The association between cataracts and various systemic diseases, particularly diabetes, has been known for a while[3]. Diabetes mellitus is a well-established risk factor for cataract formation, with diabetic patients showing an increased prevalence of cataracts compared to non-diabetic individuals[19]. The hyperglycemic environment accelerates lens protein glycation and oxidative stress, leading to the formation of cataracts[20]. Research utilizing rat models has been pivotal in identifying the mechanisms by which diabetes contributes to cataract development, including the role of altered glucose metabolism and inflammatory pathways[21]. In diabetic cataract models, hyperglycemia induces oxidative stress and polyol pathway activation, leading to sorbitol accumulation in the lens. This osmotic stress causes lens fiber cell swelling and rupture[22-24]. Additionally, advanced glycation end-products form on lens proteins, altering their structure and function, which contributes to lens opacity[20]. Inflammation is also exacerbated by upregulation of pro-inflammatory cytokines such as TNF-α and IL-1β, further damaging lens cells[25, 26].
Advances in high-throughput technologies have enabled the comprehensive analysis of gene expression changes in tissues, revealing potential biomarkers and therapeutic targets[27-29]. Various bioinformatics approaches can be employed to analyze gene expression data, including differential expression analysis and machine learning techniques[30, 31]. Machine learning algorithms are increasingly being integrated into ophthalmological applications, such as cataract diagnosis[32]. In this study, we utilized the Least Absolute Shrinkage and Selection Operator (LASSO) and Random Forest (RF) algorithms to identify the most relevant genes associated with cataract. These methods are effective in reducing dimensionality and selecting features that significantly contribute to the model's predictive performance[33]. By applying these techniques, we aimed to pinpoint genes that are associated with cataract development and assess their relevance through decision tree (DT) algorithm training and validation. The application of machine learning algorithms can uncover complex patterns and interactions that may not be apparent through traditional statistical methods[31, 34]. This approach can help identify key genes involved in cataractogenesis and assess their potential utility as biomarkers or therapeutic targets.
Methods
Data Collection
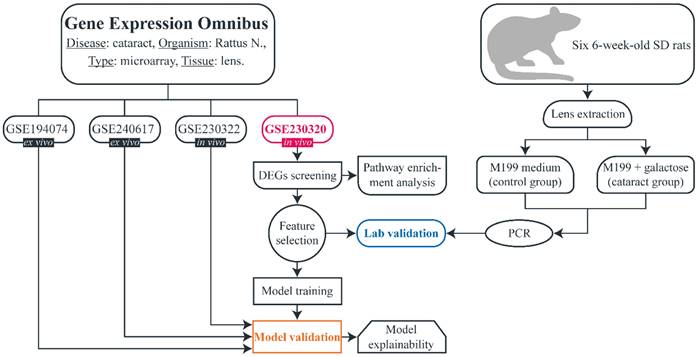
The flowchart of the study is shown in Fig. 1. A search (from inception until 10th April) was conducted in the Gene Expression Omnibus (GEO) to download gene expression datasets. The inclusion criteria were as follows: availability of both cataract and control samples, availability of raw unprocessed data, more than two samples in the dataset, experiment type: array, organism: Rattus norvegicus, extracted material: lens tissue. Four datasets were identified: GSE194074, GSE240617, GSE230320, and GSE230322. All microarray experiments were conducted using Affymetrix Rat Gene 2.0 ST Array, platform - GPL17117). All datasets included galactose-induced cataract samples and non-cataract (control) samples. Samples that were subjected to any treatment after inducing cataract were not included in our study. GSE194074 and GSE240617 were conducted ex vivo and consisted of four lens samples (three cataract and one control) and five samples (two cataract and three control), respectively. GSE230320 and GSE230322 were performed in vivo and included seven lens samples (five cataract and two control) and 12 samples (six cataract and six control), respectively. We hypothesized that there are no major phenotypical differences between non-cataractous lenses from SD and ICR rats, and therefore, no samples were excluded based on this consideration. In addition, we wanted to determine whether the model can successfully predict cataracts regardless of age and strain. Detailed information on each dataset is provided in Table 1.
Datasets used in this study
| Dataset | GSE230320 | GSE230322 | GSE194074 | GSE240617 |
|---|---|---|---|---|
| Model | Galactose-induced cataract | |||
| Experiment type | in vivo | ex vivo | ||
| Analysis type | Microarray | |||
| Platform | GPL17117 | |||
| Details of cataractous lens samples | Five samples from 8- to 18-week-old ICR rats | Six samples from 8- to 10- week-old ICR rats | Three samples from 6-week-old SD rats (incubated for 2-4 days) | Three samples from 6-week-old SD rats (incubated for 2-3 days) |
| Details of control lens samples | Two samples from 2- and 4-week-old ICR rats | Six samples (three from 4-week-old ICR rats + three from 4-10-week-old SD rats) | One sample from 6-week-old SD rat | Two samples from 6-week-old SD rat |
| Reference | [15] | [12] | [17] | |
Flowchart of the study.
R v4.4.1 (Bioconductor v3.19, BiocManager v1.30.23) was utilized to download and normalize datasets as well as perform basic bioinformatics analysis. Datasets were downloaded via the GEOquery package (v2.72.0). Each dataset was subjected to background correction, normalization, and log2 transformation using the RMA function (oligo package, v1.68.2). Then, datasets were annotated with pd.ragene.2.0.st (annotateEset function available in the affycoretools package, v1.76.0). Rows with missing gene symbols and rows with multiple gene symbols were removed. The average value of each column was calculated for every group of rows that shared the same gene symbol.
Bioinformatics Analysis
GSE230320 was regarded as a discovery dataset and was used for differential expression analysis and model training. limma package (v3.60.4) was employed to conduct differential expression analysis. lmFit followed by eBayes and topTable (Benjamini-Hochberg procedure adjusted) functions were utilized to identify differentially expressed genes (DEGs). DEGs with P-value < 0.05 and log fold change (FC) > 0.4 were considered upregulated and DEGs with P-value < 0.05 and log FC < -0.4 were considered downregulated. The density plot of log FC was constructed using basic graphics in R, and the volcano plot was built with the EnhancedVolcano package (v1.22.0).
Gene Ontology (GO) and Kyoto Encyclopedia of Genes and Genomes (KEGG) pathway enrichment analyses were conducted using enrichGO and enrichKEGG functions available in the clusterProfiler package (v4.12.2) and the org.Rn.eg.db package (v3.19.1). Alluvial plot was constructed with the help of ggalluvial (v0.12.5) and ggplot2 (v3.5.1) packages.
Identification of Relevant Genes
Machine learning analysis, including feature selection, was conducted in Python (v3.12.5) with scikit-learn library. LASSO (via LassoCV) and RF (via RandomForestClassifier) were utilized to reduce the dimensionality of the dataset and improve the performance of machine learning algorithms by focusing only on the most important genes. In short, LASSO selects features by shrinking less important ones to zero, thus removing them from the final model, whereas RF selects features by building multiple decision trees and measuring how much each feature improves the accuracy of the final model. GridSearchCV was employed to identify the optimal number of features. Genes selected by LASSO and RF were intersected. The rationale for this is that intersecting genes selected by these two methods could increase the likelihood of identifying truly relevant genes. Each method has its strengths and weaknesses, so intersecting results helps filter out noise and biases specific to one method.
A Venn diagram was drawn to identify the overlapping genes. A T-test was conducted to calculate differences in the expression levels of overlapping genes between cataract and control samples in each dataset (rstatix package, v0.7.2). A P-value of <0.05 was considered statistically significant. Violin plots and heatmap were created with the ggplot2 and pheatmap (v1.0.12) packages, respectively.
Machine Learning Analysis
DT (DecisionTreeClassifier) was trained on the GSE230320 dataset using the intersected genes identified by LASSO and RF. Hyperparameter tuning was performed using GridSearchCV. GSE194074, GSE240617, and GSE230322 were used to validate the final model. The area under the receiver operating characteristics curve (AUROC, or AUC) was calculated to evaluate the performance of DT for each validation dataset.
To enhance the interpretability of the final model, we employed three distinct methods: permutation feature importance (PFI), SHapley Additive exPlanations (SHAP), and Local Interpretable Model-agnostic Explanations (LIME). PFI was utilized to assess the contribution of each gene to the model's predictive performance. This method involves shuffling the values of each gene and measuring the impact on model accuracy[35]. SHAP values provide a unified measure of feature importance and their effects on the prediction for individual instances. By calculating Shapley values, which are derived from cooperative game theory, SHAP explains how each gene contributes to each prediction. LIME was applied to generate local explanations for individual predictions. LIME shows how the model arrives at specific predictions by highlighting the influence of each gene locally[36].
Sample Collection
An ex vivo experiment was performed in order to validate the expression of the identified genes. Six 6-week-old male SD rats (purchased from Hubei Laboratory Animal Research Center) were sacrificed by cervical dislocation. Lenses were removed using aseptic techniques and placed in M199 culture solution containing 100 U/mL penicillin and 100 µ/mL streptomycin. Then, they were incubated at 37℃ in a 5% CO2 incubator for 6 hours. Lens tissues were examined, and those that were not injured and remained transparent were selected for the subsequent experiments.
The 12 lenses were randomly divided into two groups: the cataract group, in which the lenses were cultured in M199 medium containing 30 mmol/galactose, and the control group, in which the lenses were cultured in M199 medium without galactose. Six lenses in each group were cultured at 37℃ with 5% CO2 for 48 hours. Lenses in both groups were carefully examined for any cataractous changes.
Real-Time Polymerase Chain Reaction
First, 1 ml of RNA extraction buffer and three 3 mm grinding beads were added into the grinding tube, which was then placed on ice to chill. The lens was placed into the grinding tube, and the total RNA was extracted according to the manufacturer's instructions (purchased from Wuhan Xavier Biotechnology Co., Ltd.). The RNA concentration was measured using a micro-spectrophotometer (NanoDrop 2000, ThermoFisher, USA), and the A260/A280 ratio was confirmed to be between 1.8 and 2.1 before proceeding. Using the extracted total RNA as a template, reverse transcription was performed following the instructions provided with the reverse transcription kit to synthesize cDNA (G3337-50, Servicebio). A list of primers is provided in Table 2. Real-time polymerase chain reaction (RT-PCR) was performed using CFX Connect RT-PCR Detection System (Bio-Rad, USA). The reaction conditions were as follows: pre-denaturation at 95 ℃ for 30 seconds, 1 cycle; denaturation at 95 ℃ for 15 seconds, annealing/extension at 60 ℃ for 30 seconds, 40 cycles. All reactions were performed using technical triplicates. Expression levels of each gene were recorded, and a 2-ΔΔCT method was employed to calculate gene expression relative to GAPDH. Levene's test for equality of variances was performed, and Welch's t-test (or Student's t-test if equal variances were assumed) was used to calculate statistical significance between cataract and control samples. P-value < 0.05 was considered statistically significant. Bar plots were made using ggplot2.
List of primers
| Gene | Forward primer | Reverse primer | Length (bp) |
|---|---|---|---|
| GAPDH | 5'-CTGGAGAAACCTGCCAAGTATG | 5'-GGTGGAAGAATGGGAGTTGCT | 138 |
| PLAGL2 | 5'-GTGAAATCTCGGGGACACCAT | 5'-GGGTGGCCATGTGCCTATACA | 150 |
| NR1D2 | 5'-TGAGGATGAACAGGAACCGC | 5'-GCCAAATCGAACAGCGTCC | 86 |
| CMTM7 | 5'- TGGTAGCCGGAGCGATCTTT | 5'-GAGGGGACGGAGAGGCTATG | 136 |
| PCYT1B | 5'-TGGCCATGCCAGTACTTACC | 5'- GCAGTCAGGGTCAGTCGAG | 133 |
Results
Bioinformatics Analysis
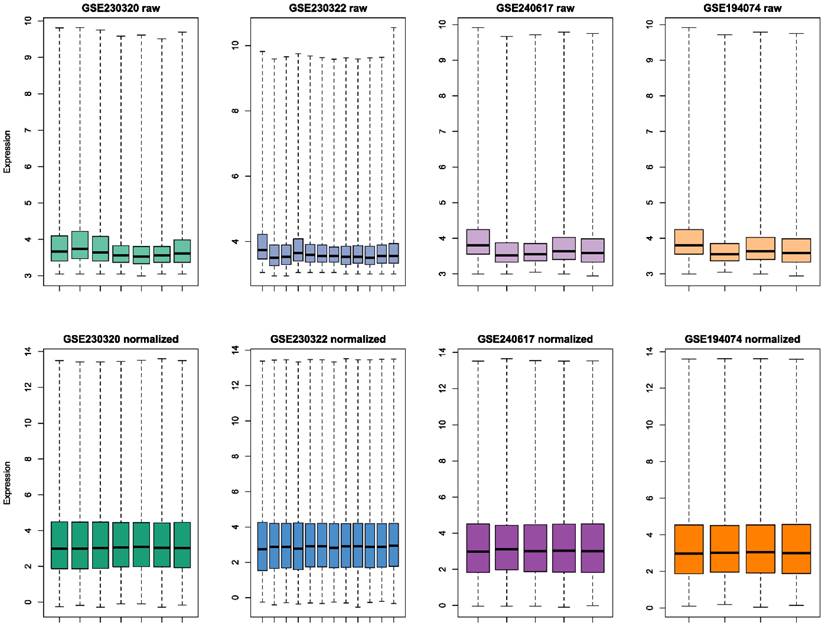
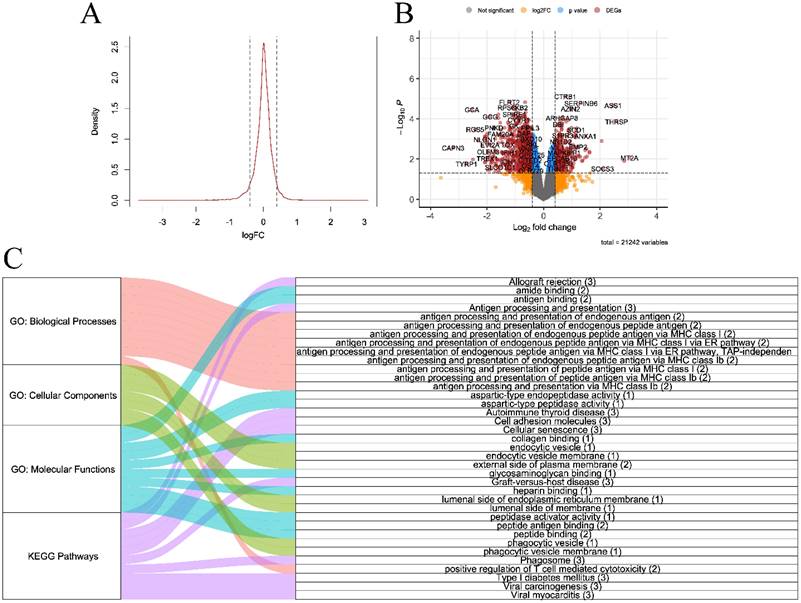
Raw and preprocessed datasets are displayed in Fig. 2. Each dataset initially contained 36685 rows. After all preprocessing steps were complete, 22259 genes remained in each dataset. DEGs screening was performed in the discovery set (GSE230320). A total of 929 downregulated and 438 upregulated DEGs were identified (Fig. 3A-B). According to the results of GO enrichment analysis of biological processes, DEGs were mainly enriched in antigen processing and presentation via major histocompatibility complex (MHC) class I. In addition, genes were predominantly found in endocytic and phagocytic vesicles as well as plasma and endoplasmic reticulum membranes. The identified genes mainly had functions in antigen binding. Based on KEGG enrichment analysis, the genes were enriched in pathways related to graft-versus-host disease, allograft rejection, type I diabetes, and viral carcinogenesis.
Boxplots of raw and normalized datasets. Whiskers in boxplots extend to extreme points.
A. Density plot of log fold change (FC) of differentially expressed genes B. Volcano plot C. Alluvial plot of Gene Ontology (biological processes, cellular components, and molecular functions) and Kyoto Encyclopedia of Genes and Genomes enrichment analyses (all P-value < 0.05, gene counts are shown in brackets)
Identification of Relevant Genes
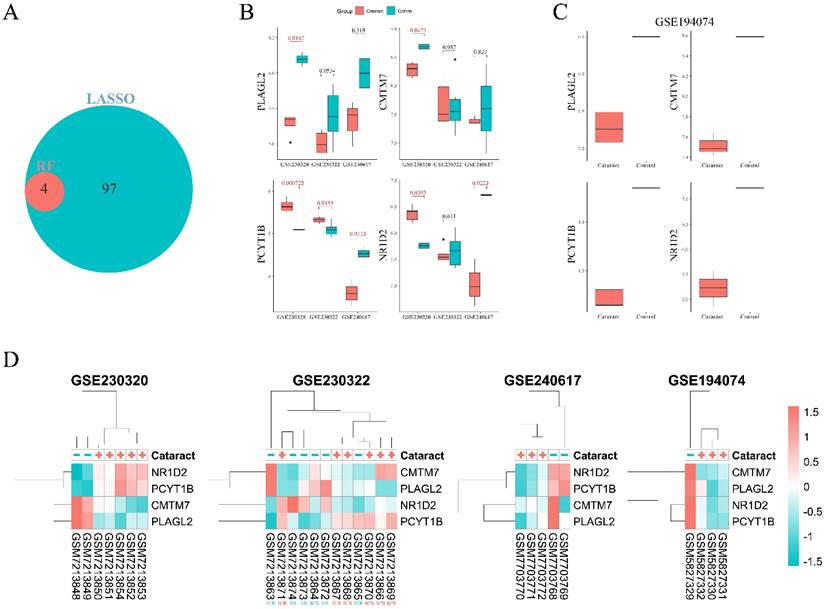
A total of 101 genes were selected using LASSO, and four genes were identified by RF. The intersection of genes selected by these two feature selection tools revealed four overlapping genes: PLAGL2, CMTM7, NR1D2, and PCYT1B (Fig. 4A). The expression levels of these genes were compared between cataract and control groups in the GSE230320, GSE230322, and GSE240617 datasets (Fig. 4B). GSE194074 was excluded from the analysis as it contained only one control sample, making a t-test infeasible. Boxplots of expression levels of the four genes in this dataset are shown in Fig. 4C. Notably, PCYT1B was the only gene that was significantly differentially expressed between the two groups across both in vivo and ex vivo datasets. Interestingly, in ex vivo galactose-induced cataractous lenses, PCYT1B expression was lower compared to controls, whereas the opposite trend was observed in in vivo studies. Although NR1D2 was significantly downregulated in the cataract group compared to the control group in the GSE240617 dataset (P = 0.02), its expression did not significantly differ between cataract and control samples in the GSE230322 dataset (P = 0.61). A heatmap was generated to analyze sample clustering and gene expression magnitudes across four datasets (Fig. 4D). The heatmap revealed strong clustering patterns for all datasets except GSE230322, where cataract and control samples were not well separated, with most samples clustering together regardless of their group. For example, a cataractous sample from a 10-week-old ICR rat clustered with a control sample from an SD rat of the same age. Moreover, a control sample from a 4-week-old ICR rat clustered with cataractous lenses from 10-week-old and 8-week-old ICR rats. When comparing expression patterns of CMTM7 and PLAGL2 between the cataract and control groups, similar trends were observed in GSE230320, GSE240617, GSE194074, and selected samples in GSE230322.
A. Intersected genes selected by the Least Absolute Shrinkage and Selection Operator (LASSO) and Random Forest (RF) feature selection tools. B. Boxplots of the four overlapped genes (PLAGL2, CMTM7, NR1D2, and PCYT1B) between cataract and non-cataract groups across three datasets (GSE230320, GSE230322, GSE240617). The GSE194074 dataset had only one control sample, and thus t-test could not be performed. Significant differences are highlighted in red. C. Boxplots of PLAGL2, CMTM7, NR1D2, and PCYT1B in the cataract and control groups in the GSE194074 dataset. Whiskers: 1st/3rd quartile -/+ (1.5*IQR). D. Clustered heatmaps of the four genes across all four datasets.
Machine Learning Analysis
DT model was trained on the GSE230320 using PLAGL2, CMTM7, NR1D2, and PCYT1B. The model was validated on one in vivo and two ex vivo datasets. ROC plots were built to assess the model's performance in each dataset (Fig. 5A-C). All datasets showed good performance, particularly in ex vivo datasets with AUC reaching 0.75 and 1.0 in the GSE240617 and GSE194074 datasets.
A-C. Decision tree receiver operating characteristic (ROC) plots of GSE230322, GSE240617, GSE194074. D. Permutation feature importance plot. E. SHapley Additive exPlanations (SHAP) plot F. Local interpretable model-agnostic explanations (LIME) plot.
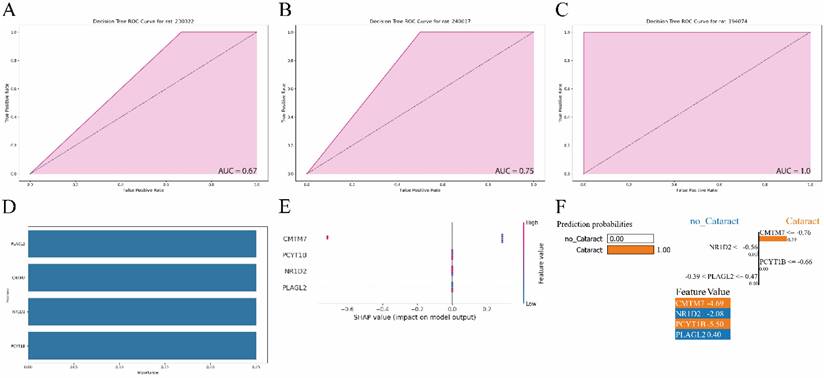
According to the PFI plot (Fig. 5D), PLAGL2, CMTM7, NR1D2, and PCYT1B had the same feature importance value of 0.25. In our analysis of SHAP values (Fig. 5E), only CMTM7 showed a significant impact on the model's predictions for cataract. Specifically, higher values of CMTM7 were associated with a reduced probability of cataract, as evidenced by two samples with SHAP values of approximately -0.7. Conversely, lower values of CMTM7 in five samples were associated with an increased probability of cataract, with SHAP values around 0.3. The other genes, PLAGL2, NR1D2, and PCYT1B, exhibited SHAP values centered around zero, indicating no substantial contribution to the model's predictions. The LIME figure illustrates that CMTM7 and PCYT1B positively influenced the DT model's prediction of cataracts (Fig. 5F). CMTM7, in particular, had the highest impact, suggesting its critical role in the model's decision-making process. NR1D2 and PLAGL2 had a minor negative influence on predicting “no cataracts”.
Validation of Gene Expression Levels in Lenses Ex Vivo
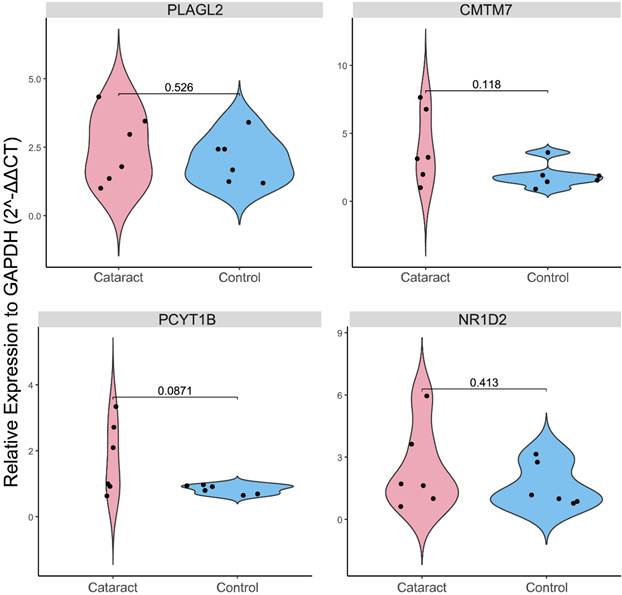
Expression levels of PLAGL2, CMTM7, NR1D2, and PCYT1B were evaluated in ex vivo galactose-induced cataractous rat lenses compared to healthy lenses. After confirming that opacities were successfully induced in all six lenses of the cataract group and no opacities were observed in the six control lenses, an RT-PCR test of each gene was conducted (Supplementary Table 1). Contrary to the earlier findings (Fig. 4B), our results showed no statistically significant differences between the two groups (P-value > 0.05) (Fig. 6).
Violin plot of the results of the real-time polymerase chain reaction (RT-PCR) validation of the expression levels (relative to GAPDH based on 2-ΔΔCT method) of PLAGL2, NR1D2, CMTM7, and PCYT1B between control and cataractous (galactose-induced ex vivo) rat lenses.
Discussion
The identification and interpretation of enriched pathways were challenging due to limited annotations in the rat-specific GO and KEGG databases, as reflected by the low gene counts in each pathway. DEGs were predominantly associated with pathways involved in antigen processing and presentation via the major histocompatibility complex MHC class I, suggesting involvement of immune-mediated processes in the lens tissues of cataract-affected rats[37]. Also, genes were localized to phagosome as well as endocytic and phagocytic vesicles, which implies their presence in these cellular structures rather than indicating an active role in phagocytosis. While phagocytosis is crucial for maintaining retinal cell integrity, particularly in photoreceptor cells[16, 38], it has not been implicated in cataract formation. Thus, the localization of these genes may indicate roles in immune surveillance or other cellular functions related to immune response mechanisms. Moreover, the identified DEGs were enriched in pathways associated with immune responses, including graft-versus-host disease, allograft rejection, etc. Although these conditions are not directly involved in cataract formation in the context of our study, cataractogenesis has been observed as a secondary consequence of retinal allograft rejection in rats[39-41]. Therefore, the presence of these pathways in our results likely reflects broader immune activation within the cataractous lenses.
Four genes were selected as the most relevant for DT model training: PLAGL2, CMTM7, NR1D2, and PCYT1B. In brief, the functions of these genes in the eye and their associations with ophthalmic disorders remain unclear. Most research on PLAGL2 and CMTM7 has focused on cancer. PLAGL2 is a potent oncogene[42-44] that promotes cell cycle progression and proliferation, facilitating the transition from the G0/G1 phase to the S phase and subsequent cell division (G2/M)[45]. In contrast, CMTM7 has been reported to exhibit tumor-suppressive effects by affecting the G1/S transition[46-48]. Members of the PLAG family, including PLAGL2, are involved in retinal cell differentiation[49]. A paralog of PLAGL2, the PLAG1 gene, has recently been implicated in diabetic retinopathy. It promotes angiogenesis and migration of retinal endothelial cells in a diabetic rat model[50]. NR1D2 is associated with circadian rhythms and lipid metabolism[51-54]. Research on NR1D1, a member of the same family as NR1D2, has shown protective effects against retinal inflammation in vitro[55]. In another study, activation of NR1D1 resulted in attenuation of retinal pigment epithelial and retinal damage and countered oxidative stress in age-related macular degeneration murine model[56]. Finally, PCYT1B regulates phosphatidylcholine biosynthesis and is predominantly expressed in the brain and reproductive tissues[57]. Knockdown of PCYT1A (a paralog of PCYT1B) in mice has been reported to induce ferroptosis in the retina[58]. Ferroptosis and other forms of cell death play an important role in the progression of various eye disorders, including corneal injury, cataract, glaucoma, etc.[26, 58, 59].
A heatmap with hierarchical clustering was created to visualize gene expression patterns across four datasets. Cataract and control groups of all ex vivo datasets and the discovery dataset (in vivo) clustered rather well. In the GSE230322 dataset, an unusual clustering pattern was observed. Firstly, a sample with cataract from a 10-week-old ICR rat clustered with a sample from an age-matched healthy SD rat. Although SD rats can occasionally develop spontaneous ocular abnormalities, including cataracts, these are rarely severe, especially compared to strains more prone to cataract formation[60-62]. Secondly, a control sample from a 4-week-old ICR rat clustered with cataractous lenses from 10-week-old and 8-week-old ICR rats. This unexpected clustering could be attributed to various factors, the most probable of which is the biological characteristics specific to this rat strain. However, the GSE230320 dataset displayed clear and consistent clustering, with no control samples from ICR rats clustering with cataract samples. This suggests that the clustering anomaly in GSE230322 was likely influenced by factors unique to the dataset.
A DT model trained on the in vivo dataset (GSE230320), using the genes PLAGL2, CMTM7, NR1D2, and PCYT1B, not only accurately predicted cataracts in the other in vivo dataset but also demonstrated good predictive performance in two separate ex vivo datasets. Although one gene (PCYT1B) was found to be significantly different between the two groups in the GSE230322 dataset, the overall gene expression patterns between cataract and control samples were very similar in this dataset, as shown in the heatmap. This similarity may be one of the factors that contributed to lower AUC values observed in GSE230322 compared to other datasets. In the ex vivo dataset (GSE240617), expression levels of two genes, namely NR1D2 and PCYT1B, were significantly different between cataract and non-cataract groups. Both NR1D2 and PCYT1B displayed opposite expression patterns between the ex vivo and in vivo datasets. This is likely due to altered environmental conditions, stress responses, and different regulatory mechanisms at play in the two settings. In addition, expression levels of the four genes were validated by conducting RT-PCR of rat lenses. In our laboratory validation, no significant differences in expression levels of all genes were observed between the cataract group and the control group. It is possible that the DT model exhibited good predictive performance across all three datasets, despite the lack of differential expression of most genes in these datasets, due to the model's ability to capture complex interactions between features. Machine learning algorithms, such as DT, do not rely solely on the significance of individual features (in this case, genes) but rather on the combination of features and their interactions[63, 64]. Even if the expression levels of individual genes are not significantly different across groups, the model can still identify subtle patterns or interactions between genes that collectively contribute to the prediction of cataract. In other words, the model may have detected small but consistent variations in expression patterns across multiple genes that, when combined, provide a reliable basis for distinguishing cataract from non-cataract samples.
In many settings, DT is a preferred model when it is critical to understand the reasons that lead to a certain prediction[65]. DT model is a particularly effective algorithm for predictive modeling when dealing with gene expression data[66, 67]. The algorithm was used to be regarded as unstable and inaccurate[68], but it has now become one of the most widely used models due to its effectiveness and a relatively low threshold of entry[69]. PFI showed that all four genes had similar importance values in the DT model. However, SHAP and LIME provided different results, identifying CMTM as the most influential gene, with decreased expression correlating with cataract development. The discrepancies between SHAP, LIME, and PFI are due to their differing methodologies. PFI evaluates the impact of a feature by measuring the decrease in model performance when the feature's values are randomly shuffled[35]. This method reflects the overall contribution of a feature to the model's performance but may not capture nuanced interactions or variations across different samples. SHAP and LIME, on the other hand, provide a more nuanced view by considering the effects of features in various contexts and interactions, leading to different interpretations. SHAP values offer a global perspective on feature importance, assessing the impact of each feature across the entire model, which helps in understanding how each gene contributes to the model's predictions on average[70]. LIME focuses on local explanations, providing insights into feature importance for individual predictions. This approach can reveal which features are most influential in specific instances and may highlight interactions and patterns not captured by other methods[71].
Our study has several limitations. Firstly, similar to other gene expression studies, a major limitation of our research was dataset sparsity. Although we used three external datasets to show the generalizability of our findings, they did not have many samples. The training dataset (GSE230320) had only two control and five cataract samples, whereas two ex vivo validation datasets (GSE240617 and GSE194074) had five and four samples, respectively. The second in vivo dataset (GSE230322) was larger and contained 12 samples, but it was not used as a training set due to heterogeneous samples. We did not exclude any samples based on rat strain or age to determine whether the model can successfully predict cataracts regardless of age and strain. Secondly, a relatively small number of lenses (six per group) were harvested for PCR validation. This limited sample size could affect statistical power. Thirdly, the RNA purity ratio was between 1.8-2.1. Although a purity of above 1.8 is generally accepted as sufficient for most applications, it could be considered a bit low in this experiment. Fourthly, the same amplification conditions were applied to all genes. Taken together, larger studies are needed to confirm our findings.
In conclusion, although differences in the gene expression of the three out of four selected genes between cataractous and non-cataractous lenses were not statistically significant, the decision tree model trained on the in vivo dataset demonstrated strong predictive accuracy for both ex vivo and in vivo cataracts.
Supplementary Material
Supplementary Table 1: Real-time polymerase chain reaction (RT-PCR) validation of the expression levels of PLAGL2, NR1D2, CMTM7, and PCYT1B in ex vivo rat model.
Acknowledgements
We would like to express our sincere thanks and gratitude to Bulat Abdrakhimov for the code and all the important comments he provided during conducting the study and drafting the manuscript.
Funding
This research was supported by Key Research and Development Program of Hubei Province (No. 2022BCA044), Health Commission of Hubei Province Scientific Research Project (No. WJ2023Z006), and the Cross-Innovative Talent Program of Renmin Hospital of Wuhan University (No. JCRCGW-2022-007).
Ethics Committee Approval
All animal procedures were carried out in accordance with the National Institutes of Health Guide for the Care and Use of Laboratory Animals and approved by the institutional board.
Data Availability Statement
All datasets were obtained from the Gene Expression Omnibus. Results of the RT-PCR test are available in the supplementary material. Code can be obtained from the corresponding author upon reasonable request.
Competing Interests
The authors have declared that no competing interest exists.
References
1. Lee CM, Afshari NA. The global state of cataract blindness. Current opinion in ophthalmology. 2017;28:98-103
2. Causes of blindness, vision impairment in 2020, trends over 30 years, prevalence of avoidable blindness in relation to VISION 2020. the Right to Sight: an analysis for the Global Burden of Disease Study. The Lancet Global health. 2021;9:e144-e60
3. Ang MJ, Afshari NA. Cataract and systemic disease: A review. Clinical & experimental ophthalmology. 2021;49:118-27
4. Kanakamedala A, Go JA, Wendt S, Ugoh P, Khan M, Al-Mohtaseb Z. Systemic and Ocular Comorbidities of Black, Hispanic, and White Women with Cataracts. Journal of women's health (2002). 2022;31:117-24
5. Gupta VB, Rajagopala M, Ravishankar B. Etiopathogenesis of cataract: an appraisal. Indian journal of ophthalmology. 2014;62:103-10
6. Gulluni F, Prever L, Li H, Krafcikova P, Corrado I, Lo WT. et al. PI(3,4)P2-mediated cytokinetic abscission prevents early senescence and cataract formation. Science (New York, NY). 2021;374:eabk0410
7. Graw J. Mouse models of cataract. Journal of genetics. 2009;88:469-86
8. Liu R, Yan X. Sulforaphane protects rabbit corneas against oxidative stress injury in keratoconus through activation of the Nrf-2/HO-1 antioxidant pathway. International journal of molecular medicine. 2018;42:2315-28
9. Stepp MA, Menko AS. Immune responses to injury and their links to eye disease. Translational research: the journal of laboratory and clinical medicine. 2021;236:52-71
10. Wildner G. Are rats more human than mice? Immunobiology. 2019;224:172-6
11. Aitman TJ, Critser JK, Cuppen E, Dominiczak A, Fernandez-Suarez XM, Flint J. et al. Progress and prospects in rat genetics: a community view. Nature genetics. 2008;40:516-22
12. Nagaya M, Kanada F, Takashima M, Takamura Y, Inatani M, Oki M. Atm inhibition decreases lens opacity in a rat model of galactose-induced cataract. PloS one. 2022;17:e0274735
13. Lakshmanan M. Laboratory Animals. In: Lakshmanan M, Shewade DG, Raj GM, editors. Introduction to Basics of Pharmacology and Toxicology: Volume 3: Experimental Pharmacology: Research Methodology and Biostatistics. Singapore: Springer Nature Singapore. 2022 p. 13-36
14. Popescu RM, Ober C, Sevastre B, Taulescu M, Negru M, Melega I. et al. Complications of cataract surgery in Wistar rats undergoing treatment with tamsulosin. Experimental and therapeutic medicine. 2019;17:137-46
15. Takashima M, Taniguchi K, Nagaya M, Yamamura S, Takamura Y, Inatani M. et al. Gene profiles and mutations in the development of cataracts in the ICR rat model of hereditary cataracts. Scientific reports. 2023;13:18161
16. Nandrot EF, Dufour EM. Mertk in daily retinal phagocytosis: a history in the making. Advances in experimental medicine and biology. 2010;664:133-40
17. Takashima M, Nagaya M, Takamura Y, Inatani M, Oki M. HIF-1 inhibition reverses opacity in a rat model of galactose-induced cataract. PloS one. 2024;19:e0299145
18. Ihara N. A new strain of rat with an inherited cataract. Experientia. 1983;39:909-11
19. Kiziltoprak H, Tekin K, Inanc M, Goker YS. Cataract in diabetes mellitus. World journal of diabetes. 2019;10:140-53
20. Fan X, Monnier VM. Protein posttranslational modification (PTM) by glycation: Role in lens aging and age-related cataractogenesis. Experimental eye research. 2021;210:108705
21. Eggers ED. Visual Dysfunction in Diabetes. Annual review of vision science. 2023;9:91-109
22. Kim JY, Park JH, Kang SS, Hwang SB, Tchah H. Topical nerve growth factor attenuates streptozotocin-induced diabetic cataracts via polyol pathway inhibition and Na(+)/K(+)-ATPase upregulation. Experimental eye research. 2021;202:108319
23. Chitra PS, Chaki D, Boiroju NK, Mokalla TR, Gadde AK, Agraharam SG. et al. Status of oxidative stress markers, advanced glycation index, and polyol pathway in age-related cataract subjects with and without diabetes. Experimental eye research. 2020;200:108230
24. Kikuchi K, Murata M, Noda K, Kase S, Tagawa Y, Kageyama Y. et al. Diabetic Cataract in Spontaneously Diabetic Torii Fatty Rats. Journal of diabetes research. 2020;2020:3058547
25. Dammak A, Pastrana C, Martin-Gil A, Carpena-Torres C, Peral Cerda A, Simovart M. et al. Oxidative Stress in the Anterior Ocular Diseases: Diagnostic and Treatment. Biomedicines. 2023;11:292
26. Zhang Y, Jiao Y, Li X, Gao S, Zhou N, Duan J. et al. Pyroptosis: A New Insight Into Eye Disease Therapy. Frontiers in pharmacology. 2021;12:797110
27. Wang X, He Y, Mackowiak B, Gao B. MicroRNAs as regulators, biomarkers and therapeutic targets in liver diseases. Gut. 2021;70:784-95
28. Bauer JW, Bilgic H, Baechler EC. Gene-expression profiling in rheumatic disease: tools and therapeutic potential. Nature reviews Rheumatology. 2009;5:257-65
29. Bareche Y, Kelly D, Abbas-Aghababazadeh F, Nakano M, Esfahani PN, Tkachuk D. et al. Leveraging big data of immune checkpoint blockade response identifies novel potential targets. Annals of oncology: official journal of the European Society for Medical Oncology. 2022;33:1304-17
30. Nitsch D, Gonçalves JP, Ojeda F, de Moor B, Moreau Y. Candidate gene prioritization by network analysis of differential expression using machine learning approaches. BMC bioinformatics. 2010;11:460
31. MacEachern SJ, Forkert ND. Machine learning for precision medicine. Genome. 2021;64:416-25
32. Li JO, Liu H, Ting DSJ, Jeon S, Chan RVP, Kim JE. et al. Digital technology, tele-medicine and artificial intelligence in ophthalmology: A global perspective. Progress in retinal and eye research. 2021;82:100900
33. Sanchez-Pinto LN, Venable LR, Fahrenbach J, Churpek MM. Comparison of variable selection methods for clinical predictive modeling. International journal of medical informatics. 2018;116:10-7
34. Rajula HSR, Verlato G, Manchia M, Antonucci N, Fanos V. Comparison of Conventional Statistical Methods with Machine Learning in Medicine: Diagnosis, Drug Development, and Treatment. Medicina (Kaunas, Lithuania). 2020;56:455
35. Galkin F, Mamoshina P, Aliper A, Putin E, Moskalev V, Gladyshev VN. et al. Human Gut Microbiome Aging Clock Based on Taxonomic Profiling and Deep Learning. iScience. 2020;23:101199
36. Gramegna A, Giudici P. SHAP and LIME: An Evaluation of Discriminative Power in Credit Risk. Frontiers in artificial intelligence. 2021;4:752558
37. Øynebråten I. Involvement of autophagy in MHC class I antigen presentation. Scandinavian journal of immunology. 2020;92:e12978
38. Kwon W, Freeman SA. Phagocytosis by the Retinal Pigment Epithelium: Recognition, Resolution, Recycling. Frontiers in immunology. 2020;11:604205
39. Jia Z, Lv Y, Zhang W, Zhang X, Li F, Lu X. et al. Mesenchymal stem cell derived exosomes-based immunological signature in a rat model of corneal allograft rejection therapy. Frontiers in bioscience (Landmark edition). 2022;27:86
40. Chu X, Yin Y, Chen S, Chen F, Liu H, Zhao S. Suppressive Role of Pigment Epithelium-derived Factor in a Rat Model of Corneal Allograft Rejection. Transplantation. 2024;108:2072-2083
41. Meng T, Zheng J, Chen M, Zhao Y, Sudarjat H, M RA. et al. Six-month effective treatment of corneal graft rejection. Science advances. 2023;9:eadf4608
42. Hu W, Zheng S, Guo H, Dai B, Ni J, Shi Y. et al. PLAGL2-EGFR-HIF-1/2α Signaling Loop Promotes HCC Progression and Erlotinib Insensitivity. Hepatology (Baltimore, Md). 2021;73:674-91
43. Zheng H, Ying H, Wiedemeyer R, Yan H, Quayle SN, Ivanova EV. et al. PLAGL2 regulates Wnt signaling to impede differentiation in neural stem cells and gliomas. Cancer cell. 2010;17:497-509
44. Chen H, Yang W, Li Y, Ji Z. PLAGL2 promotes bladder cancer progression via RACGAP1/RhoA GTPase/YAP1 signaling. Cell death & disease. 2023;14:433
45. Wu L, Zhao N, Zhou Z, Chen J, Han S, Zhang X. et al. PLAGL2 promotes the proliferation and migration of gastric cancer cells via USP37-mediated deubiquitination of Snail1. Theranostics. 2021;11:700-14
46. Miao B, Bauer AS, Hufnagel K, Wu Y, Trajkovic-Arsic M, Pirona AC. et al. The transcription factor FLI1 promotes cancer progression by affecting cell cycle regulation. International journal of cancer. 2020;147:189-201
47. Pei Y, Zhang Z, Tan S. Current Opinions on the Relationship Between CMTM Family and Hepatocellular Carcinoma. Journal of hepatocellular carcinoma. 2023;10:1411-22
48. Xiao M, Hasmim M, Lequeux A, Moer KV, Tan TZ, Gilles C. et al. Epithelial to Mesenchymal Transition Regulates Surface PD-L1 via CMTM6 and CMTM7 Induction in Breast Cancer. Cancers. 2021;13:1165
49. Alam S, Zinyk D, Ma L, Schuurmans C. Members of the Plag gene family are expressed in complementary and overlapping regions in the developing murine nervous system. Developmental dynamics: an official publication of the American Association of Anatomists. 2005;234:772-82
50. Gu Q, Wei HF. PLAG1 Promotes High Glucose-Induced Angiogenesis and Migration of Retinal Endothelial Cells by Regulating the Wnt/β-Catenin Signalling Pathway. Folia biologica. 2022;68:25-32
51. Hida A, Iida A, Ukai M, Kadotani H, Uchiyama M, Ebisawa T. et al. Novel CLOCK and NR1D2 variants in 64 sighted Japanese individuals with non-24-hour sleep-wake rhythm disorder. Sleep. 2023;46:zsad063
52. Noh SG, Jung HJ, Kim S, Arulkumar R, Kim DH, Park D. et al. Regulation of Circadian Genes Nr1d1 and Nr1d2 in Sex-Different Manners during Liver Aging. International journal of molecular sciences. 2022;23:10032
53. Hunter AL, Pelekanou CE, Barron NJ, Northeast RC, Grudzien M, Adamson AD. et al. Adipocyte NR1D1 dictates adipose tissue expansion during obesity. eLife. 2021;10:e63324
54. Lindholm C, Batakis P, Altimiras J, Lees J. Intermittent fasting induces chronic changes in the hepatic gene expression of Red Jungle Fowl (Gallus gallus). BMC genomics. 2022;23:304
55. Wang Z, Huang Y, Chu F, Ji S, Liao K, Cui Z. et al. Clock Gene Nr1d1 Alleviates Retinal Inflammation Through Repression of Hmga2 in Microglia. Journal of inflammation research. 2021;14:5901-18
56. Huang S, Liu CH, Wang Z, Fu Z, Britton WR, Blomfield AK. et al. REV-ERBα regulates age-related and oxidative stress-induced degeneration in retinal pigment epithelium via NRF2. Redox biology. 2022;51:102261
57. Karim M, Jackson P, Jackowski S. Gene structure, expression and identification of a new CTP:phosphocholine cytidylyltransferase beta isoform. Biochimica et biophysica acta. 2003;1633:1-12
58. Wang K, Xu H, Zou R, Zeng G, Yuan Y, Zhu X. et al. PCYT1A deficiency disturbs fatty acid metabolism and induces ferroptosis in the mouse retina. BMC biology. 2024;22:134
59. Federici TJ. The non-antibiotic properties of tetracyclines: clinical potential in ophthalmic disease. Pharmacological research. 2011;64:614-23
60. Kuno H, Usui T, Eydelloth RS, Wolf ED. Spontaneous ophthalmic lesions in young Sprague-Dawley rats. The Journal of veterinary medical science. 1991;53:607-14
61. Morita J, Yamashita H, Sugihara K, Wakamatsu M, Sasaki M. Spontaneous Ocular Abnormalities in Sprague-Dawley Rats. Comparative medicine. 2020;70:140-4
62. Nishida S, Mizuno K, Matubara A, Kurono M. Age-related cataract in the hereditary cataract rat (ICR/1): development and classification. Ophthalmic research. 1992;24:253-9
63. Eraslan G, Avsec Ž, Gagneur J, Theis FJ. Deep learning: new computational modelling techniques for genomics. Nature reviews Genetics. 2019;20:389-403
64. Hou J, Pelillo M. A simple feature combination method based on dominant sets. Pattern Recognition. 2013;46:3129-39
65. Barros RC, Basgalupp MP, Freitas AA, Carvalho ACPLFd. Evolutionary Design of Decision-Tree Algorithms Tailored to Microarray Gene Expression Data Sets. IEEE Transactions on Evolutionary Computation. 2014;18:873-92
66. Hepburn AC, Lazzarini N, Veeratterapillay R, Wilson L, Bacardit J, Heer R. Identification of CNGB1 as a Predictor of Response to Neoadjuvant Chemotherapy in Muscle-Invasive Bladder Cancer. Cancers. 2021;13:3903
67. Xu T, Wang L, Jia P, Song X, Zhao Z. An Integrative Transcriptomic and Methylation Approach for Identifying Differentially Expressed Circular RNAs Associated with DNA Methylation Change. Biomedicines. 2021;9:657
68. Huang J, Fang H, Fan X. Decision forest for classification of gene expression data. Computers in Biology and Medicine. 2010;40:698-704
69. Czajkowski M, Kretowski M. Decision tree underfitting in mining of gene expression data. An evolutionary multi-test tree approach. Expert Systems with Applications. 2019;137:392-404
70. ElShawi R, Sherif Y, Al-Mallah M, Sakr S. Interpretability in healthcare: A comparative study of local machine learning interpretability techniques. Computational Intelligence. 2021;37:1633-50
71. Ribeiro MT, Singh S, Guestrin C. "Why Should I Trust You?": Explaining the Predictions of Any Classifier. Proceedings of the 22nd ACM SIGKDD International Conference on Knowledge Discovery and Data Mining. San Francisco, California, USA: Association for Computing Machinery. 2016 p. 1135-44
Author contact
![]() Corresponding author: Prof. Lianhong Zhou; email: 2935292648com.
Corresponding author: Prof. Lianhong Zhou; email: 2935292648com.