Impact Factor ISSN: 1449-1907
- Issue 9; 2026
- Issue 8; 2026
- Issue 7; 2026
- Issue 6; 2026
- Issue 5; 2026
- Volume 23; 2026
- Past Issues
- Editorial Board
- Cover Images
- Index & Coverage
- Cover Suggestion
- Special Issues
Introduction
Methods
Results
Discussion
Abbreviations
Supplementary Material
Acknowledgements
References

 Global reach, higher impact
Int J Med Sci 2025; 22(3):696-707. doi:10.7150/ijms.103107 This issue Cite
Research Paper
Trends in Blood Pressure Control in US Adult CKD Patients from 1999 to 2018
Anbang Sun1,2*, Lin Zhu1*, Yanmin Xia3, Yao Zheng1, Bicheng Hu1, Fanghua Li3 ![]() , Yanhong Liao2,4
, Yanhong Liao2,4 ![]()
1. Department of Transfusion Medicine, Traditional Chinese and Western Medicine Hospital of Wuhan, Tongji Medical College, Huazhong University of Science and Technology, Wuhan, 430030, Hubei, China.
2. Department of Anatomy, Tongji Medical College, Huazhong University of Science and Technology, Wuhan, 430030, Hubei, China.
3. Department of Nephrology, The First Affiliated Hospital of Zhengzhou University, Zhengzhou, 450052, Henan, China.
4. Key Laboratory of Neurological Diseases of Ministry of Education, Tongji Medical College, Huazhong University of Science and Technology, Wuhan 430030, China.
*These authors contributed equally to this work.
Received 2024-9-2; Accepted 2025-1-3; Published 2025-1-13
Abstract

Background: Blood pressure (BP) control can slow down the progression of chronic kidney disease (CKD) and protect against cardiovascular diseases, significantly improving patient survival. Herein, we analyzed the changes in BP control in adult CKD patients with hypertension in the United States from 1999-2000 to 2017-2018.
Methods: National Health and Nutrition Examination Survey (NHANES) data from 1999-2000 to 2017-2018 were analyzed, including 5,510 adult CKD patients with BP above 140/90 mmHg or those under an antihypertensive regimen.
Results: The proportion of adult CKD patients with uncontrolled BP decreased from 72.9% in 1999-2000 to 46.6% in 2013-2014, then increased to 56.9% in 2017-2018. Although adult CKD patients with albumin-creatinine rate (ACR) 30-299 mg/g or ACR ≥300 mg/g were more likely to take antihypertensive medication than those with ACR <30 mg/g (PR: 2.76, 95% CI: 1.63-4.79 and PR: 4.59, 95% CI: 2.37-9.51), they were more likely to have uncontrolled BP than those with ACR <30 mg/g ((multivariable-adjusted prevalence ratio (PR): 2.25, 95% CI: 1.39-3.75 and PR: 3.14, 95% CI: 1.71-6.07). Adult CKD patients (eGFR ≥60 mL/min/1.73m2) being aware of their high BP diagnosis were less likely to take antihypertensive medication than those with eGFR 30-59 mL/min/1.73m2 (PR: 0.27, 95% CI: 0.09-0.65).
Conclusions: These results show that BP control should be reinforced in adult CKD patients, particularly in those with ACR ≥300 mg/g, while patients with eGFR ≥60 mL/min/1.73m2 should enhance awareness of taking antihypertensive medication.
Keywords: chronic kidney disease, high blood pressure, hypertension, clinical practice guidelines
Introduction
Chronic kidney disease (CKD) defined by glomerular filtration rate (GFR) below 60 mL/min/1.73m2, or proteinuria, or markers of renal injury (hematuria or morphology abnormalities) lasting for at least 3 months [1-4]. CKD and hypertension are common diseases that interact and associate with each other in the general population [5, 6]. On the one hand, when the estimated glomerular filtration rate (eGFR) decreases, the morbidity and severity of hypertension increase [7]. On the other hand, controlled blood pressure (BP) can slow the progression of CKD from stage 3 or stage 4 to end stage of renal disease (ESRD) and reduce the incidence of cardiovascular disease (CVD) [8-10]. In addition, CKD and hypertension are independent risk factors for CVD [11-14]. Moreover, CVD incidence and mortality risk increase when CKD and hypertension are concomitant [15]. Between 1999-2000 and 2007-2008, the percentage of US adults with controlled blood pressure (<140/90 mmHg) increased, then stabilized between 2009-2010 and 2013-2014, and then declined [16].
In this analysis, we aim to examine whether the BP control rates in CKD patients with hypertension improved in the United States from 1999-2000 to 2017-2018. Additionally, the trends of antihypertensive medication use and hypertension awareness were analyzed. Moreover, we identified the subgroups of individuals with CKD and albuminuria whose BP control needs to be strengthened.
Methods
Data source
National Center for Health Statistics (NCHS) conducts National Health and Nutrition Examination Survey (NHANES) using a stratified, multistage probabilistic sampling approach. Consequently, the study is representative of the noninstitutionalized population in the US. The survey in NHANES is cross-sectional and has been conducted in every two-year cycle, and we pooled 10 cycles from 1999-2000 to 2017-2018. All the data used in this study were downloaded from NHANES. NHANES was approved by the Research Ethics Review Board of the National Center for Health Statistics (NCHS) and all participants of NHANES gave written informed consent prior to any data being collected (https://www.cdc.gov/nchs/nhanes/irba98.htm).
Data collection
NHANES data includes interviews conducted in-home, physical examinations and laboratory measurements on blood and urine samples in a mobile examination center. The covariates included in this study, such as age, race/ethnicity, sex, education, health insurance, health care, body mass index (BMI), smoking status, and diabetes along with their assessment methods, are listed in Supplementary Table 1.
Study population
For our analytic population, we included participants with completed serum creatine, urinary albumin and creatinine measurements (n=63,970). According to the Chronic Kidney Disease Epidemiology Collaboration equation (eGFR = 141 × min (Scr/κ, 1)α × max (Scr/κ, 1)-1.209 × 0.993Age × 1.018 [if female] × 1.159 [if Black], Scr stands for serum creatinine, with κ values of 0.7 for women and 0.9 for men, α values of -0.329 for women and -0.411 for men, min representing the minimum of Scr/κ or 1, and max representing the maximum of Scr/κ or 1.) [17, 18], CKD was defined as eGFR <60 mL/min/1.73m2, or as urine albumin-creatinine rate (ACR) ≥30 mg/g [17]. A total of 10,684 participants met the CKD diagnostic criteria. We excluded those who were less than 20 years old or were pregnant, resulting in 8,876 participants. Among them, 7,710 patients had three independent systolic blood pressure (SBP) and diastolic blood pressure (DBP) measurements. We included those who had SBP ≥140 mmHg or DBP ≥90 mmHg, or answered positively to “Are you now taking prescribed medicine for high BP?” Finally, a total of 5,510 participants were enrolled in this current analysis. Supplementary Figure 1 details the selection of the study sample for this analysis.
Blood pressure (BP) measurement
Trained physicians performed BP measurements-according to a standardized protocol [19]. After a 5-minute rest, three measurements of BP were performed by a mercury sphygmomanometer and an appropriate cuff size at 30-second intervals. If the BP measurement was incomplete or interrupted, a fourth BP measurement was taken. The mean SBP and DBP were calculated using three measurements in each participant.
Hypertension awareness and antihypertensive medication use
A positive response to the question “Have you ever been told by a doctor or other health care professional that you have hypertension?” was considered hypertension awareness [16]. The information on antihypertensive medication use was obtained from the questionnaire “Are you now taking prescribed medication for high BP?” [20].
Recommended BP control targets
SBP <120 mmHg was the BP goal recommended by the 2024 KDIGO guideline [1]. For CKD patients with ACR ≥30 mg/g, SBP ≤130 mmHg and DBP ≤80 mmHg was recommended by the 2012 KDIGO guideline, while SBP ≤140 mmHg and DBP ≤90 mmHg was recommended for those patients with no albuminuria (ACR <30 mg/g) [21]. The 2017 American College of Cardiology (ACC)/ American Heart Association (AHA) guideline recommended SBP/DBP <130/80 mmHg for all CKD patients [22]. In contrast, the 2014 Eighth Joint National Committee (JNC 8) guideline recommended SBP/DBP <140/90 mmHg for all CKD patients [23].
Analysis
The characteristics of CKD patients with hypertension in the US, such as demographics, socioeconomic, health care, and risk factors (diabetes, obesity, smoking) [24-26], were analyzed across the ten two-year cycles from 1999-2000 to 2017-2018. We also assessed the mean SBP and DBP and the distribution of BP categories among adult CKD patients with high BP. The proportion of uncontrolled BP were analyzed for all adult CKD patients with high BP and those using antihypertensive medication. The proportions were assessed within different subgroups, including age, sex, race/ethnicity, education, household income, health insurance, health care, eGFR, ACR, diabetes, obesity, and smoking status. Join-point Regression Program 4.9.1.0 software (Statistical Research and Applications Branch, National Cancer Institute) was used to analyze changes in trends for estimated proportion of the uncontrolled BP among adult CKD patients and separately among those being aware of their hypertension or among those taking antihypertensive medication.
Affected by COVID-19, 2015-2018 is the latest volunteer data of the two calendars, so the population of these two calendars is selected for retrospective analysis. Data from 2015-2018 were pooled to examine factors associated with uncontrolled BP among all adult CKD patients with high BP and adult CKD patients taking antihypertensive medication using logistic and multinomial logistic regression models. Factors associated with hypertension awareness among all adult CKD patients, and antihypertensive medication use among adult CKD patients being aware of they had high BP were estimated using logistic and multinomial logistic regression models. Missing data were multiply imputed using logistic regression. For categorical variables, we used logistic regression for multiple imputation. Specifically, logistic regression was used for binary results variables, and ordinal logistic regression was used for ordinal categorical variables with more than two levels. Linear regression is used for multiple imputation of continuous variables. There is a small amount of missing data from NHANES including education level (0.2%), income (6.5%), ACR (2.5%), health insurance (0.3%), times receive healthcare over past year (0.2%), and BMI (3.1%). The number of imputations conducted in this analysis was 20 [27, 28].
All analyses were conducted based on NHANES survey weights, strata, and complex sampling design units. R (R Project for Statistical Computing, https://www.r-project.org/, version 4.1.3) was used in all analyses, and p <0.05 was considered statistically significant.
Results
Characteristics of the study participants
This analysis showed that the distribution of age, sex, health care, and smoking status of adult CKD participants with hypertension in NHANES were unchanged from 1999 to 2018, while the percentage of other race/ethnicity (including other Hispanic, other multi-racial), high school and college degrees, higher income (more than $45,000), health insurance (including private, Medicare, and government health insurance), diabetes, obesity, and CKD (eGFR 30-59 mL/min/1.73m2) with no albuminuria increased. Table 1 details the characteristics of the participants.
Characteristics of adult CKD with high BP from 1999-2000 to 2017-2018.
| Characteristic | Calendar period | |||||||||
|---|---|---|---|---|---|---|---|---|---|---|
| 1999-2000 (n=443) (95% CI) | 2001-2002 (n=509) (95% CI) | 2003-2004 (n=414) (95% CI) | 2005-2006 (n=437) (95% CI) | 2007-2008 (n=617) (95% CI) | 2009-2010 (n=644) (95% CI) | 2011-2012 (n=540) (95% CI) | 2013-2014 (n=620) (95% CI) | 2015-2016 (n=632) (95% CI) | 2017-2018 (n=654) (95% CI) | |
| Age, y (%) | ||||||||||
| 20-44 | 8.4(5.8-10.9) | 7.5(5.2-9.7) | 5.6(3.3-7.8) | 8.2(5.7-10.8) | 5.8(4.0-7.7) | 6.2(4.3-8.1) | 7.8(5.5-10.0) | 7.3(5.2-9.3) | 8.5(6.4-10.7) | 5.7(3.9-7.4) |
| 45-64 | 22.8(18.9-26.7) | 23.4(19.7-27.1) | 24.2(20.0-28.3) | 26.1(22.0-30.2) | 31.0(27.3-34.6) | 25.3(22.0-28.7) | 27.2(23.5-31.0) | 32.3(28.6-35.9) | 30.4(26.8-34.0) | 31.2(27.6-34.7) |
| 65-74 | 28.4(24.2-32.6) | 23.8(20.1-27.5) | 28.3(23.9-32.6) | 25.4(21.3-29.5) | 26.6(23.1-30.1) | 27.6(24.2-31.1) | 25.9(22.2-29.6) | 27.1(23.6-30.6) | 25.2(21.8-28.5) | 27.2(23.8-30.6) |
| ≥75 | 40.4(35.8-45.0) | 45.4(41.1-49.7) | 42.0(37.3-46.8) | 40.3(35.7-44.9) | 36.6(32.8-40.4) | 40.8(37.0-44.6) | 39.1(35.0-43.2) | 33.4(29.7-37.1) | 35.9(32.2-39.7) | 35.9(32.3-39.6) |
| Gender (%) | ||||||||||
| Female | 50.8(46.1-55.4) | 49.545.2-53.9) | 55.3(50.5-60.1) | 49.0(44.3-53.7) | 54.3(50.4-58.2) | 50.5(46.6-54.3) | 49.4(45.2-53.7) | 51.9(48.0-55.9) | 51.7(47.8-55.6) | 48.6(44.8-52.5) |
| Race/ethnicity (%) | ||||||||||
| Non-Hispanic White | 41.1(36.5-45.7) | 59.5(55.3-63.8) | 56.8(52.0-61.5) | 55.6(50.9-60.3) | 51.2(47.3-55.2) | 51.1(47.2-54.9) | 41.9(37.7-46.0) | 49.8(45.9-53.8) | 38.1(34.3-41.9) | 43.3(39.5-47.1) |
| Non-Hispanic Black | 23.7(19.7-27.7) | 22.4(18.8-26.0) | 17.9(14.2-21.6) | 28.6(24.4-32.8) | 24.5(21.1-27.9) | 21.0(17.8-24.1) | 33.7(29.7-37.7) | 25.0(21.6-28.4) | 23.9(20.6-27.2) | 25.8(22.5-29.2) |
| Mexican | 27.5(23.4-31.7) | 13.4(10.4-16.3) | 18.8(15.1-22.6) | 11.2(8.3-14.2) | 13.1(10.5-15.8) | 15.7(12.9-18.5) | 5.6(3.6-7.5) | 10.3(7.9-12.7) | 17.2(14.3-20.2) | 8.4(6.3-10.5) |
| Other | 7.7(5.2-10.2) | 4.7(2.9-6.6) | 6.5(4.1-8.9) | 4.6(2.6-6.5) | 11.2(8.7-13.7) | 12.3(9.7-14.8) | 18.9(15.6-22.2) | 14.8(12.0-17.6) | 20.7(17.6-23.9) | 22.5(19.3-25.7) |
| Education (%) | ||||||||||
| <High school | 54.2(49.5-58.8) | 40.7(36.4-44.9) | 38.4(33.7-43.1) | 39.1(34.6-43.7) | 40.0(36.2-43.9) | 35.7(32.0-39.4) | 36.9(32.8-40.9) | 29.2(25.6-32.8) | 30.7(27.1-34.3) | 23.5(20.3-26.8) |
| High school graduate and some college | 37.7(33.2-42.2) | 45.2(40.9-49.5) | 49.8(44.9-54.6) | 48.5(43.8-53.2) | 46.5(42.6-50.5) | 50.2(46.3-54.0) | 49.4(45.2-53.7) | 52.4(48.5-56.4) | 54.4(50.5-58.3) | 58.6(54.8-62.3) |
| College graduate | 8.1(5.6-10.7) | 14.1(11.1-17.2) | 11.8(8.7-14.9) | 12.4(9.3-15.4) | 13.3(10.6-16.0) | 14.1(11.4-16.8) | 13.7(10.8-16.6) | 18.4(15.3-21.4) | 14.9(12.1-17.6) | 17.9(15.0-20.8) |
| Household income, $ (%) | ||||||||||
| <44999 | 79.7(75.9-83.4) | 70.9(67.0-74.9) | 73.9(69.7-78.1) | 69.8(65.5-74.1) | 72.3(68.8-75.8) | 66.8(63.1-70.4) | 71.1(67.3-74.9) | 63.4(59.6-67.2) | 69.5(65.9-73.1) | 65.0(61.3-68.6) |
| 45000-74999 | 10.8(7.9-13.7) | 17.3(14.0-20.6) | 16.2(12.6-19.7) | 16.7(13.2-20.2) | 15.2(12.4-18.1) | 19.1(16.1-22.1) | 13.7(10.8-16.6) | 18.4(15.3-21.4) | 16.6(13.7-19.5) | 15.0(12.2-17.7) |
| ≥75000 | 9.5(6.8-12.2) | 11.8(9.0-14.6) | 9.9(7.0-12.8) | 13.5(10.3-16.7) | 8.3(6.1-10.4) | 12.3(9.7-14.8) | 15.2(12.2-18.2) | 18.2(15.2-21.3) | 13.9(11.2-16.6) | 20.0(17.0-23.1) |
| Type of health insurance (%) | ||||||||||
| None | 10.4(7.5-13.2) | 6.7(4.5-8.8) | 6.0(3.7-8.3) | 10.8(7.9-13.7) | 10.4(8.0-12.8) | 11.0(8.6-13.4) | 11.7(9.0-14.4) | 9.8(7.5-12.2) | 10.9(8.5-13.3) | 8.1(6.0-10.2) |
| Private | 58.9(54.3-63.5) | 57.2(52.9-61.5) | 53.1(48.3-57.9) | 91.5(88.9-94.1) | 92.4(90.3-94.5) | 94.7(93.0-96.4) | 90.6(88.1-93.0) | 91.8(89.6-93.9) | 89.7(87.3-92.1) | 92.4(90.3-94.4) |
| Medicare | 69.5(65.2-73.8) | 72.3(68.4-76.2) | 75.8(71.7-80.0) | 96.8(95.1-98.4) | 96.1(94.6-97.6) | 97.0(95.7-98.4) | 94.6(92.7-96.5) | 96.0(94.4-97.5) | 95.6(94.0-97.2) | 95.3(93.6-96.9) |
| government | 7.0(4.6-9.4) | 9.8(7.2-12.4) | 10.1(7.2-13.1) | 40.7(36.1-45.3) | 38.1(34.3-41.9) | 37.4(33.7-41.2) | 38.0(33.9-42.1) | 40.5(36.6-44.3) | 43.5(39.6-47.4) | 43.0(39.2-46.8) |
| Had usual health care facility (%) | 93.0(90.6-95.4) | 97.1(95.6-98.5) | 95.4(93.4-97.4) | 94.5(92.4-96.6) | 95.1(93.4-96.8) | 94.6(92.8-96.3) | 93.9(91.9-95.9) | 95.5(93.8-97.1) | 90.8(88.6-93.1) | 92.7(90.7-94.7) |
| Had health care visit in past year (%) | 92.8(90.4-95.2) | 94.1(92.1-96.2) | 94.9(92.8-97.0) | 94.7(92.6-96.8) | 94.2(92.3-96.0) | 94.4(92.6-96.2) | 92.4(90.2-94.6) | 95.2(93.5-96.9) | 91.5(89.3-93.6) | 93.6(91.7-95.5) |
| Diabetes (%) | 37.0(32.5-41.5) | 35.4(31.2-39.5) | 35.5(30.9-40.1) | 38.0(33.4-42.5) | 42.0(38.1-45.9) | 42.9(39.0-46.7) | 45.0(40.8-49.2) | 41.8(37.9-45.7) | 43.7(39.8-47.5) | 45.7 (41.9-49.5) |
| Weight (%) | ||||||||||
| Normal | 22.6(18.7-26.5) | 24.2(20.4-27.9) | 24.6(20.5-28.8) | 19.7(16.0-23.4) | 22.9(19.5-26.2) | 20.3(17.2-23.5) | 21.1(17.7-24.6) | 21.5(18.2-24.7) | 17.9(14.9-20.9) | 17.3(14.4-20.2) |
| Overweight | 34.3(29.9-38.7) | 38.1(33.9-42.3) | 36.2(31.6-40.9) | 34.6(30.1-39.0) | 31.4(27.8-35.1) | 32.5(28.8-36.1) | 27.6(23.8-31.4) | 31.0(27.3-34.6) | 34.3(30.6-38.0) | 30.9(27.3-34.4) |
| Obese | 43.1(38.5-47.7) | 37.7(33.5-41.9) | 39.1(34.4-43.8) | 45.8(41.1-50.4) | 45.7(41.8-49.6) | 47.2(43.3-51.1) | 51.3(47.1-55.5) | 47.6(43.6-51.5) | 47.8(43.9-51.7) | 51.8(48.0-55.7) |
| Smoking (%) | ||||||||||
| Never smoked | 48.5(43.9-53.2) | 54.6(50.3-58.9) | 54.3(49.5-59.1) | 54.0(49.3-58.7) | 52.5(48.6-56.5) | 51.6(47.7-55.4) | 54.1(49.9-58.3) | 50.5(46.5-54.4) | 50.5(46.6-54.4) | 51.1(47.2-54.9) |
| Former smoker | 35.4(31.0-39.9) | 39.9(35.6-44.1) | 39.9(35.1-44.6) | 37.3(32.8-41.8) | 35.7(31.9-39.4) | 38.5(34.8-42.3) | 36.3(32.2-40.4) | 32.4(28.7-36.1) | 33.4(29.7-37.1) | 36.5(32.9-40.2) |
| Current smoker | 13.1(10.0-16.2) | 14.7(11.7-17.8) | 14.5(11.1-17.9) | 16.7(13.2-20.2) | 16.9(13.9-19.8) | 13.0(10.4-15.6) | 17.8(14.6-21.0) | 18.1(15.0-21.1) | 17.1(14.2-20.0) | 14.5(11.8-17.2) |
| eGFR (mL/min/1.73m2) (%) | ||||||||||
| ≥60 | 65.5(61.0-69.9) | 40.3(36.0-44.5) | 39.4(34.7-44.1) | 35.5(31.0-40.0) | 47.5(43.5-51.4) | 41.1(37.3-44.9) | 45.2(41.0-49.4) | 44.4(40.4-48.3) | 48.9(45.0-52.8) | 48.6(44.8-52.5) |
| 30-59 | 28.2(24.0-32.4) | 52.7(48.3-57.0) | 56.5(51.7-61.3) | 58.1(53.5-62.7) | 46.8(42.9-50.8) | 51.1(47.2-54.9) | 47.6(43.4-51.8) | 49.4(45.4-53.3) | 44.5(40.6-48.3) | 44.5(40.7-48.3) |
| ≤29 | 6.3(4.1-8.6) | 7.1(4.8-9.3) | 4.1(2.2-6.0) | 6.4(4.1-8.7) | 5.7(3.8-7.5) | 7.8(5.7-9.8) | 7.2(5.0-9.4) | 6.3(4.4-8.2) | 6.6(4.7-8.6) | 6.9(4.9-8.8) |
| ACR (mg/g) (%) | ||||||||||
| <30 | 12.6(9.5-15.8) | 36.8 (32.6-41.1) | 41.8 (37.0-46.6) | 40.2 (35.5-44.8) | 31.3 (27.6-35.0) | 38.4 (34.7-42.2) | 30.9 (27.0-34.9) | 34.8 (31.0-38.6) | 27.6 (24.1-31.2) | 29.9 (26.3-33.5) |
| 30-299 | 67.4(63.0-71.4) | 50.6 (46.2-54.6) | 48.8 (43.9-53.2) | 49.1 (44.3-53.3) | 55.0 (51.0-58.6) | 50.0 (46.1-53.6) | 55.2 (50.9-59.0) | 52.2 (49.2-55.8) | 55.4 (51.5-59.0) | 55.5 (51.7-59.1) |
| ≥300 | 19.9(16.1-23.7) | 12.6 (9.6-15.5) | 9.4 (6.6-12.3) | 10.7 (7.8-13.7) | 13.7 (11.0-16.5) | 11.6 (9.1-14.0) | 13.9 (1.0-16.9) | 13.1 (10.4-15.8) | 16.9 (13.9-19.9) | 14.6 (11.8-17.3) |
Numbers in table are expressed as column percent (95% confidence interval).
Abbreviations: CKD, chronic kidney disease; CI: confidence interval; eGFR, estimated glomerular filtration rate; ACR, albumin-to-creatinine ratio; BMI, body mass index; BP, blood pressure; KDIGO, Kidney Disease Improving Global Outcomes.
eGFR ≥60 mL/min/1.73m2 participants were defined as having CKD based on the presence of albuminuria; ACR <30 mg/g participants were defined as having CKD based on the decreased eGFR.
Distribution of BP among adult CKD with hypertension
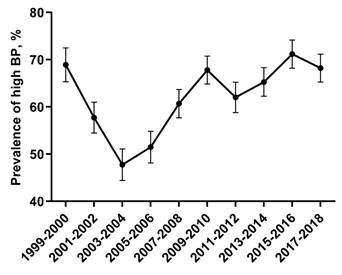
The percentage of adult CKD participants with high BP decreased from 1999-2000 through 2003-2004, and increased from 2005-2006 through 2017-2018 (Figure 1). As presented in Table 2, the most common category of SBP/DBP from 1999-2000 through 2017-2018 was 140-159/90-99, with the proportion decreasing from 1999 to 2014, and increasing to the same level as 2005-2006.
Percentage of adult CKD with high BP. The percentage of adult CKD participants with high BP decreased from 1999-2000 through 2003-2004, and increased from 2005-2006 through 2017-2018. Error bars indicate 95% confidence intervals. Hypertension was defined by systolic blood pressure ≥140 mmHg and/or diastolic blood pressure ≥90 mmHg and/or antihypertensive medication use. Abbreviations: BP, blood pressure.
The distribution of BP among adult CKD with hypertension from 1999-2000 to 2017-2018.
| Characteristic | Calendar period | |||||||||
|---|---|---|---|---|---|---|---|---|---|---|
| 1999-2000 (n=443) (95% CI) | 2001-2002 (n=509) (95% CI) | 2003-2004 (n=414) (95% CI) | 2005-2006 (n=437) (95% CI) | 2007-2008 (n=617) (95% CI) | 2009-2010 (n=644) (95% CI) | 2011-2012 (n=540) (95% CI) | 2013-2014 (n=620) (95% CI) | 2015-2016 (n=632) (95% CI) | 2017-2018 (n=654) (95% CI) | |
| SBP/DBP category (%) # | ||||||||||
| <120/<80 (mmHg) | 7.0(4.6-9.4) | 9.8(7.2-12.4) | 11.8(8.7-14.9) | 14.0(10.7-17.2) | 17.8(14.8-20.8) | 17.4(14.5-20.3) | 17.2(14.0-20.4) | 19.8(16.7-23.0) | 13.9(11.2-16.6) | 14.7(12.0-17.4) |
| 120-129/<80 (mmHg) | 5.9(3.7-8.1) | 8.4(6.0-10.9) | 10.1(7.2-13.1) | 15.3(12.0-18.7) | 11.3(8.8-13.8) | 14.8(12.0-17.5) | 11.5(8.8-14.2) | 12.9(10.3-15.5) | 14.9(12.1-17.6) | 11.8(9.3-14.2) |
| 130-139/80-89 (mmHg) | 14.2(11.0-17.5) | 16.9(13.6-20.2) | 18.1(14.4-21.8) | 16.7(13.2-20.2) | 17.5(14.5-20.5) | 18.6(15.6-21.6) | 21.1(17.7-24.6) | 20.6(17.5-23.8) | 17.1(14.2-20.0) | 16.7(13.8-19.5) |
| 140-159/90-99 (mmHg) | 38.6(34.1-43.1) | 36.5(32.4-40.7) | 31.9(27.4-36.4) | 33.9(29.4-38.3) | 31.3(27.6-34.9) | 32.6(29.0-36.2) | 33.1(29.2-37.1) | 27.3(23.8-30.8) | 34.0(30.3-37.7) | 34.4(30.8-38.0) |
| ≥160/100 (mmHg) | 34.3(29.9-38.7) | 28.3(24.4-32.2) | 28.0(23.7-32.3) | 20.1(16.4-23.9) | 22.0(18.8-25.3) | 16.6(13.7-19.5) | 17.0(13.9-20.2) | 19.4(16.2-22.5) | 20.1(17.0-23.2) | 22.5(19.3-25.7) |
#Adults were assigned to the higher SBP/DBP category when SBP and DBP levels that crossed over into another category.
Numbers in table are expressed as column percent (95% confidence interval).
Abbreviations: BP, blood pressure; CKD, chronic kidney disease; CI: confidence interval; SBP, systolic blood pressure; DBP, diastolic blood pressure.
Trends for uncontrolled BP among adult CKD participants with high BP were nonlinear, with an inflection point around 2013-2014 (Figure 2). The percentage of uncontrolled BP among CKD patients with high BP decreased from 72.9% (95% confidence interval (CI), 68.8 to 77.1) in 1999-2000 to 46.6% (95% CI, 42.7 to 50.5) in 2013-2014, then increased to 56.9% (95% CI, 53.1 to 60.7) in 2017-2018 (Table 3). When adjusted for demographic, socioeconomic, and clinical characteristics, adult CKD patients with ACR 30-299 mg/g were more likely to have uncontrolled BP compared to patients with no albuminuria (multivariable-adjusted prevalence ratio (PR): 2.25, 95% CI: 1.39-3.75, left panel of Table 4). Similarly, CKD patients aged more than 75 years compared to 20-44 years (PR: 2.55, 95% CI: 1.07-5.84) were more likely to suffer from uncontrolled BP. Uncontrolled BP was less likely among those who had healthcare visit in past year compared with those who had no healthcare visit in past year (PR: 0.29, 95% CI: 0.15-0.51). Adult CKD patients with obese were less likely to have uncontrolled BP when compared with normal weighted adult CKD patients (PR: 0.70, CI: 0.49-0.99).
Percentage of CKD adults with uncontrolled BP according to different guidelines. Trends for uncontrolled BP among adult CKD participants with high BP were nonlinear, with an inflection point around 2013-2014. Error bars indicate 95% confidence intervals. Abbreviations: ACC: American College of Cardiology; AHA: American Heart Association; JNC8: the Eighth Joint National Committee; KDIGO: Kidney Disease Improving Global Outcomes.

Percentage of uncontrolled BP among adult CKD with hypertension from 1999-2000 to 2017-2018.
| Characteristic | Calendar | |||||||||
|---|---|---|---|---|---|---|---|---|---|---|
| 1999-2000(n=323) (95% CI) | 2001-2002 (n=330) (95% CI) | 2003-2004 (n=248) (95% CI) | 2005-2006 (n=236) (95% CI) | 2007-2008 (n=329) (95% CI) | 2009-2010 (n=317) (95% CI) | 2011-2012(n=271) (95% CI) | 2013-2014 (n=289) (95% CI) | 2015-2016 (n=342) (95% CI) | 2017-2018 (n=372) (95% CI) | |
| Overall | 72.9(68.8-77.1) | 64.8(60.7-69.0) | 59.9(55.2-64.6) | 54.0(49.3-58.7) | 53.3(49.4-57.3) | 49.2(45.4-53.1) | 50.2(46.0-54.4) | 46.6(42.7-50.5) | 54.1(50.2-58.0) | 56.9(53.1-60.7) |
| Age, y (%) | ||||||||||
| 20-44 | 7.1(4.3-9.9) | 6.4(3.7-9.0) | 4.8(2.2-7.5) | 8.9(5.3-12.5) | 4.9(2.5-7.2) | 8.2(5.2-11.2) | 6.6(3.7-9.6) | 6.9(4.0-9.8) | 9.4(6.3-12.4) | 4.3(2.2-6.4) |
| 45-64 | 21.1(16.6-25.5) | 19.1(14.9-23.3) | 23.0(17.7-28.2) | 29.2(23.4-35.0) | 34.3(29.2-39.5) | 23.3(18.7-28.0) | 29.2(23.7-34.6) | 31.5(26.1-36.8) | 29.2(24.4-34.1) | 31.2(26.5-35.9) |
| 65-74 | 28.2(23.3-33.1) | 24.2(19.6-28.9) | 28.6(23.0-34.3) | 23.3(17.9-28.7) | 24.6(20.0-29.3) | 25.2(20.5-30.0) | 23.2(18.2-28.3) | 26.0(20.9-31.0) | 21.9(17.5-26.3) | 23.4(19.1-27.7) |
| ≥75 | 43.7(38.2-49.1) | 50.3(44.9-55.7) | 43.5(37.4-49.7) | 38.6(32.3-44.8) | 36.2(31.0-41.4) | 43.2(37.8-48.7) | 41.0(35.1-46.8) | 35.6(30.1-41.2) | 39.5(34.3-44.7) | 41.1(36.1-46.1) |
| Gender (%) | ||||||||||
| Female | 52.3(46.9-57.8) | 52.1(46.7-57.5) | 58.1(51.9-64.2) | 49.6(43.2-56.0) | 57.4(52.1-62.8) | 48.9(43.4-54.4) | 47.2(41.3-53.2) | 50.2(44.4-55.9) | 51.5(46.2-56.8) | 52.4(47.3-57.5) |
| Race/ethnicity (%) | ||||||||||
| Non-Hispanic White | 41.8(36.4-47.2) | 59.4(54.1-64.7) | 54.0(47.8-60.2) | 53.4(47.0-59.8) | 47.4(42.0-52.8) | 47.9(42.4-53.4) | 39.5(33.7-45.3) | 42.9(37.2-48.6) | 35.7(30.6-40.7) | 43.3(38.2-48.3) |
| Non-Hispanic Black | 21.1(16.6-25.5) | 20.9(16.5-25.3) | 19.0(14.1-23.8) | 28.8(23.0-34.6) | 25.8(21.1-30.6) | 21.1(16.6-25.6) | 35.1(29.4-40.7) | 29.1(23.8-34.3) | 26.0(21.4-30.7) | 25.3(20.9-29.7) |
| Mexican | 30.0(25.0-35.0) | 14.8(11.0-18.7) | 19.0(14.1-23.8) | 12.3(8.1-16.5) | 13.7(10.0-17.4) | 18.9(14.6-23.2) | 5.5(2.8-8.3) | 11.1(7.5-14.7) | 17.5(13.5-21.6) | 7.8(5.1-10.5) |
| Other | 7.1(4.3-9.9) | 4.8(2.5-7.2) | 8.1(4.7-11.5) | 5.5(2.6-8.4) | 13.1(9.4-16.7) | 12.0(8.4-15.6) | 19.9(15.2-24.7) | 17.0(12.6-21.3) | 20.8(16.5-25.1) | 23.7(19.3-28.0) |
| Education (%) | ||||||||||
| <High school | 54.2(48.7-59.6) | 40.0(34.7-45.3) | 39.1(33.0-45.2) | 39.8(33.6-46.1) | 42.9(37.5-48.2) | 37.2(31.9-42.5) | 41.3(35.5-47.2) | 32.9(27.5-38.3) | 33.3(28.3-38.3) | 25.8(21.4-30.3) |
| High school graduate and some college | 39.0(33.7-44.3) | 47.3(41.9-52.7) | 49.2(43.0-55.4) | 49.2(42.8-55.5) | 46.5(41.1-51.9) | 48.6(43.1-54.1) | 43.9(38.0-49.8) | 50.2(44.4-55.9) | 52.9(47.6-58.2) | 57.3(52.2-62.3) |
| College graduate | 6.8(4.1-9.6) | 12.7(9.1-16.3) | 11.7(7.7-15.7) | 11.0(7.0-15.0) | 10.6(7.3-14.0) | 14.2(10.4-18.0) | 14.8(10.5-19.0) | 17.0(12.6-21.3) | 13.7(10.1-17.4) | 16.9(13.1-20.7) |
| Household income, $ (%) | ||||||||||
| <44999 | 7.1(4.3-9.9) | 6.4(3.7-9.0) | 4.8(2.2-7.5) | 8.9(5.3-12.5) | 4.9(2.5-7.2) | 8.2(5.2-11.2) | 6.6(3.7-9.6) | 6.9(4.0-9.8) | 9.4(6.3-12.4) | 4.3(2.2-6.4) |
| 45000-74999 | 49.2(43.8-54.7) | 43.3(38.0-48.7) | 51.6(45.4-57.8) | 52.5(46.2-58.9) | 59.0(53.7-64.3) | 48.6(43.1-54.1) | 52.4(46.5-58.3) | 57.4(51.7-63.1) | 51.2(45.9-56.5) | 54.6(49.5-59.6) |
| ≥75000 | 43.7(38.2-49.1) | 50.3(44.9-55.7) | 43.5(37.4-49.7) | 38.6(32.3-44.8) | 36.2(31.0-41.4) | 43.2(37.8-48.7) | 41.0(35.1-46.8) | 35.6(30.1-41.2) | 39.5(34.3-44.7) | 41.1(36.1-46.1) |
| Health insurance (%) | ||||||||||
| None | 11.8(8.3-15.3) | 7.3(4.5-10.1) | 7.3(4.0-10.5) | 13.1(8.8-17.4) | 12.2(8.6-15.7) | 13.2(9.5-17.0) | 14.0(9.9-18.2) | 13.1(9.3-17.0) | 13.2(9.6-16.7) | 11.3(8.1-14.5) |
| Private | 61.9(56.6-67.2) | 52.7(47.3-58.1) | 50.4(44.2-56.6) | 90.3(86.5-94.0) | 92.1(89.2-95.0) | 92.7(89.9-95.6) | 91.1(87.8-94.5) | 90.7(87.3-94.0) | 86.5(82.9-90.2) | 92.7(90.1-95.4) |
| Medicare | 71.8(66.9-76.7) | 75.8(71.1-80.4) | 78.2(73.1-83.4) | 96.6(94.3-98.9) | 95.4(93.2-97.7) | 97.8(96.2-99.4) | 95.9(93.6-98.3) | 94.5(91.8-97.1) | 95.6(93.4-97.8) | 94.6(92.3-96.9) |
| government | 5.9(3.3-8.4) | 8.5(5.5-11.5) | 10.5(6.7-14.3) | 38.1(31.9-44.3) | 38.0(32.7-43.2) | 35.0(29.8-40.3) | 37.6(31.9-43.4) | 42.9(37.2-48.6) | 43.9(38.6-49.1) | 39.8(34.8-44.8) |
| Healthcare facility (%) | 93.2(90.4-95.9) | 96.1(94.0-98.2) | 93.5(90.5-96.6) | 92.4(89.0-95.8) | 93.3(90.6-96.0) | 92.4(89.5-95.3) | 90.0(86.5-93.6) | 92.0(88.9-95.2) | 89.5(86.2-92.7) | 90.9(87.9-93.8) |
| Had health care visit in past year (%) | 93.2(90.4-95.9) | 91.5(88.5-94.5) | 92.7(89.5-96.0) | 91.9(88.5-95.4) | 90.9(87.8-94.0) | 90.2(87.0-93.5) | 87.5(83.5-91.4) | 91.7(88.5-94.9) | 86.8(83.3-90.4) | 91.7(88.9-94.5) |
| Diabetes (%) | 36.5(31.3-41.8) | 34.2(29.1-39.4) | 33.1(27.2-28.9) | 36.4(30.3-42.6) | 40.4(35.1-45.7) | 40.1(34.7-45.5) | 41.0(35.1-46.8) | 40.8(35.2-46.5) | 42.7(37.4-47.9) | 43.8(38.8-48.9) |
| BMI (%) | ||||||||||
| Normal | 22.0(17.5-26.5) | 26.4(21.6-31.1) | 28.6(23.0-34.3) | 21.6(16.4-26.9) | 24.6(20.0-29.3) | 23.0(18.4-27.7) | 26.2(21.0-31.4) | 22.8(18.0-27.7) | 20.8(16.5-25.1) | 19.4(15.3-23.4) |
| Overweight | 34.7(29.5-39.9) | 39.4(34.1-44.7) | 37.9(31.9-43.9) | 32.6(26.6-38.6) | 34.7(29.5-39.8) | 33.4(28.2-38.6) | 28.8(23.4-34.2) | 33.6(28.1-39.0) | 36.5(31.4-41.7) | 33.3(28.5-38.1) |
| Obese | 43.3(37.9-48.7) | 34.2(29.1-39.4) | 33.5(27.6-39.3) | 45.8(39.4-52.1) | 40.7(35.4-46.0) | 43.5(38.1-49.0) | 45.0(39.1-50.9) | 43.6(37.9-49.3) | 42.7(37.4-47.9) | 47.3(42.2-52.4) |
| Smoking status (%) | ||||||||||
| Never smoked | 46.4(41.0-51.9) | 48.8(43.4-54.2) | 51.6(45.4-57.8) | 51.3(44.9-57.6) | 50.8(45.4-56.2) | 50.5(45.0-56.0) | 54.2(48.3-60.2) | 49.5(43.7-55.2) | 49.1(43.8-54.4) | 45.7(40.6-50.8) |
| Former smoker | 35.0(29.8-40.2) | 34.5(29.4-39.7) | 37.9(31.9-43.9) | 33.9(27.9-39.9) | 33.4(28.3-38.5) | 36.9(31.6-42.2) | 36.5(30.8-42.3) | 30.4(25.1-35.8) | 32.7(27.8-37.7) | 32.8(28.0-37.6) |
| Current smoker | 11.5(8.0-14.9) | 14.2(10.5-18.0) | 13.7(9.4-18.0) | 17.4(12.5-22.2) | 17.3(13.2-21.4) | 13.6(9.8-17.3) | 17.7(13.2-22.3) | 19.0(14.5-23.6) | 16.4(12.5-20.3) | 12.9(9.5-16.3) |
| eGFR (mL/min/1.73m2) (%) | ||||||||||
| ≥60 | 66.6(61.4-71.7) | 44.8(39.5-50.2) | 43.1(37.0-49.3) | 39.4(33.2-45.6) | 57.1(51.8-62.5) | 47.6(42.1-53.1) | 49.8(43.9-55.8) | 48.8(43.0-54.6) | 54.4(49.1-59.7) | 55.9(50.9-61.0) |
| 30-59 | 26.6(21.8-31.4) | 49.7(44.3-55.1) | 53.6(47.4-59.8) | 51.7(45.3-58.1) | 36.8(31.6-42.0) | 46.1(40.6-51.5) | 43.2(37.3-49.1) | 43.9(38.2-49.7) | 38.9(33.7-44.1) | 35.8(30.9-40.6) |
| ≤29 | 6.8(4.1-9.6) | 5.5(3.0-7.9) | 3.2(1.0-5.4) | 8.9(5.3-12.5) | 6.1(3.5-8.7) | 6.3(3.6-9.0) | 7.0(4.0-10.1) | 7.3(4.3-10.3) | 6.7(4.1-9.4) | 8.3(5.5-11.1) |
| ACR (mg/g) (%) | ||||||||||
| <30 | 9.6(6.3-12.9) | 30.3 (25.3-35.4) | 38.0 (31.9-44.1) | 32.9 (26.8-39.0) | 20.1 (15.7-24.5) | 31.3 (26.2-36.4) | 23.1 (18.0-28.2) | 19.1 (14.9-23.3) | 19.6 (15.4-23.7) | 9.6 (6.3-12.9) |
| 30-299 | 67.6(62.44-72.82) | 54.2 (48.8-59.6) | 50.4 (44.1-56.7) | 56.3 (49.9-62.7) | 61.4 (56.1-66.8) | 52.2 (46.7-57.7) | 58.3 (52.4-64.3) | 59.2 (54.0-64.5) | 64.3 (59.3-69.2) | 67.6 (62.4-72.8) |
| ≥300 | 22.8(18.1-27.4) | 15.5 (11.5-19.4) | 11.6 (7.5-15.6) | 10.8 (6.8-14.8) | 18.5 (14.2-22.8) | 16.5 (12.4-20.5) | 18.6 (13.9-23.3) | 21.7 (17.3-26.1) | 16.2 (12.4-20.0) | 22.8 (18.1-27.4) |
Numbers in table are expressed as column percent (95% confidence interval).
Abbreviations: CKD, chronic kidney disease; CI: confidence interval; eGFR, estimated glomerular filtration rate; ACR, albumin-to-creatinine ratio; BMI, body mass index; BP, blood pressure; KDIGO, Kidney Disease Improving Global Outcomes.
eGFR ≥60 mL/min/1.73m2 participants were defined as having CKD based on the presence of albuminuria; ACR <30 mg/g participants were defined as having CKD based on the decreased eGFR.
Factors associated with uncontrolled BP among adult CKD with hypertension 2015-2018.
| Characteristic | Adult CKD with hypertension (n=1506) | Adult CKD taking antihypertensive medication (n=1085) | ||||
|---|---|---|---|---|---|---|
| Prevalence ratio %, (95% CI) | Prevalence ratio %, (95% CI) | |||||
| Model 1 | Model 2 | Model 3 | Model 1 | Model 2 | Model 3 | |
| Age, y | ||||||
| 20-44 | 1(ref) | 1(ref) | 1(ref) | 1(ref) | 1(ref) | 1(ref) |
| 45-64 | 0.58(0.29-1.07) | 0.67(0.33-1.26) | 0.80(0.38-1.54) | 1.05(0.50-2.03) | 1.19(0.60-2.53) | 1.54(0.69-3.23) |
| 65-74 | 0.66(0.32-1.24) | 1.21(0.54-2.60) | 1.81(0.77-4.08) | 1.37(0.65-2.71) | 1.59(0.79-3.48) | 2.62(1.13-5.80) |
| ≥75 | 0.79(0.39-1.48) | 1.47(0.65-3.18) | 2.55(1.07-5.84) | 1.38(0.39-1.48) | 1.80(0.88-3.85) | 2.87(1.23-6.47) |
| Gender | ||||||
| Female | 1(ref) | 1(ref) | 1(ref) | 1(ref) | 1(ref) | 1(ref) |
| Male | 0.99(0.73-1.34) | 1.01(0.74-1.39) | 0.91(0.65-1.27) | 0.95(0.69-1.30) | 0.93(0.69-1.31) | 0.96(0.66-1.38) |
| Race/ethnicity | ||||||
| Non-Hispanic White | 1(ref) | 1(ref) | 1(ref) | 1(ref) | 1(ref) | 1(ref) |
| Non-Hispanic Black | 1.55(1.04-2.34) | 1.41(0.93-2.15) | 1.30(0.85-2.02) | 1.98(1.31-3.03) | 1.96(1.30-3.04) | 1.93(1.23-3.09) |
| Mexican | 2.02(1.31-3.20) | 1.64(1.04-2.64) | 1.39(0.87-2.27) | 2.14(1.37-3.43) | 1.87(1.20-3.07) | 1.34(0.82-2.23) |
| other | 1.88(1.14-3.23) | 1.31(0.76-2.35) | 1.10(0.62-2.02) | 1.77(1.05-3.09) | 1.30(0.76-2.41) | 0.96(0.53-1.81) |
| Education | ||||||
| <High school | 1.71(1.12-2.68) | 1.62(1.06-2.54) | 1.49(0.96-2.37) | 1.66(1.08-2.62) | 1.58(1.03-2.51) | 1.35(0.84-2.20) |
| High school graduate and some college | 1(ref) | 1(ref) | 1(ref) | 1(ref) | 1(ref) | 1(ref) |
| College graduate | 0.99(0.66-1.52) | 1.19(0.78-1.86) | 1.04(0.67-1.66) | 1.01(0.67-1.56) | 1.11(0.71-1.74) | 0.84(0.53-1.36) |
| Household income, $ | ||||||
| ≤44999 | 1(ref) | 1(ref) | 1(ref) | 1(ref) | 1(ref) | 1(ref) |
| 45000-74999 | 0.80(0.54-1.23) | 0.86(0.56-1.33) | 0.89(0.58-1.40) | 0.83(0.54-1.29) | 0.84(0.55-1.33) | 0.83(0.52-1.35) |
| ≥75000 | 0.63(0.43-0.94) | 0.66(0.43-1.02) | 0.72(0.46-1.14) | 0.67(0.45-1.00) | 0.72(0.47-1.11) | 0.80(0.50-1.29) |
| Type of health insurance | ||||||
| Private | 0.71(0.50-1.00) | 0.85(0.59-1.22) | 0.90(0.62-1.31) | 0.90(0.49-1.54) | 0.96(0.52-1.66) | 1.07(0.57-1.93) |
| Medicare | 0.52(0.32-0.84) | 0.52(0.32-0.84) | 0.65(0.39-1.06) | 1.01(0.45-2.04) | 0.92(0.40-1.88) | 1.19(0.51-2.53) |
| Government | 0.88(0.57-1.41) | 0.96(0.61-1.55) | 1.01(0.63-1.64) | 1.25(0.91-1.74) | 1.29(0.94-1.81) | 1(ref) |
| None | 1(ref) | 1(ref) | 1(ref) | 1(ref) | 1(ref) | 1.41(0.99-2.02) |
| Healthcare facility | ||||||
| No | 1(ref) | 1(ref) | 1(ref) | 1(ref) | 1(ref) | 1(ref) |
| Yes | 0.53(0.21-1.13) | 0.54(0.22-1.16) | 0.54(0.21-1.19) | 0.64(0.25-1.39) | 0.62(0.24-1.35) | 0.66(0.25-1.49) |
| Healthcare visit in past year | ||||||
| No | 1(ref) | 1(ref) | 1(ref) | 1(ref) | 1(ref) | 1(ref) |
| Yes | 0.28(0.08-0.72) | 0.29(0.08-0.74) | 0.33(0.10-0.87) | 0.31(0.07-0.89) | 0.31(0.07-0.92) | 0.36(0.08-1.10) |
| Diabetes | ||||||
| No | 1(ref) | 1(ref) | 1(ref) | 1(ref) | 1(ref) | 1(ref) |
| Yes | 1.11(0.81-1.53) | 0.80(0.49-1.27) | 0.98(0.70-1.39) | 1.25(0.90-1.74) | 0.74(0.45-1.20) | 1.00(0.69-1.45) |
| BMI | ||||||
| Normal | 1(ref) | 1(ref) | 1(ref) | 1(ref) | 1(ref) | 1(ref) |
| Overweight | 0.94(0.57-1.51) | 1.14(0.83-1.58) | 1.02(0.61-1.68) | 0.79(0.47-1.31) | 1.24(0.90-1.73) | 0.76(0.43-1.31) |
| Obese | 0.74(0.46-1.17) | 1.00(0.60-1.62) | 0.88(0.53-1.42) | 0.70(0.42-1.12) | 0.80(0.47-1.33) | 0.67(0.39-1.14) |
| Smoking status | ||||||
| Never smoked | 1(ref) | 1(ref) | 1(ref) | 1(ref) | 1(ref) | 1(ref) |
| Former smoker | 0.21(0.03-0.71) | 0.22(0.04-0.75) | 0.25(0.04-0.88) | 0.75(0.52-1.08) | 0.74(0.51-1.07) | 0.78(0.52-1.17) |
| Current smoker | 0.30(0.05-1.01) | 0.31(0.05-1.06) | 0.31(0.05-1.11) | 0.63(0.40-1.01) | 0.57(0.35-0.91) | 0.48(0.29-0.80) |
| eGFR (mL/min/1.73m2) | ||||||
| ≥60 | 1(ref) | 1(ref) | 1(ref) | 1(ref) | 1(ref) | 1(ref) |
| 30-59 | 0.28(0.19-0.40) | 0.30(0.21-0.44) | 0.60(0.35-1.04) | 0.30(0.21-0.44) | 0.31(0.21-0.46) | 0.58(0.33-1.02) |
| ≤29 | 0.45(0.21-1.08) | 0.52(0.24-1.24) | 0.72(0.31-1.83) | 0.66(0.31-1.58) | 0.71(0.33-1.71) | 1.19(0.46-3.56) |
| ACR (mg/g) | ||||||
| <30 | 1(ref) | 1(ref) | 1(ref) | 1(ref) | 1(ref) | 1(ref) |
| 30-299 | 3.95(2.77-5.67) | 3.60(2.51-5.20) | 2.25(1.39-3.75) | 3.95(2.72-5.79) | 3.87(2.65-5.69) | 2.76(1.63-4.79) |
| ≥300 | 4.39(2.53-8.06) | 4.12(2.36-7.62) | 3.14(1.71-6.07) | 6.40(3.49-12.62) | 6.07(3.29-12.02) | 4.59(2.37-9.51) |
Numbers in table are expressed as prevalence ratio (95% confidence interval).
Abbreviations: CKD, chronic kidney disease; CI: confidence interval; eGFR, estimated glomerular filtration rate; ACR, albumin-to-creatinine ratio; BMI, body mass index; BP, blood pressure; KDIGO, Kidney Disease Improving Global Outcomes.
eGFR ≥60 mL/min/1.73m2 participants were defined as having CKD based on the presence of albuminuria; ACR <30 mg/g participants were defined as having CKD based on the decreased eGFR.
Model 1: adjusted for age, sex, and race/ethnicity.
Model 2: Model 1+ education, income, health insurance, healthcare facility and healthcare visit.
Model 3: Adjusted for all characteristics listed.
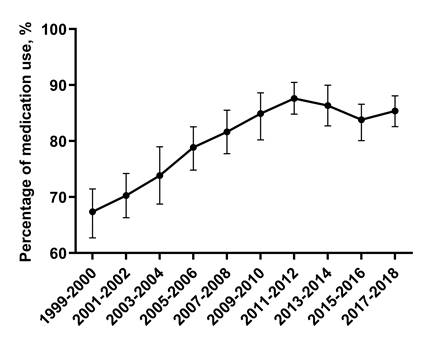
Trends for adult CKD participants taking antihypertensive medication were nonlinear, with an inflection point around 2011-2012 (Figure 3). The percentage of adult CKD patients taking antihypertensive medication among adult CKD patients with high BP increased from 67.0% (95% CI, 62.7-71.4) in 1999-2000 to 87.6% (95% CI, 84.8-90.4) in 2011-2012, then decreased to 85.3% (95% CI, 82.6-88.0) in 2017-2018 (Figure 3). Among adult CKD patients taking antihypertensive medication, those who aged above 75 vs 20-44 (PR: 3.43, 95% CI: 1.81-6.61) were more likely to have uncontrolled BP. When compared with Non-Hispanic White, Non-Hispanic Black taking antihypertensive medication were more likely to have uncontrolled BP (PR: 1.41, 95% CI: 1.00-1.98). Uncontrolled BP were more common among adult CKD patients taking antihypertensive medication with ACR 30-299 mg/g vs ACR <30mg/g (PR: 3.05, 95% CI: 2.03-4.62).
Trends of CKD adults with hypertension taking antihypertensive medication. Trends for adult CKD participants taking antihypertensive medication were nonlinear, with an inflection point around 2011-2012. Error bars indicate 95% confidence intervals.
Moreover, patients with house income more than 75,000$ taking antihypertensive medication were less likely to have uncontrolled BP in comparison to those with house income less than 44,999$ (PR: 0.63, 95% CI: 0.43-0.91). In addition, those had healthcare visit in past year taking antihypertensive medication were less likely to have uncontrolled BP (PR: 0.36, 95% CI: 0.08-1.10) (right panel of Table 4).
Trends for adult CKD patients being aware of their hypertension diagnosis were nonlinear, with an inflection point around 2011-2012 (Supplementary Figure 2A). The percentage of adult CKD patients being aware of their hypertension diagnosis among adult CKD patients with high BP increased from 75.2% (95% CI, 71.2-79.2) in 1999-2000 to 90.2% (95% CI, 87.7-92.7) in 2011-2012, then decreased to 87.9% (95% CI, 85.4-90.4) in 2017-2018 (Supplementary Figure 2A). After adjustment for multivariable, hypertension awareness was more common among those who had healthcare visit in the past year vs. those who had no healthcare visits in the past year (PR: 3.73, 95% CI: 2.07-6.71). Hypertension awareness was more prevalent among obese patients vs. normal weighted patients (PR: 1.70, 95% CI: 1.03-2.78), and among those current smoked vs. never smoked (PR: 2.70, 95% CI: 1.48-5.21), as well as among those who with eGFR ≤29 mL/min/1.73m2 vs. eGFR 30-59 mL/min/1.73m2 (PR: 5.26, 95% CI: 1.29-11.57).
Trends for adult CKD patients who were aware of their hypertension taking antihypertensive medication were nonlinear, with an inflection point around 2011-2012, stabilizing thereafter (Supplementary Figure 2B). The percentage of adult CKD patients being aware of their hypertension taking antihypertensive medication increased from 89.2% (95% CI, 85.9-92.5) in 1999-2000 to 97.1% (95% CI, 95.6-98.1) in 2011-2012, and 97.0% (95% CI, 95.7-98.4) in 2017-2018 (Supplementary Figure 2B). Among adult CKD patients being aware of their high BP diagnosis, those over 75 years old were more likely to take antihypertensive medication vs. patients aged 20-44 (PR: 7.90, 95% CI: 2.05-15.3, right panel of Supplementary Table 2). Among adult CKD patients being aware of their high BP diagnosis, antihypertensive medication use was less likely among those who had government health insurance vs. those who had no health insurance (PR: 0.34, CI: 0.14-0.86). In addition, adult CKD patients (eGFR ≥60 mL/min/1.73m2) being aware of their high BP diagnosis were less likely to take antihypertensive medication vs. those who had eGFR 30-59 mL/min/1.73m2 (PR: 0.27, 95% CI: 0.09-0.65).
Discussion
In this analysis, the estimated percentage of uncontrolled BP among adults with CKD declined from 1999-2000 through 2013-2014, and then increased from 2015-2016. This is in line with the NCHS results and a previous study which found that the percentage of controlled BP decreased from 2013-2014 among adults with hypertension in the US [16, 29].
In 2003, the Seventh Joint National Committee (JNC 7) guideline recommended BP control targets of SBP <130 mmHg and DBP < 80 mmHg for adult CKD [20]. The Action to Control Cardiovascular Risk in Diabetes trial (ACCORD) in 2010 demonstrated that intensive BP control (SBP<120 mm Hg vs <140 mm Hg) in adult diabetes patients did not lower the risk of CVD mortality [30]. JNC 8 guideline recommended a higher BP control target of SBP < 140 mmHg and DBP < 90 mmHg for adult CKD in 2014 [23]. The uncontrolled BP increased from 2013-2014, whether according to the BP control target of the 2021 KDIGO guideline, or the 2012 KDIGO guideline, or the JNC 8 guideline [21-23, 31]. These results suggest that the treatment of hypertension has generally shifted to less intensity.
Although uncontrolled BP among adult CKD patients has decreased since 1999-2000, the subgroups with elderly adults (age ≥75 years old), and ACR 30-299 mg/g had higher uncontrolled BP rates. Even taking antihypertensive medication, those aged more than 75 years old, ACR 30-299 mg/g, or Non-Hispanic Black were more likely to have uncontrolled BP. These results were in line with Chronic Renal Insufficiency Cohort (CRIC) Study [7]. Other study indicated that refractory hypertension was associated with elderly patient, black race, and also albuminuria [32].
This current study showed that adult CKD patients being aware of their hypertension increased from 75.2% in 1999-2000 to 87.9% in 2017-2018. Hypertension awareness was more prevalent among obese, current smoked or those who with eGFR ≤29 mL/min/1.73m2. Not all patients being aware of their high BP take antihypertensive medication, those with eGFR ≥60 mL/min/1.73m2 were less likely to take antihypertensive medication when compared with those who had eGFR 30-59 mL/min/1.73m2 in this analysis. Prior to 2010, a survey from the National Kidney Foundation's Kidney Early Evaluation Program (KEEP) found that 86.2% of adult CKD patients had hypertension, with an awareness rate of 80.2% and a medication usage rate of 70.0%, but only 13.2% had their BP under control. They also found that those with eGFR of 30-59 mL/min/1.73m2 were more likely to have controlled BP than patients with eGFR ≥60 mL/min/1.73m2 [33]. Data from China showed that hypertension awareness, treatment and control rate in adults with CKD in 2004-2005 were 87.2%, 85.9%, and 30.0%, respectively [34]. Awareness of BP control should be reinforced to ensure that adult CKD patients, especially those with eGFR ≥60 mL/min/1.73m2 are screened for hypertension and that antihypertensive treatment is administered promptly.
As an important marker of renal damage, albuminuria has an independent correlation with CKD progression and CVD incidence [15, 35]. Hypertensive patients with ACR ≥30 mg/g were more likely to develop moderate-to-severe intracranial atherosclerotic stenosis [36]. There was a higher prevalence of microvascular disease in elderly hypertensive male patients without comorbidities with a higher ACR [37]. BP control reduces albuminuria, which slows the progression of CKD and reduces the incidence of CVD [38]. Intensive BP control (SBP <120 mmHg) has a more reno-protective effect in those with albuminuria (>1 g/day) than in those without albuminuria, signifying that intensive BP control could possibly reduce albuminuria [30, 39, 40]. In the current analysis, although adult CKD with ACR 30-299 mg/g were more likely to take antihypertensive medication when they were aware of their high BP, this subgroup was more likely to have uncontrolled BP. While those with eGFR ≥60 mL/min/1.73m2 were less likely to take antihypertensive medication. As a result, effort should be made to increase antihypertensive medication use in adult CKD with eGFR ≥60 mL/min/1.73m2, and strengthen BP control in those with ACR 30-299mg/g.
In the current analysis, elderly CKD patients (age ≥75 years) were more likely to have BP above the recommended target, even among those taking antihypertensive medication. Hypertension was prevalent in 82.0% and treated in 87.3% of elderly CKD patients in China, but only 29.6% of those with BP <140/90 mmHg and 12.1% of BP <130/80 mmHg [41]. Another American study revealed that CKD patients aged ≥80 years had higher mean SBP when compared with those aged 40-64 or 65-79 years old [42]. An intensive BP control (SBP=120 mmHg) among those over 75 years old was effective in the SPRINT (the Systolic Blood Pressure Intervention Trial) subgroup analysis, with reduced cardiovascular events and no increase in adverse events [43]. Taken together, our findings show that doctors and patients should strengthen BP control in elderly CKD patients.
The strength of the current study is that the patient population from the NHANES database is representative of the US population as a whole. Moreover, NHANES enrolled a large sample size and followed standardized laboratory measurement and examination procedures. Furthermore, our present study analyzed over 20 years of data about CKD patients with high BP to analyze trends in BP control. Nevertheless, our analysis also has several limitations. Firstly, clinical guidelines define CKD as a decrease in eGFR or the presence of proteinuria for at least three months [20]. However, we may have misclassified CKD as we relied on only a single measurement for serum creatinine and urinary albumin/creatinine from NHANES. However, Equations based on creatinine often overestimated GFR in Black individuals and produced varied outcomes in non-Black individuals. They are also had greater bias when GFR exceeds 60 mL/min/1.73 m2 and lack of precision in population predictions for major CKD-related conditions like diabetes. Cystatin C-based equations exhibited minimal biases and might be better suited for predicting kidney function of Black individuals [26, 44]. Besides, Serum creatinine has additional shortcomings that can affect its reliability in eGFR. For instance, in older patients with reduced muscle mass, serum creatinine levels may be low, leading to an overestimation of GFR [45-47]. Hormones such as thyroid hormones and glucocorticoids can influence muscle metabolism and creatinine production, thereby affecting serum creatinine concentrations [48, 49]. Dehydration can lead to a reduction in plasma volume, which may result in an apparent increase in serum creatinine concentration, falsely suggesting a decline in renal function [50]. There are also other factors can affect serum creatinine levels, further complicating the estimation of GFR, such as variability in measurement methods [51], inulin clearance or not [52], dietary influence (e.g., high-protein diet) [53-55]. Thus, the more efficiency and accurate methods or equations are needed to be explored for kidney function determination. Secondly, antihypertensive medication use was ascertained from participant reports, which could be incorrectly documented or may be biased from clinical practice. Due to the positive response to the question “Have you ever been told by a doctor or other health care professional that you have hypertension?”, the prevalence of hypertension may be overestimated. As convinced by other researchers, compared with pharmacy records, self-reported antihypertensive medication showed better sensitivity, positive predictive value and specificity [56]. Self-reported medication use is accurate compared with prescription data, especially for medication classes that are clearly defined [57]. Hence, self-reported antihypertensive medication errors by patients do not significantly affect hypertension prevalence.
The proportion of uncontrolled BP in US adult CKD patients decreased from 1999-2000 to 2013-2014, but increased after that. Collectively, our findings reveal that BP control should be reinforced in adult CKD patients, particularly in those with ACR 30/-299 mg/g.
Abbreviations
ACC: American College of Cardiology; ACCORD: the Action to Control Cardiovascular Risk in Diabetes trial; ACR: albumin-to-creatinine ratio; AHA: American Heart Association; BMI: body mass index; BP: blood pressure; CI: confidence interval; CKD: chronic kidney disease; CVD: cardiovascular disease; DBP: diastolic blood pressure; eGFR: estimated glomerular filtration rate; ESRD: end stage of renal disease; JNC7: the Seventh Joint National Committee; JNC8: the Eighth Joint National Committee; KDIGO: Kidney Disease Improving Global Outcomes; NCHS: National Center for Health Statistics; NHANES: National Health and Nutrition Examination Survey; SBP: systolic blood pressure; SPRINT: the Systolic Blood Pressure Intervention Trial.
Supplementary Material
Supplementary figures and tables.
Acknowledgements
We thank all NHANES participants and staff for their excellent contributions to guarantee the completion of the NHANES data and making the data available for public use.
Funding
This work was supported by the National Natural Science Foundation of China under Grant [number 82100715, 31171087 and 30970662] and the Henan Medical Science and Technology Research Program (Joint Construction) Project under Grant [number LHGJ20190246].
Ethics approval and consent to participate
All the data used in this study were downloaded from NHANES. NHANES was approved by the Research Ethics Review Board of the National Center for Health Statistics (NCHS) (NCHS IRB/ERC Protocol number: #98-12, #2005-06, #2011-17, #2018-01). Ethical review and approval were waived for this study as it solely used publicly available data for research and publication. All participants of NHANES gave written informed consent prior to any data being collected (https://www.cdc.gov/nchs/nhanes/irba98.htm).
Author contributions
Conception and design: FHL, YHL, BCH, and ABS. Methodology: ABS, LZ, and YMX. Software: ABS, YMX, and ZY. Validation: FHL and ABS. Formal analysis: ABS, LZ, YMX and LFH. Investigation: ABS and LZ. Resources: ABS, LZ, and FHL. Data curation: BCH, MYX, and YZ. Writing-original draft preparation: ABS and LZ. Writing-review and editing: FHL, YHL, and BCH. Supervision: FHL, YHL, and BCH. Project administration: FHL and YHL. All authors have read and agreed to the published version of the manuscript.
Data availability statement
All data included in this study are from a public NHANES database (https://wwwn.cdc.gov/nchs/nhanes/default.aspx), which can be accessed by everyone through the links provided.
Competing Interests
The authors have declared that no competing interest exists.
References
1. Kidney Disease. Improving Global Outcomes (KDIGO) CKD Work Group. KDIGO 2024 Clinical Practice Guideline for the Evaluation and Management of Chronic Kidney Disease. Kidney Int. 2024;105:S117-s314
2. Huang R, Fu P, Ma L. Kidney fibrosis: from mechanisms to therapeutic medicines. Signal transduction and targeted therapy. 2023;8:129
3. Wang L, Xu X, Zhang M, Hu C, Zhang X, Li C. et al. Prevalence of Chronic Kidney Disease in China: Results From the Sixth China Chronic Disease and Risk Factor Surveillance. JAMA Intern Med. 2023;183:298-310
4. Zhao X, Kwan JYY, Yip K, Liu PP, Liu FF. Targeting metabolic dysregulation for fibrosis therapy. Nature reviews Drug discovery. 2020;19:57-75
5. Brantsma AH, Bakker SJ, de Zeeuw D, de Jong PE, Gansevoort RT. Urinary albumin excretion as a predictor of the development of hypertension in the general population. J Am Soc Nephrol. 2006;17:331-5
6. Kestenbaum B, Rudser KD, de Boer IH, Peralta CA, Fried LF, Shlipak MG. et al. Differences in kidney function and incident hypertension: the multi-ethnic study of atherosclerosis. Ann Intern Med. 2008;148:501-8
7. Muntner P, Anderson A, Charleston J, Chen Z, Ford V, Makos G. et al. Hypertension awareness, treatment, and control in adults with CKD: results from the Chronic Renal Insufficiency Cohort (CRIC) Study. Am J Kidney Dis. 2010;55:441-51
8. Cheung AK, Rahman M, Reboussin DM, Craven TE, Greene T, Kimmel PL. et al. Effects of Intensive BP Control in CKD. J Am Soc Nephrol. 2017;28:2812-23
9. Muntner P, Carey RM, Gidding S, Jones DW, Taler SJ, Wright JT Jr. et al. Potential U.S. Population Impact of the 2017 ACC/AHA High Blood Pressure Guideline. J Am Coll Cardiol. 2018;71:109-18
10. Lee JY, Park JT, Joo YS, Lee C, Yun HR, Yoo TH. et al. Association of Blood Pressure With the Progression of CKD: Findings From KNOW-CKD Study. Am J Kidney Dis. 2021;78:236-45
11. Saxena A, Sachan T, Gupta A, Kapoor V. Effect of Dietary Phosphorous Restriction on Fibroblast Growth 2 Factor-23 and sKlotho Levels in Patients with Stages 1-2 Chronic Kidney Disease. Nutrients. 2022;14:3302
12. Hruska KA, Mathew S, Lund R, Qiu P, Pratt R. Hyperphosphatemia of chronic kidney disease. Kidney Int. 2008;74:148-57
13. Sarakpi T, Mesic A, Speer T. Leukocyte-endothelial interaction in CKD. Clinical kidney journal. 2023;16:1845-60
14. Shang F, Wang SC, Hsu CY, Miao Y, Martin M, Yin Y. et al. MicroRNA-92a Mediates Endothelial Dysfunction in CKD. J Am Soc Nephrol. 2017;28:3251-61
15. Gansevoort RT, Correa-Rotter R, Hemmelgarn BR, Jafar TH, Heerspink HJ, Mann JF. et al. Chronic kidney disease and cardiovascular risk: epidemiology, mechanisms, and prevention. Lancet. 2013;382:339-52
16. Muntner P, Hardy ST, Fine LJ, Jaeger BC, Wozniak G, Levitan EB. et al. Trends in Blood Pressure Control Among US Adults With Hypertension, 1999-2000 to 2017-2018. JAMA. 2020;324:1190-1200
17. Levey AS, Stevens LA, Schmid CH, Zhang YL, Castro AF 3rd, Feldman HI. et al. A new equation to estimate glomerular filtration rate. Ann Intern Med. 2009;150:604-12
18. Levey AS, Coresh J, Greene T, Stevens LA, Zhang YL, Hendriksen S. et al. Using standardized serum creatinine values in the modification of diet in renal disease study equation for estimating glomerular filtration rate. Ann Intern Med. 2006;145:247-54
19. Centers for Disease Control and Prevention. National Center for Health Statistics (NCHS). National Health and Nutrition Examination Survey. NHANES. https://wwwncdcgov/nchs/nhanes/continuousnhanes/manualsaspx?BeginYear=2005. Accessed 10 July. 2023
20. Chobanian AV, Bakris GL, Black HR, Cushman WC, Green LA, Izzo JL Jr. et al. The Seventh Report of the Joint National Committee on Prevention, Detection, Evaluation, and Treatment of High Blood Pressure: the JNC 7 report. JAMA. 2003;289:2560-72
21. Becker GJ, Wheeler DC, Zeeuw DD, Fujita T, Furth SL, Holdaas H. et al. Kidney disease: Improving global outcomes (KDIGO) blood pressure work group. KDIGO clinical practice guideline for the management of blood pressure in chronic kidney disease. Kidney int Suppl. 2012;2:337-414
22. Whelton PK, Carey RM, Aronow WS, Casey DE Jr, Collins KJ, Dennison Himmelfarb C. et al. 2017 ACC/AHA/AAPA/ABC/ACPM/AGS/APhA/ASH/ASPC/NMA/PCNA Guideline for the Prevention, Detection, Evaluation, and Management of High Blood Pressure in Adults: A Report of the American College of Cardiology/American Heart Association Task Force on Clinical Practice Guidelines. J Am Coll Cardiol. 2018;71:e127-e248
23. James PA, Oparil S, Carter BL, Cushman WC, Dennison-Himmelfarb C, Handler J. et al. 2014 evidence-based guideline for the management of high blood pressure in adults: report from the panel members appointed to the Eighth Joint National Committee (JNC 8). JAMA. 2014;311:507-20
24. Fox CS, Muntner P. Trends in diabetes, high cholesterol, and hypertension in chronic kidney disease among U.S. adults: 1988-1994 to 1999-2004. Diabetes care. 2008;31:1337-42
25. Lo R, Narasaki Y, Lei S, Rhee CM. Management of traditional risk factors for the development and progression of chronic kidney disease. Clinical kidney journal. 2023;16:1737-50
26. Whaley-Connell AT, Sowers JR, Stevens LA, McFarlane SI, Shlipak MG, Norris KC. et al. CKD in the United States: Kidney Early Evaluation Program (KEEP) and National Health and Nutrition Examination Survey (NHANES) 1999-2004. Am J Kidney Dis. 2008;51:S13-20
27. Blazek K, van Zwieten A, Saglimbene V, Teixeira-Pinto A. A practical guide to multiple imputation of missing data in nephrology. Kidney Int. 2021;99:68-74
28. Gosselink ME, van Buren MC, Kooiman J, Groen H, Ganzevoort W, van Hamersvelt HW. et al. A nationwide Dutch cohort study shows relatively good pregnancy outcomes after kidney transplantation and finds risk factors for adverse outcomes. Kidney Int. 2022;102:866-75
29. Fryar CD, Ostchega Y, Hales CM, Zhang G, Kruszon-Moran D. Hypertension Prevalence and Control Among Adults: United States, 2015-2016. NCHS data brief. 2017(289):1-8
30. Group AS, Cushman WC, Evans GW, Byington RP, Goff DC Jr, Grimm RH Jr. et al. Effects of intensive blood-pressure control in type 2 diabetes mellitus. N Engl J Med. 2010;362:1575-85
31. Kidney Disease. Improving Global Outcomes (KDIGO) Blood Pressure Work Group. KDIGO 2021 Clinical Practice Guideline for the Management of Blood Pressure in Chronic Kidney Disease. Kidney Int. 2021;99:S1-S87
32. Buhnerkempe MG, Botchway A, Prakash V, Al-Akchar M, Nolasco Morales CE, Calhoun DA. et al. Prevalence of refractory hypertension in the United States from 1999 to 2014. J Hypertens. 2019;37:1797-804
33. Sarafidis PA, Li S, Chen SC, Collins AJ, Brown WW, Klag MJ. et al. Hypertension awareness, treatment, and control in chronic kidney disease. Am J Med. 2008;121:332-40
34. Wang Y, Zhang L, Li X, Xu Y, Yang M, Qian J. et al. Improvement of awareness, treatment and control of hypertension among chronic kidney disease patients in China from 1999 to 2005. Hypertens Res. 2009;32:444-9
35. Kuhn A, van der Giet M, Kuhlmann MK, Martus P, Mielke N, Ebert N. et al. Kidney Function as Risk Factor and Predictor of Cardiovascular Outcomes and Mortality Among Older Adults. Am J Kidney Dis. 2021;77:386-96 e1
36. An D, Wang Y, Li Y, Zhu D. Urine albumin-to-creatinine ratio and asymptomatic intracranial atherosclerotic stenosis in hypertensive patients. J Hum Hypertens. 2019;33:482-8
37. Jian G, Lin W, Wang N, Wu J, Wu X. Urine Albumin/Creatinine Ratio and Microvascular Disease in Elderly Hypertensive Patients without Comorbidities. Biomed Res Int. 2021;2021:5560135
38. Brenner BM, Cooper ME, de Zeeuw D, Keane WF, Mitch WE, Parving HH. et al. Effects of losartan on renal and cardiovascular outcomes in patients with type 2 diabetes and nephropathy. N Engl J Med. 2001;345:861-9
39. Klahr S, Levey AS, Beck GJ, Caggiula AW, Hunsicker L, Kusek JW. et al. The effects of dietary protein restriction and blood-pressure control on the progression of chronic renal disease. Modification of Diet in Renal Disease Study Group. N Engl J Med. 1994;330:877-84
40. Wright JT Jr, Williamson JD, Whelton PK, Snyder JK, Sink KM, Rocco MV. et al. A Randomized Trial of Intensive versus Standard Blood-Pressure Control. N Engl J Med. 2015;373:2103-16
41. Cai G, Zheng Y, Sun X, Chen X, Survey of Prevalence A, Treatment Rates in Chronic Kidney Disease Patients with Hypertension in China Collaborative G. Prevalence, awareness, treatment, and control of hypertension in elderly adults with chronic kidney disease: results from the survey of Prevalence, Awareness, and Treatment Rates in Chronic Kidney Disease Patients with Hypertension in China. J Am Geriatr Soc. 2013;61:2160-7
42. Gannon MP, Wu E, McMahon GM, Aaron S, Bates DW, Waikar S. et al. Uncontrolled blood pressure and treatment of hypertension in older chronic kidney disease patients. J Am Geriatr Soc. 2021;69:2985-7
43. Williamson JD, Supiano MA, Applegate WB, Berlowitz DR, Campbell RC, Chertow GM. et al. Intensive vs Standard Blood Pressure Control and Cardiovascular Disease Outcomes in Adults Aged ≥75 Years: A Randomized Clinical Trial. JAMA. 2016;315:2673-82
44. Yan AF, Williams MY, Shi Z, Oyekan R, Yoon C, Bowen R. et al. Bias and Accuracy of Glomerular Filtration Rate Estimating Equations in the US: A Systematic Review and Meta-Analysis. JAMA network open. 2024;7:e241127
45. Baxmann AC, Ahmed MS, Marques NC, Menon VB, Pereira AB, Kirsztajn GM. et al. Influence of muscle mass and physical activity on serum and urinary creatinine and serum cystatin C. Clin J Am Soc Nephrol. 2008;3:348-54
46. De Rosa S, Samoni S, Ronco C. Creatinine-based definitions: from baseline creatinine to serum creatinine adjustment in intensive care. Critical care (London, England). 2016;20:69
47. Iacomelli I, Giordano A, Rivasi G, Rafanelli M, Tortù V, Cartei A. et al. Low Creatinine Potentially Overestimates Glomerular Filtration Rate in Older Fracture Patients: A Plea for an Extensive Use of Cystatin C? European journal of internal medicine. 2021;84:74-9
48. Kimmel M, Braun N, Alscher MD. Influence of thyroid function on different kidney function tests. Kidney & blood pressure research. 2012;35:9-17
49. Delanghe JR, Cobbaert C, Harmoinen A, Jansen R, Laitinen P, Panteghini M. Focusing on the clinical impact of standardization of creatinine measurements: a report by the EFCC Working Group on Creatinine Standardization. Clinical chemistry and laboratory medicine. 2011;49:977-82
50. Waikar SS, Bonventre JV. Creatinine kinetics and the definition of acute kidney injury. J Am Soc Nephrol. 2009;20:672-9
51. Peake M, Whiting M. Measurement of serum creatinine-current status and future goals. The Clinical biochemist Reviews. 2006;27:173-84
52. Walser M. Assessing renal function from creatinine measurements in adults with chronic renal failure. Am J Kidney Dis. 1998;32:23-31
53. Kamper AL, Strandgaard S. Long-Term Effects of High-Protein Diets on Renal Function. Annual review of nutrition. 2017;37:347-69
54. Vukovic V, Hantikainen E, Raftopoulou A, Gögele M, Rainer J, Domingues FS. et al. Association of dietary proteins with serum creatinine and estimated glomerular filtration rate in a general population sample: the CHRIS study. Journal of nephrology. 2023;36:103-14
55. Asnani MR, Lynch O, Reid ME. Determining glomerular filtration rate in homozygous sickle cell disease: utility of serum creatinine based estimating equations. PloS one. 2013;8:e69922
56. Drieling RL, LaCroix AZ, Beresford SA, Boudreau DM, Kooperberg C, Heckbert SR. Validity of Self-Reported Medication Use Compared With Pharmacy Records in a Cohort of Older Women: Findings From the Women's Health Initiative. American journal of epidemiology. 2016;184:233-8
57. Hafferty JD, Campbell AI, Navrady LB, Adams MJ, MacIntyre D, Lawrie SM. et al. Self-reported medication use validated through record linkage to national prescribing data. Journal of clinical epidemiology. 2018;94:132-42
Author contact
![]() Corresponding authors: Fanghua Li, Department of Nephrology, The First Affiliated Hospital of Zhengzhou University, Zhengzhou, 450052, Henan, China. Tel.: +86 15225091887; E-mail: lifanghua073851com. Yanhong Liao, Department of Anatomy, Tongji Medical College, Huazhong University of Science and Technology, Wuhan, 430030, Hubei, China. Tel.: +86 15972223955; E-mail: yhliao1edu.cn.
Corresponding authors: Fanghua Li, Department of Nephrology, The First Affiliated Hospital of Zhengzhou University, Zhengzhou, 450052, Henan, China. Tel.: +86 15225091887; E-mail: lifanghua073851com. Yanhong Liao, Department of Anatomy, Tongji Medical College, Huazhong University of Science and Technology, Wuhan, 430030, Hubei, China. Tel.: +86 15972223955; E-mail: yhliao1edu.cn.