Impact Factor ISSN: 1449-1907
- Issue 9; 2026
- Issue 8; 2026
- Issue 7; 2026
- Issue 6; 2026
- Issue 5; 2026
- Volume 23; 2026
- Past Issues
- Editorial Board
- Cover Images
- Index & Coverage
- Cover Suggestion
- Special Issues
Introduction
Materials and Methods
Results
Discussion
Conclusions
Supplementary Material
Acknowledgements
References

 Global reach, higher impact
Int J Med Sci 2024; 21(14):2694-2704. doi:10.7150/ijms.98724 This issue Cite
Research Paper
The RAAS system SNPs polymorphism is associated with essential hypertension risk in rural areas in northern China
Jin Cheng1,2,3,4*, Jing Cui1,2,3,4,5*, Yuanyuan Li1,2,3,4, Xiaona Liu1,2,3,4, Yuting Jiang1,2,3,4, Qiaoling Liu1,2,3,4, Chang Liu1,2,3,4, Hongqi Feng1,2,3, Zhe Jiao1,2,3, Xinhua Shao1,2,3, Yanhui Gao1,2,3,4 ![]() , Dianjun Sun1,2,3,4,6
, Dianjun Sun1,2,3,4,6 ![]() , Wei Zhang1,2,3,4
, Wei Zhang1,2,3,4 ![]()
1. Center for Endemic Disease Control, Chinese Center for Disease Control and Prevention, Harbin Medical University, Harbin, People's Republic of China.
2. National Health Commission & Education Bureau of Heilongjiang Province, Key Laboratory of Etiology and Epidemiology, Harbin Medical University (23618504), Harbin, People's Republic of China.
3. Heilongjiang Provincial Key Laboratory of Trace Elements and Human Health, Harbin Medical University, Harbin, People's Republic of China.
4. Center for Chronic Disease Prevention and Control, Harbin Medical University, Harbin, People's Republic of China.
5. Harbin Center for Disease Control and Prevention, Harbin, Heilongjiang, People's Republic of China.
6. State Key Laboratory of Frigid Zone Cardiovascular Diseases (SKLFZCD), Harbin Medical University, Harbin, People's Republic of China.
*These authors contributed equally to this paper.
Received 2024-5-21; Accepted 2024-9-19; Published 2024-10-14
Abstract

Objectives: Epidemiological evidence has shown that genetics and environment are associated with the risk of hypertension. However, the specific SNP effects of a cluster of crucial genes in the RAAS system on the risk of hypertension are unclear.
Methods: A case-control study was performed on the baseline participants of Environment and Chronic Disease in Rural Areas of Heilongjiang China (ECDRAHC) study. According to the inclusion and exclusion criteria, 757 subjects (428 hypertensive patients) were enrolled. A total of 32 SNP sites and related haplotypes, involved in AGT (angiotensinogen), ACE (angiotensin-converting enzyme), AGTR1, CYP11B2 (aldosterone-synthase), LDLR (low-density lipoprotein receptor), LRP5 (low-density lipoprotein receptor associated protein 5), LRP6 (low-density lipoprotein receptor associated protein 6), PPARG (peroxisome proliferator-activated receptor gamma) and ACE2 (angiotensin-converting enzyme 2) genes which exert important roles in renin-angiotensin-aldosterone system (RAAS) system were analyzed. Furthermore, a polygenic scoring model was established to assess individual risk of developing hypertension based on the comprehensive SNPs effects in genes related the RAAS system.
Results: After controlling the impact of confounding factors, multivariate logistic regression analysis revealed that the distribution of AGT/rs5046, LRP6/rs12823243 and ACE2/rs2285666 was associated with susceptibility to essential hypertension. In genetic score model, the score > -0.225 had a higher risk, the OR (95%CI) was 1.229 (1.110, 1.362).
Conclusions: To the best of our knowledge, this is the first time a hypertension risk scoring model on RAAS associated gene cluster has been constructed, which will provide a novel approach for prevention and control of essential hypertension.
Keywords: Hypertension, RAAS system, SNP, Gene score
Introduction
Hypertension, referred to as a silent killer, is recognized as the leading modifiable risk factor for the global burden of cardiovascular diseases (CVD), characterized by high incidence rate, high disability rate and high mortality [1]. As reported in The Lancet by the NCD Risk Factor Collaboration (NCD-RFC), the global number of hypertensive patients exceeded one billion in 2019, which represents a doubling since 1990. Furthermore, hypertension was directly responsible for 10.8 million fatalities [2-4]. A recent comprehensive population survey revealed that around 245 million Chinese adults suffer from hypertension in 2019 [5,6]. In addition, there are significant differences in the epidemiological distribution of hypertension in different regions of China, and the prevalence rate is higher in northeast China [7, 8].
Hypertension is a complex multi-system disease, associated with genetics and environment, involving the kidney, cardiovascular system and central nervous system. The prevalence of hypertension increased in correlation with higher BMI and older age, as well as variables like salt consumption, excessive alcohol use, and other recognized risk factors, including experience of cold exposure [9-14]. Individuals with lower levels of education or residing in rural areas appeared increased susceptibility as a consequence of an unhealthy lifestyle with a high-sodium diet and insufficient heating in winter [15, 16].
Accumulating evidence demonstrates over 1,477 SNPs associated with blood pressure [17-21], and the RAAS system is predominantly involved [22]. The RAAS system is an important regulatory system for maintaining stable blood pressure, mainly including REN (renin), ACE, AGT, CYP11B2, ACE2 [23-25]. In classic RAAS system, AGT is associated with the generation of angiotensin II (Ang II), Ang II activates its Angiotensin II type 1 (AT1) receptor, the main receptor mediating vasoconstriction, aldosterone secretion, and renal sodium (Na+) re-absorption, which increased blood pressure and promoted the development of hypertension [26,27]. ACE, in addition to its potent constrictive effect on blood vessels, also promotes aldosterone secretion [28]. Some studies have reported that receptors related to the RAAS system are involved in blood pressure regulation, such as trans-membrane proteins LDLR, LRP5, and LRP6 [29]. ACE2 protects against excessive activation of AT1 in the heart tissues. Additionally, renal ACE2 was down-regulated in three different models of hypertension [30,31]. Although the SNP does not directly alter the coding sequence, it possibly influences the gene function by disrupting the transcription activity of genes. Studies generally concentrate on the impact of the SNP in individual gene or nearby genes associated with RAAS system on the pathogenesis of hypertension, and the complete effects of the SNPs on a cluster gene in the RAAS system are uncertain [26-31].
Heilongjiang province is located in the remote northeastern region of China and is renowned for its extended and frigid winters, with average outdoor temperature dropping below -14°C in the winter. The prevalence rate of essential hypertension (EH) in Heilongjiang is remarkably higher than the national average level. The purpose of this study is to investigate the association between the different SNPs of a cluster of genes in RAAS system and hypertension, based on ECDRAHC cohort study [32,33]. Furthermore, we evaluate each individual risk of developing hypertension by calculating a polygenic score based on the comprehensive impacts of a cluster gene linked to the RAAS system. Deciphering these associations may help in identifying effective strategies for preventing and managing hypertension in chilly regions of China.
Materials and Methods
Study design and participants
The ECDRAHC is a prospective cohort study on the environment and chronic disease in rural areas of Heilongjiang, China, covering nine regions of Ming shui County [34]. The baseline survey of the ECDRAHC cohort was conducted from November 2018 to September 2019. The research participants were selected from a total of 1682 adults, aged, who were Han nationality and residing in Tongda Town. ① Case group: the subjects were included based on 2018 Chinese Guidelines for the Prevention and Treatment of Hypertension. We selected only one patient among the survey subjects who suffered from hypertension in first-step relatives. ② Control group: subjects with blood pressure levels<140/90 mmHg [systolic blood pressure < 140 mmHg and/or diastolic blood pressure < 90 mmHg, (HBP, systolic blood pressure ≥140 mmHg and/or diastolic blood pressure ≥90 mmHg)] [35]. Based on the above inclusion criteria and exclusion criteria (details of exclusion criteria are showed in the Supplement), 757 subjects were divided into two groups.
For assessment of environmental factors, data were collected from the questionnaires, physical measurements and laboratory testing of blood samples. Physicians utilize internationally standardized electronic blood pressure monitors to measure blood pressure accurately. A total of 25 biochemical indicators, including ALP, ALT, AST, GGT, CREA, GLU, TCH, etc., were measured using the Hitachi 3100 automatic biochemical analyzer (More details of criterion for the environmental factors and biochemical measures are showed in Table S1).
The blood samples were collected by medical professionals according to strict aseptic procedures. Approximately 5 mL of fasting (over 8 hours) peripheral venous blood of the subjects was put into vacuum collection tubes with ethylene diamine tetraacetic acid (EDTA) anticoagulants and regular vacuum collection tubes, respectively. Serum samples were separated and centrifuged at 3000 r/min for 10 min after a little standing. The blood samples were stored at -20℃ on site after being divided, and stored in the -80℃ refrigerator when they were returned to the laboratory on the same day.
Analysis of genotype
Through reviewing the literatures on RAAS system gene polymorphisms and cardiovascular diseases, specific SNP loci were chosen. Next, the SNP loci were evaluated by Genesky Biotechnologies Inc., Shanghai, including region (gene region), population (Han Chinese in Beijing or Southern Han Chinese), minor allele frequency (if >0.01) and R2 (if >0.8) of linkage disequilibrium analysis. Eventually, 34 eligible SNPs (including ACE2) were included in the analysis. The TIANamp Blood DNA Kit was used to extract human genomic DNA, and all DNA samples were store at -80℃. The genotyping was detected by the multiple SNP typing kit (Genesky, Shanghai, China), and the analyses were entrusted to Genesky laboratory. STREGA quality criteria: the concentration of DNA samples should be above 10 ng/μL, the total amounts of DNA should be greater than 200 ng, the absorbance ratio (A260/A280) should be greater than 1.80, and genomic banding should be complete and clear without any degradation. Primers were designed and aligned using primer 5 software and referring to NCBI online primer design tool (primer-blast, http://www.ncbi.nlm.nih.gov/tools/primer-blast) and NCBI-Basic Local Alignment Search Tool.
Statistical analysis
All statistical analyses were conducted using IBM SPSS Statistics 25.0 (Chicago, IL, USA). If the data follows a normal distribution, the mean ± SD and N (%) represent continuous variables and categorical variables, respectively. If the data does not conform to a normal distribution, median (IQR) is used to describe the data distribution. Differences in demographic and biochemical characteristics were analyzed using chi-square test, student's test for categorical and continuous variables, respectively. Chi-square test was employed to explore whether the SNP sites of the control samples were consistent with Hardy-Weinberg Equilibrium (HWE). Chi-square test and Fisher exact probability method were applied to explore the difference in allele frequency and genotype frequency in SNP sites for each target gene. Logistic regression analysis was conducted to investigate the association of gene polymorphism and possible impact factors with hypertension. Haploview software (ver 4.2) was employed to analyze linkage disequilibrium (LD) and haplotype construction, with adjacent sites R2 (>0.3) and D' (>0.8) as the judgement standards for linkage disequilibrium. P<0.05 was considered statistically significant.
Genetic Score (or Allele Score)
Genetic Score is a valid causal estimate of the overall effects of multiple genetic variants on a multifactorial disease. In this investigation all gene loci were taken into account to calculate a weighted gene score for each subject, with reference to some excellent literature [36]. The weighted gene score is calculated by multiplying the number of mutant alleles at each SNP site by their respective weights, and then summing these products. The formula for calculating the weighted gene score is as follows:

In the above formula, “i” represents the number of SNPs that constitute the weighted gene score; “W” is the weight corresponding to each SNP site (the weight of the SNP site is the regression coefficient β of each SNP site calculated by logistic regression analysis); “SNP” represents the number of minor alleles in each SNP site, denoted by unweighted scores: “0, 1, 2” (For example, genotype AA = 0, Aa = 1, aa = 2).
Results
Demographic characteristics and serum index results
A total of 428 participants (223 women) were essential hypertensive patients, and 329 subjects entered the control group according to the inclusion and exclusion criteria. The study found that individuals with essential hypertension were elderly and exhibited higher levels of BMI, ALP, GGT, CREA, GLU, TCH, TG, LDL, ApoA1, ApoB, and LDH (Table 1). Significant variations were observed in waist circumference, BMI, ALP, GLU, TG, LDL, ApoA1, ApoB, LDH and vegetables consumption among female hypertension participants (Table S2). In addition, the levels of waist circumference, ALP, CU exhibited a significant increase in male patients (Table S3).
Demographic characteristics and serum index determination for all subjects
| Characteristics | Control (n = 329) | Case (n = 428) | T /χ2 | P-value | |
|---|---|---|---|---|---|
| BP | |||||
| SBP, mean±SD (mmHg) | 122.56 ± 9.91 | 153.47 ± 17.56 | 62.010 | < 0.001 | |
| DBP, mean±SD (mmHg) | 80.02 ± 6.65 | 95.36 ± 10.99 | 33.350 | < 0.001 | |
| Sociodemographic factors | |||||
| Age, mean±SD (year) | 52.98 ± 8.73 | 57.90 ± 7.64 | 2.855 | < 0.001 | |
| Sex, N (%) | Female | 194 (58.97) | 223 (52.10) | 3.542 | 0.060 |
| Male | 135 (41.03) | 205 (47.90) | |||
| Marital status, N (%) | Unmarried | 22 (6.69) | 39 (9.11) | 1.477 | 0.224 |
| Married | 307 (93.31) | 389 (90.89) | |||
| Nine-year compulsory education, N (%) | Uncompleted | 290 (88.15) | 375 (87.62) | 0.049 | 0.825 |
| Completed | 39 (11.85) | 53 (12.38) | |||
| Lifestyle behaviors | |||||
| Current smoking, N (%) | No | 187 (56.84) | 263 (61.45) | 1.640 | 0.200 |
| Yes | 142 (43.16) | 165 (38.55) | |||
| Passive smoking, N (%) | No | 195 (59.27) | 244 (57.01) | 0.390 | 0.532 |
| Yes | 134 (40.73) | 184 (42.99) | |||
| Harmful drinking, N (%) | No | 264 (80.24) | 332 (77.57) | 0.794 | 0.373 |
| Yes | 65 (19.76) | 96 (22.43) | |||
| Physical exertion, N (%) | Light | 210 (63.83) | 263 (61.45) | 1.825 | 0.401 |
| Medium | 18 (5.47) | 34 (7.94) | |||
| Heavy | 101 (30.70) | 131 (30.61) | |||
| Exercise regularly, N (%) | No | 228 (69.30) | 297 (69.39) | 0.001 | 0.978 |
| Yes | 101 (30.70) | 131 (30.61) | |||
| Adiposity measures | |||||
| Waist, mean ± SD (cm) | 84.64 ± 8.45 | 88.85 ± 9.36 | 0.336 | < 0.001 | |
| Hip, mean ± SD (cm) | 97.23 ± 7.83 | 99.97 ± 7.89 | 0.054 | < 0.001 | |
| WHR, mean ± SD | 0.87 ± 0.11 | 0.89 ± 0.10 | 0.018 | 0.023 | |
| BMI, mean ± SD | 24.26 ± 2.89 | 25.62 ± 3.39 | 4.645 | < 0.001 | |
| Medical history | |||||
| Family history of Hypertension, N (%) | No | 267 (81.16) | 346 (80.84) | 0.012 | 0.913 |
| Yes | 62 (18.84) | 82 (19.16) | |||
| Family history of Diabetes, N (%) | No | 311 (94.53) | 413 (96.50) | 1.725 | 0.189 |
| Yes | 18 (5.47) | 15 (3.50) | |||
| Family history of Cardiovascular disease, N (%) | No | 309 (93.92) | 403 (94.16) | 0.019 | 0.891 |
| Yes | 20 (6.08) | 25 (5.84) | |||
| Clinical and biochemical measures | |||||
| ALP, mean±SD (U/L) | 79.99 ± 24.44 | 89.54 ± 29.44 | 5.834 | < 0.001 | |
| ALT, mean±SD (U/L) | 22.30 ± 16.29 | 23.23 ± 13.56 | 0.441 | 0.388 | |
| AST, mean±SD (U/L) | 24.39 ± 10.77 | 25.16 ± 13.52 | 0.797 | 0.395 | |
| AST/ALT, mean±SD | 1.25 ± 0.41 | 1.21 ± 0.44 | 0.005 | 0.137 | |
| GGT, mean±SD (U/L) | 30.43 ± 30.59 | 41.91 ± 62.50 | 9.786 | < 0.001 | |
| CREA, mean±SD (μmol/L) | 58.28 ± 14.71 | 63.87 ± 44.96 | 5.157 | 0.016 | |
| GLU, mean±SD (mmol/L) | 5.19 ± 1.65 | 5.49 ± 1.36 | 1.116 | 0.006 | |
| TCH, mean±SD (mmol/L) | 5.53 ± 1.10 | 5.92 ± 1.41 | 7.260 | < 0.001 | |
| TG, mean±SD (mmol/L) | 1.53 ± 0.89 | 1.89 ± 1.52 | 2.968 | < 0.001 | |
| LDL, mean±SD (mmol/L) | 3.28 ± 0.85 | 3.57 ± 1.03 | 9.859 | < 0.001 | |
| HDL, mean±SD (mmol/L) | 1.61 ± 0.38 | 1.61 ± 0.43 | 1.964 | 0.848 | |
| ApoA1, mean±SD (g/L) | 1.40 ± 0.32 | 1.47 ± 0.41 | 16.020 | 0.003 | |
| ApoB, mean±SD (g/L) | 0.87 ± 0.22 | 0.98 ± 0.28 | 16.122 | < 0.001 | |
| NEFA, mean±SD (mmol/L) | 0.47 ± 0.27 | 0.50 ± 0.29 | 4.009 | 0.082 | |
| Lp(a), mean±SD (mmol/L) | 150.66 ± 161.53 | 162.86 ± 158.78 | 1.050 | 0.300 | |
| ACE, mean±SD (U/L) | 43.01 ± 18.69 | 41.94 ± 19.14 | 0.000 | 0.441 | |
| HCY, mean±SD (μmol/L) | 13.27 ± 8.69 | 14.55 ± 10.29 | 2.858 | 0.070 | |
| UA, mean±SD (μmol/L) | 313.95 ± 96.65 | 339.13 ± 105.57 | 0.082 | < 0.001 | |
| P, mean±SD (mmol/L) | 1.10 ± 0.22 | 1.09 ± 0.23 | 0.124 | 0.591 | |
| ZN, mean±SD (μmol/L) | 10.20 ± 2.10 | 10.44 ± 2.25 | 1.164 | 0.149 | |
| MG, mean±SD (mmol/L) | 1.05 ± 0.18 | 1.07 ± 0.18 | 0.947 | 0.108 | |
| CA, mean±SD (mmol/L) | 2.42 ± 0.35 | 2.46 ± 0.35 | 0.910 | 0.055 | |
| CU, mean±SD (μmol/L) | 18.28 ± 3.58 | 19.13 ± 3.48 | 0.312 | 0.001 | |
| FE, mean±SD (μmol/L) | 19.06 ± 7.34 | 19.75 ± 7.77 | 1.028 | 0.211 | |
| LDH, mean±SD (U/L) | 183.14 ± 43.85 | 190.75 ± 45.84 | 0.002 | 0.021 | |
| Regular consumption of certain foodstuffs | |||||
| Rice, N (%) | No | 34 (10.33) | 50 (11.68) | 0.343 | 0.558 |
| Yes | 295 (89.67) | 378 (88.32) | |||
| Wheat, N (%) | No | 25 (7.60) | 38 (8.88) | 0.399 | 0.527 |
| Yes | 304 (92.40) | 390 (91.12) | |||
| Corn, N (%) | No | 250 (75.99) | 325 (75.93) | 0.000 | 0.986 |
| Yes | 79 (24.01) | 103 (24.07) | |||
| Meat, N (%) | No | 218 (66.26) | 287 (67.06) | 0.053 | 0.818 |
| Yes | 111 (33.74) | 141 (32.94) | |||
| Poultry, N (%) | No | 319 (96.96) | 418 (97.66) | 0.357 | 0.550 |
| Yes | 10 (3.04) | 10 (2.34) | |||
| Fish, N (%) | No | 314 (95.44) | 417 (97.43) | 2.219 | 0.136 |
| Yes | 14 (4.26) | 11 (2.57) | |||
| Egg, N (%) | No | 196 (59.57) | 268 (62.62) | 0.726 | 0.394 |
| Yes | 133 (40.43) | 160 (37.38) | |||
| Vegetable, N (%) | No | 51 (15.50) | 48 (11.21) | 3.007 | 0.083 |
| Yes | 278 (84.50) | 380 (88.79) | |||
| Soya, N (%) | No | 257 (78.12) | 338 (78.97) | 0.081 | 0.776 |
| Yes | 72 (21.88) | 90 (21.03) | |||
| Pickled, N (%) | No | 130 (39.51) | 166 (38.79) | 0.041 | 0.839 |
| Yes | 199 (60.49) | 262 (61.21) | |||
| Fruit, N (%) | No | 167 (50.76) | 233 (54.44) | 1.011 | 0.315 |
| Yes | 162 (49.24) | 195 (45.56) | |||
| Dairy, N (%) | No | 301 (91.49) | 400 (93.46) | 1.052 | 0.305 |
| Yes | 28 (8.51) | 28 (6.54) | |||
| Spicy, N (%) | No | 245 (74.47) | 312 (72.90) | 0.236 | 0.627 |
| Yes | 84 (25.53) | 116 (27.10) | |||
| Supply, N (%) | No | 277 (84.19) | 343 (80.14) | 2.063 | 0.151 |
| Yes | 52 (15.81) | 85 (19.86) | |||
| Average monthly consumption of edible oil, mean±SD (500g/month) | 2.57 ± 1.58 | 2.43 ± 1.54 | 0.787 | 0.237 | |
| Monthly average salt consumption, mean±SD (g/month) | 161.71 ± 89.05 | 167.89 ± 81.97 | 5.304 | 0.328 | |
K-S test the normality of continuous variables, and all continuous variables meet the normal distribution, continuous variable showed in mean ± SD using t-test; categorical variable showed in N (%), using Chi-square test.
Risk factors for essential hypertension
The collinearity diagnosis indicated that there was no collinearity between various risk factors for all subjects (Table S4). According to the standard of P < 0.1, thirteen risk factors were screened, including age, waist circumference, BMI, ALP, CREA, GLU, TG, LDL, ApoA1, ApoB, UA, CA and CU (Table 2). With the exception of CREA, there were significant differences among female hypertensive patients in term of age, waist circumference, BMI, ALP, GLU, TG, LDL, ApoA1, ApoB, UA, CA and CU (p < 0.05). However, only levels of waist circumference, ALP and CU increased significantly in male patients (p < 0.05). (Table S5, Table S6).
Risk factors for essential hypertension in all subjects
| Characteristics | Control (n = 329) Mean ± SD | Case (n = 428) Mean ± SD | OR | 95%CI | p |
|---|---|---|---|---|---|
| Age (year) | 52.98 ± 8.73 | 57.90 ± 7.64 | 1.076 | (1.056, 1.097) | < 0.001 |
| Waist (cm) | 84.64 ± 8.45 | 88.85 ± 9.36 | 1.055 | (1.037, 1.073) | < 0.001 |
| BMI (kg/m2) | 24.26 ± 2.89 | 25.62 ± 3.39 | 1.149 | (1.094, 1.206) | < 0.001 |
| ALP (U/L) | 79.99 ± 24.44 | 89.54 ± 29.44 | 1.013 | (1.008, 1.019) | < 0.001 |
| CREA (μmol/L) | 58.28 ± 14.71 | 63.87 ± 44.96 | 1.009 | (1.001, 1.018) | 0.032 |
| GLU (mmol/L) | 5.19 ± 1.65 | 5.49 ± 1.36 | 1.202 | (1.051, 1.374) | 0.007 |
| TG (mmol/L) | 1.53 ± 0.89 | 1.89 ± 1.52 | 1.454 | (1.226, 1.723) | < 0.001 |
| LDL (mmol/L) | 3.28 ± 0.85 | 3.57 ± 1.03 | 1.401 | (1.194, 1.644) | < 0.001 |
| ApoA1 (g/L) | 1.40 ± 0.32 | 1.47 ± 0.41 | 1.789 | (1.198, 2.672) | 0.004 |
| ApoB (g/L) | 0.87 ± 0.22 | 0.98 ± 0.28 | 5.408 | (2.936, 9.962) | < 0.001 |
| UA (μmol/L) | 313.95 ± 96.65 | 339.13 ± 105.57 | 1.003 | (1.001, 1.004) | < 0.001 |
| CA (mmol/L) | 2.42 ± 0.35 | 2.46 ± 0.35 | 1.498 | (0.987, 2.273) | 0.058 |
| CU (μmol/L) | 18.28 ± 3.58 | 19.13 ± 3.48 | 1.072 | (1.028, 1.118) | 0.001 |
Hardy-Weinberg equilibrium test
We explored 32 SNP polymorphic sites (except ACE2) in the present study, including AGT (rs699, rs2493134, rs2004776, rs2148582, rs5046, rs3789679), ACE (rs4316, rs4343, rs4461142), AGTR1 (rs5182, rs1492100, rs5186, rs275646, rs2933249, rs2638360), CYP11B2(rs6433, rs3802228, rs1799998), LDLR/rs688, LRP5 (rs638051, rs556442), LRP6 (rs10743980, rs11054731, rs2417086, rs7136900, rs12823243), PPARG (rs3856806, rs1175543, rs2972164, rs13433696, rs9817428, rs12631819), all sites passed the H-W test (p > 0.05), and had MAF greater than 5%. Due to the distribution of the ACE2 gene on the X chromosome, only the analysis for female populations in the controls was performed. See more details in Table S7.
Comparison of the allele frequency distribution in the case and control group
The differences in allele frequency distribution of LRP5/rs638051 and PPARG/rs3856806 are statistically significant between the case and control group (p < 0.05). However, no obvious difference was observed in the distribution of other loci (p > 0.05). See more details in Table S8.
Distribution and risk assessment of EH for each genotype
After controlling for the impact of 13 risk factors listed in Table 2, we analyzed the association between the genotypes of 32 SNP polymorphic sites and hypertension. The logistic regression results showed that the distribution of the AGT/rs5046 codominant genetic model, LRP6/rs12823243 codominant genetic model, and recessive genetic model were statistically different between the cases and controls (p < 0.05). The distribution of AGT/rs5046 and LRP6/rs12823243 was statistically different between the cases and controls (p < 0.05), and OR (95% CI) was [5.49 (1.08, 27.97), genotype AA] and [0.01 (0.01, 0.30), genotype TT], respectively. The results of AGT and LPR6 are shown in Table 3, and other sites are shown in Table S9.
Distribution and risk assessment of EH for each genotype (AGT, LPR6, PPARG)
| SNP | loci | Genetic model | Control N (%) | Case N (%) | χ2 | p1 | OR (95CI) | p2 | padj | |
|---|---|---|---|---|---|---|---|---|---|---|
| AGT | rs5046 | codominant | GG | 236 (71.7) | 311 (72.7) | 3.98 | 0.14 | |||
| GA | 89 (27.1) | 103 (24.0) | 1.17 (0.62,2.18) | 0.63 | 0.88 | |||||
| AA | 4 (1.2) | 14 (3.3) | 5.49 (1.08,27.97) | 0.04 | 0.88 | |||||
| dominant | GG | 236 (71.7) | 311 (72.7) | 0.78 | 0.81 | |||||
| GA+AA | 93 (28.3) | 117 (26.3) | 1.01 (0.70,10.41) | 0.98 | 0.96 | |||||
| recessive | GG+GA | 325 (98.8) | 414 (96.7) | 3.39 | 0.09 | |||||
| AA | 4 (1.2) | 14 (3.3) | 3.82 (1.08,13.50) | 0.07 | 0.71 | |||||
| overdominant | GG+AA | 240 (72.9) | 325 (76.0) | 0.88 | 0.36 | |||||
| GA | 89 (27.1) | 103 (24.0) | 0.88 (0.61,1.26) | 0.48 | 0.74 | |||||
| additive | GG | 236 (98.3) | 311 (96.1) | 3.12 | 0.09 | |||||
| AA | 4 (1.7) | 14 (3.9) | 3.47 (0.98,12.36) | 0.06 | 0.75 | |||||
| LRP6 | rs12823243 | codominant | AA | 177 (53.8) | 249 (58.2) | 3.05 | 0.23 | |||
| TA | 122 (37.1) | 153 (35.7) | 0.36 (0.11,1.17) | 0.09 | 0.88 | |||||
| TT | 30 (9.1) | 26 (6.1) | 0.01 (0.01,0.30) | 0.01 | 0.88 | |||||
| dominant | AA | 177 (53.8) | 249 (58.2) | 1.45 | 0.24 | |||||
| TA+TT | 152 (46.2) | 179 (41.8) | 0.78 (0.57,1.08) | 0.13 | 0.74 | |||||
| recessive | AA+TA | 299 (90.9) | 402 (93.9) | 2.52 | 0.12 | |||||
| TT | 30 (9.1) | 26 (6.1) | 0.54 (0.29,0.99) | 0.04 | 0.71 | |||||
| overdominant | AA+TT | 207 (62.9) | 275 (64.3) | 0.14 | 0.76 | |||||
| TA | 122 (37.1) | 153 (35.7) | 0.92 (0.66,1.28) | 0.63 | 0.86 | |||||
| additive | AA | 177 (85.5) | 249 (90.5) | 2.92 | ||||||
| TT | 30 (14.5) | 26 (9.5) | 0.53 (0.28,1.00) | 0.05 | 0.63 | |||||
| PPARG | rs3856806 | codominant | CC | 192 (58.4) | 282 (65.9) | 5.38 | 0.07 | |||
| CT | 118 (35.8) | 131 (30.6) | 0.79 (0.52,1.20) | 0.27 | 0.88 | |||||
| TT | 19 (5.8) | 15 (3.5) | 0.45 (0.10,2.09) | 0.13 | 0.88 | |||||
| dominant | CC | 192 (58.4) | 282 (65.9) | 4.51 | 0.03 | |||||
| CT+TT | 137 (41.6) | 146 (34.1) | 0.70 (0.51,0.97) | 0.03 | 0.74 | |||||
| recessive | CC+CT | 310 (94.2) | 413 (96.5) | 2.24 | 0.16 | |||||
| TT | 19 (5.8) | 15 (3.5) | 0.58 (0.27,1.23) | 0.16 | 0.82 | |||||
| overdominant | CC+TT | 211 (64.2) | 297 (69.4) | 2.33 | 0.14 | |||||
| CT | 118 (35.8) | 131 (30.6) | 0.77 (0.55,1.07) | 0.12 | 0.64 | |||||
| additive | CC | 192 (99.1) | 282 (99.5) | 3.09 | 0.10 | |||||
| TT | 19 (0.9) | 15 (0.5) | 0.52 (0.24,1.15) | 0.11 | 0.63 |
Chi-square test was used to analyze the distribution of genotypes between case and control(p1), multifactorial logistic regression (OR, p2) was used to analyze the influence of genotypes on disease, padj was adjusted by FDR-BH correction.
Comparison of the ACE2 gene allele frequency distribution and risk assessment of EH for each genotype
The genotype distribution of ACE2 SNP site between the EH case group and the control group is shown in Table 4. The multivariate logistic regression results showed that the genotype distribution of rs2285666 was statistically different between the cases and controls in males (p < 0.05). The OR (95%CI) of codominant genetic model was [1.70(1.02, 2.83), genotype CC], dominant genetic model was [1.69(1.05,2.71), genotype (CT+CC)], and recessive genetic model was [1.79(1.11,2.90), genotype CC]. Among females, the OR (95%CI) of rs2285666 codominant genetic model was [1.76(1.02, 3.03), genotype CT] and the dominant genetic model was 1.69(1.02, 2.80), genotype (CT+CC)]. These results were statistically significant (p < 0.05).
The result of differences in ACE2 genotype distribution divided by sex
| ACE2 | Genetic model | control | case | |||||||
|---|---|---|---|---|---|---|---|---|---|---|
| SNP | genotype | N (%) | N (%) | χ2 | p1 | OR (95CI) | P2 | padj | ||
| male | rs1978124 | codominant | CC | 134 (99.3) | 202(98.5) | 0.71 | 1 | |||
| TC | 0 (0.0) | 1 (0.5) | - | - | - | |||||
| TT | 1 (0.7) | 2 (1.0) | 1.45 (0.11,18.55) | 0.77 | 0.99 | |||||
| dominant | CC | 134 (99.3) | 202 (98.5) | 0.37 | 0.65 | |||||
| TC+TT | 1 (0.7) | 3 (1.5) | 1.91 (0.18,20.91) | 0.60 | 0.99 | |||||
| recessive | CC+TC | 134 (99.3) | 203 (99.0) | 0.05 | 1 | |||||
| TT | 1 (0.7) | 2 (1.0) | 1.45 (0.11,18.51) | 0.78 | 0.99 | |||||
| overdominant | CC+TT | 135 (100.0) | 204 (99.5) | 0.66 | 1 | |||||
| TC | 0 (0.0) | 1 (0.5) | - | - | - | |||||
| additive | CC | 134 (99.3) | 202 (99.0) | 0.05 | 1 | |||||
| TT | 1 (0.7) | 2 (1.0) | 1.07 (0.97,1.17) | 0.16 | 0.41 | |||||
| rs2285666 | codominant | TT | 78 (57.8) | 101 (49.3) | 3.65 | 0.17 | ||||
| CT | 11 (8.1) | 13 (6.3) | 1.04 (0.41,2.63) | 0.94 | 0.99 | |||||
| CC | 46 (34.1) | 91 (47.4) | 1.70 (1.02,2.83) | 0.04 | 0.12 | |||||
| dominant | TT | 78 (57.8) | 101(49.3) | 2.36 | 0.15 | |||||
| CT+CC | 57 (42.2) | 104 (50.7) | 1.69 (1.05,2.71) | 0.03 | 0.12 | |||||
| recessive | TT+CT | 89 (65.9) | 114 (55.6) | 3.60 | 0.07 | |||||
| CC | 46 (34.1) | 91 (44.4) | 1.79 (1.11,2.90) | 0.02 | 0.12 | |||||
| overdominant | TT+CC | 124 (91.9) | 192 (93.7) | 0.41 | 0.67 | |||||
| CT | 11 (8.1) | 13 (6.3) | 0.86 (0.35,2.08) | 0.73 | 0.99 | |||||
| additive | TT | 78 (62.9) | 101 (52.6) | 3.25 | 0.08 | |||||
| CC | 46 (37.1) | 91 (47.4) | 1.07 (0.97,1.18) | 0.18 | 0.41 | |||||
| female | rs2285666 | codominant | TT | 74 (38.1) | 66 (29.6) | 4.53 | 0.10 | |||
| CT | 80 (41.2) | 114 (51.1) | 1.76 (1.02,3.03) | 0.04 | 0.12 | |||||
| CC | 40 (20.7) | 43 (19.3) | 1.36 (0.69,2.70) | 0.38 | 0.76 | |||||
| dominant | TT | 74 (38.1) | 66 (29.6) | 3.40 | 0.07 | |||||
| CT+CC | 120 (61.9) | 157 (70.4) | 1.69 (1.02,2.80) | 0.04 | 0.12 | |||||
| recessive | TT+CT | 154 (79.3) | 180 (80.7) | 0.12 | 0.81 | |||||
| CC | 40 (20.7) | 43 (19.3) | 0.96 (0.54,1.70) | 0.88 | 0.99 | |||||
| overdominant | TT+CC | 114 (58.8) | 109 (48.9) | 4.07 | 0.04 | |||||
| CT | 80 (41.2) | 114 (51.1) | 0.96 (0.54,1.70) | 0.88 | 0.99 | |||||
| additive | TT | 74 (64.9) | 66 (60.6) | 0.45 | 0.58 | |||||
| CC | 40 (35.1) | 43 (39.4) | 1.00 (0.90,1.11) | 0.97 | 0.99 |
Chi-square test was used to compare the distribution difference of alleles between the two groups, and N(%) was used to describe the data distribution. The p-value of Chi-square test was p1, that of multivariate logistic regression was p2. padj was adjusted by FDR-BH correction.
The gene haplotype construction and its association with EH
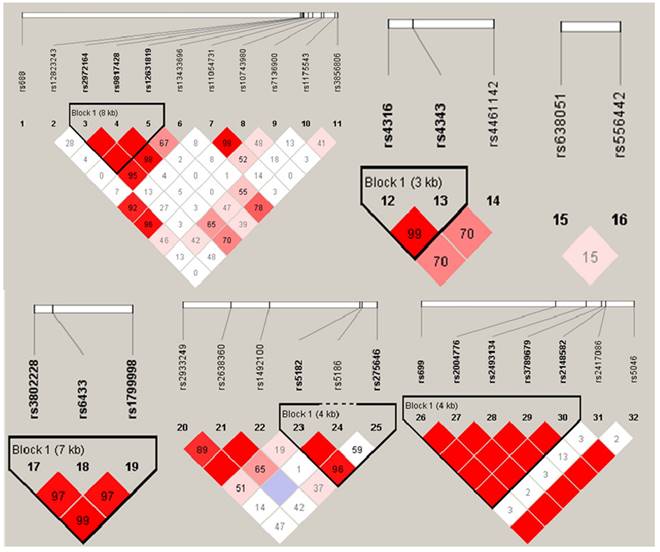
Haploview 4.2 software was utilized to construct haplotype and analyze the linkage disequilibrium (LD), the results were shown in Figure 1. D' value >0.8 was set as the criteria of strong linkage relationship. The results showed that seven haploid blocks were constructed in 32 SNP sites, and 25 haplotypes were taken as independent variable to analyze the correlation with hypertension. The results showed that none of the haplotype distribution was statistically different in EH case group and control group after controlling the influence of 13 impact factors as mentioned before (p > 0.05, Table 5).
Haplogroups and haplotype distribution maps.
The Results of haplotype difference analyses
| Block | loci | Type | Control (%) | Case (%) | OR (95%CI) | p |
|---|---|---|---|---|---|---|
| AGT | rs699 rs2004776 rs2493134 rs3789679 | GTCA | 49.5 | 38.3 | - | 0.64 |
| GCCG | 14.3 | 20.9 | 1.66 (0.67,4.12) | 0.28 | ||
| ACTG | 19.8 | 17.4 | 1.14(0.48,2.69) | 0.77 | ||
| GTCG | 16.5 | 23.5 | 1.56 (0.70,3.59) | 0.32 | ||
| ACE | rs4316 rs4343 | TA | 78.4 | 74.4 | - | - |
| CG | 21.6 | 25.6 | 1.19 (0.68,2.10) | 0.49 | ||
| AGTR1 | rs275646 rs2933249 rs1492100 | GAT | 94.9 | 94.5 | - | 0.94 |
| GAA | 1.1 | 0.8 | 1.69 (0.21,13.77) | 0.62 | ||
| AGT | 3.4 | 4.3 | 1.09 (0.35,3.37) | 0.88 | ||
| AAT | 0.6 | 0.4 | 1.71 (0.10,28.72) | 0.71 | ||
| AGTR1 | rs5182 rs5186 rs275646 | TAC | 98.4 | 94.4 | - | 0.42 |
| CAT | 1.0 | 2.4 | 2.58 (0.48,13.87) | 0.27 | ||
| CAC | 0.0 | 2.8 | - | 1 | ||
| CCC | 0.5 | 0.4 | 0.16 (0.01,2.80) | 0.21 | ||
| CYP11B2 | rs3802228 rs6433 rs1799998 | ATA | 65.0 | 67.5 | - | 0.95 |
| GTG | 25.8 | 24.0 | 0.93 (0.47,1.83) | 0.82 | ||
| ACA | 8.3 | 7.8 | 0.74 (0.24,2.29) | 0.60 | ||
| GTA | 0.8 | 7.8 | 1.62 (0.05,54.08) | 0.79 | ||
| LRP6 | rs11054731 rs10743980 | GC | 84.5 | 87.5 | - | 0.46 |
| AT | 14.4 | 11.6 | 0.71 (0.37,1.37) | 0.31 | ||
| AC | 1.1 | 0.9 | 0.46 (0.06,3.47) | 0.45 | ||
| PPARG | rs2972164 rs9817428 rs12631819 | CAT | 42.2 | 38.0 | - | 0.51 |
| CCG | 39.2 | 45.7 | 1.52 (0.81,3.12) | 0.18 | ||
| CAG | 15.7 | 13.2 | 0.94 (0.37,2.37) | 0.89 | ||
| TCG | 2.9 | 3.1 | 1.03 (0.15,6.67) | 1 |
Results of genetic score
A total of 32 SNP sites (excluding ACE2 genes) were weighted to obtain the genetic score of RAAS system genes as a whole with the occurrence of EH. As was shown in Table 6, the median score for the overall population was -0.225. Based on this median score the genetic scores of each study subject were divided into two groups: high score group (score > -0.225), and low score group (score ≤ -0.225). The result of regression model showed that the OR (95%CI) of high score group was 1.229 (1.110-1.362), p < 0.01. Based on the above results, AGT/rs5046 and LRP6/rs12823243 were significantly correlated with the occurrence of EH. Additionally, we developed a two-gene scoring model, however, it failed to demonstrate a significant rise in risk for EH between the high score group and the low score group. Therefore, the results suggested that the genetic score for whole genes model could predict the risk of EH (more details in Table 6). Furthermore, the age was divided into two time periods according to less than 59 and more than 60, and whether they were EH patients as an outcome variable. In Table 7, the log-rank test was then conducted on the genetic score model. The findings indicated that there was a remarkable difference in the hazard function curves between the two groups, the OR and 95%CI of high score group were 2.150 (1.998-2.377) (p < 0.01). In Table 8, the result of stratification analysis between genetic score and age indicated that genetic score > -0.225 and age ≥ 60 were associated with increased susceptibility to hypertension (p < 0.05).
Gene scoring results based on the regression model
| Term | Median | OR | 95%CI | p |
|---|---|---|---|---|
| Genetic score for whole genes | -0.225 | 1.229 | 1.110,1.362 | < 0.01 |
| Two-gene genetic score | 1 | 0.902 | 0.732,1.111 | 0.332 |
Results of log-rank test
| Term | χ2 | OR (95%CI) | p |
|---|---|---|---|
| Log Rank (Mantel-Cox) | 20.283 | 2.150 (1.998,2.377) | < 0.01 |
The stratification analysis between genetic score and age
| Control | Case | χ2 | OR (95%CI) | p | ||
|---|---|---|---|---|---|---|
| Gene score ≤ -0.225 | *Age < 60 | 23 | 224 | 0.817 | 1.0 | 0.366 |
| *Age ≥ 60 | 5 | 77 | 0.632 (0.232,1.721) | |||
| Gene score > -0.225 | *Age < 60 | 20 | 214 | 5.582 | 1.0 | 0.018 |
| *Age ≥ 60 | 31 | 163 | 2.035 (1.119,3.700) |
Discussion
This study observed that the SNP scoring of a cluster gene in the RAAS system are positively associated with essential hypertension. First, our gene score modeling incorporated several a cluster of genes related to the RAAS system for the first time. Second, we explored the association between the SNPs, haplotypes of the RAAS system related genes and essential hypertension, and we acquired some significant discoveries. Third, we combined comprehensive effects of environmental factors with SNPs on the occurrence of essential hypertension.
In the current study, AGT genotype AA at locus rs5046 was found to have a greater risk on EH. A previous study had obtained similar results, Qian Li et al. investigated the susceptibility to EH in isolated populations (Yi and Hani) in remote areas of Yunnan, China, and found that rs5046 was significantly associated with EH in the Hani ethnic group [37]. However, other studies got different results, a Mexican group published the role of AGT gene cluster (rs699, rs4762, rs5051, rs5049, rs5046) polymorphisms in coronary artery disease, but no meaningful findings were found for the rs5046 locus [38]. The TT genotype at the LRP6/rs12823243 locus was found to be a risk factor for the occurrence of hypertension in the present study. A previous study has shown similar findings that carriers of LRP6 mutations was associated with cardiovascular disease [39]. Another investigation conducted in in the United States revealed that people with mutations in the LRP6 gene had higher-than-normal serum-related markers, which may be associated with the development of essential hypertension [40]. We found that the CC genotype at the ACE2/rs285666 locus was a risk factor for EH in males and the TT genotype in females, respectively. Consistent with our findings, Yan He et al. found that the T allele or TT genotype of ACE2/rs2285666 was a risk factor for hypertension in Wa women [41]. ACE2 is a critical component of RAAS that is located on the X chromosome. Therefore, the escape of X inactivation may contribute to the sex-related differences in the ACE2 gene in hypertension [41-43].
Genetic risk score is able to superimpose the micro-effects of each polymorphic locus to improve the accuracy of disease risk prediction. In the established gene scoring model, we included all the loci (except ACE2), and accounted for variations in alleles at each locus. Subsequently, we evaluated the cumulative risk of grouping genetic score by log rank test. Our finding indicated that scores over -0.225 are associated with a higher risk. When the score was above -0.225, the cumulative risk of EH increased by 2.150 times. Moreover, researchers have modeled different forms of gene scoring to measure the effect of changes in a single allele in a cluster of genes on the risk of disease, mostly for the prediction of cancer prognosis [44, 45]. Nonetheless, a limitation of the current study is the absence of data on gene expression levels, which would have facilitated the development of a more comprehensive scoring system.
Furthermore, LDH, CU, and GGT were risk factors for cardiovascular disease in previous studies [46-48]. However, we only found a significant difference in copper ions between EH cases and controls in the present study, the discrepancies may be mainly attributed to genetic background.
Conclusions
Collectively, this is the first time a hypertension risk scoring model of RAAS gene cluster has been constructed, which will provide novel insights for the prevention and control of chronic cardiovascular diseases such as essential hypertension. In addition, we found genetic polymorphisms of AGT/rs5046, LPR6/rs12823243, and ACE2/rs2285666 were associated with essential hypertension in residents of the cold regions of China.
Supplementary Material
Supplementary information and tables.
Acknowledgements
We thank all the participants and research fellows of Environment and Chronic Disease in Rural Areas of Heilongjiang, China (ECDRAHC)and staff of provincial and local county-level CDCs and other related departments for convening the subjects, and their contributions to field investigation and biological specimens' collection. We also thank key laboratories of ECDRAHC for measurement of biological samples, and medical institutions involved in the program for providing professional medical support.
Funding
This work was supported by National Health Commission of the People's Republic of China and funded by central transfer payments endemic disease project(N/A). This work was also funded by Special development funds of local colleges from the central government (Study on prevention and control of major diseases in Heilongjiang province, N/A). This work was also funded by Heilongjiang Academy of Medical Sciences (Chronic Disease Cohort study in Rural areas of Northeast China.CR201801).
Author contributions
All authors conceived and designed research. Conceptualization: Jin Cheng, Jing Cui, Dianjun Sun, Wei Zhang. Methodology: Jin Cheng, Jing Cui, Yuanyuan Li, Xiaona Liu, Yuting Jiang, Yanhui Gao, Dianjun Sun, Wei Zhang. Software: Jin Cheng, Jing Cui. Validation: Yuanyuan Li, Xiaona Liu, Yuting Jiang. Formal analysis: Jin Cheng, Jing Cui, Chang Liu, Hongqi Feng, Zhe Jiao, Xinhua Shao. Investigation: Jin Cheng, Jing Cui. Resources: Qiaoling Liu, Chang Liu, Hongqi Feng, Zhe Jiao, Xinhua Shao. Data Curation: Jin Cheng, Jing Cui. Writing - Original Draft: Jin Cheng, Jing Cui, Wei Zhang. Writing - Review & Editing: Yanhui Gao, Dianjun Sun, Wei Zhang. Visualization: Jin Cheng, Jing Cui, Yuting Jiang, Qiaoling Liu, Chang Liu, Hongqi Feng, Zhe Jiao, Xinhua Shao. Supervision: Yanhui Gao, Dianjun Sun, Wei Zhang. Project administration: Yuanyuan Li, Xiaona Liu, Yuting Jiang. Funding acquisition: Yanhui Gao, Dianjun Sun, Wei Zhang.
Competing Interests
The authors have declared that no competing interest exists.
References
1. Mensah GA, Fuster V, Roth GA. A Heart-Healthy and Stroke-Free World: Using Data to Inform Global Action. J Am Coll Cardiol. 2023;82(25):2343-2349
2. Nguyen TN, Chow CK. Global and national high blood pressure burden and control. Lancet. 2021;398(10304):932-933
3. GBD 2019 Diseases and Injuries Collaborators. Global burden of 369 diseases and injuries in 204 countries and territories, 1990-2019: a systematic analysis for the Global Burden of Disease Study 2019. Lancet. 2020;396(10258):1204-1222
4. NCD Risk Factor Collaboration. Worldwide trends in hypertension prevalence and progress in treatment and control from 1990 to 2019: a pooled analysis of 1201 population-representative studies with 104 million participants. Lancet. 2021;398(10304):957-980
5. Tu WJ, Wang LD. Special Writing Group of China Stroke Surveillance Report. China stroke surveillance report 2021. Mil Med Res. 2023;10(1):33
6. Fan J, Li X, Yu X. et al. Global Burden, Risk Factor Analysis, and Prediction Study of Ischemic Stroke, 1990-2030. Neurology. 2023;101(2):e137-e150
7. Wang Z, Chen Z, Zhang L. et al. Status of Hypertension in China: Results From the China Hypertension Survey, 2012-2015. Circulation. 2018;137(22):2344-2356
8. Wang L, Kong L, Wu F. et al. Preventing chronic diseases in China. Lancet. 2005;366(9499):1821-1824
9. Bursztyn M. Occupational and environmental influences on hypertension. J Hum Hypertens. 2020;34(3):202-206
10. Iacobucci G. Adults at lowest risk are most likely to have undiagnosed hypertension, data show. BMJ. 2023;381:976
11. Wang B, Liu J, Lei R. et al. Cold exposure, gut microbiota, and hypertension: A mechanistic study. Sci Total Environ. 2022;833:155199
12. Chen R, Lu J, Yu Q. et al. The acute effects of outdoor temperature on blood pressure in a panel of elderly hypertensive patients. Int J Biometeorol. 2015;59(12):1791-1797
13. Otsuki T, Ishii N. Association between blood pressure changes during self-paced outdoor walking and air temperature. Clin Physiol Funct Imaging. 2017;37(2):155-161
14. Fan P, Xue X, Hu J. et al. Ambient temperature and ambulatory blood pressure: An hourly-level, longitudinal panel study. Sci Total Environ. 2023;864:160854
15. Zhang M, Shi Y, Zhou B. et al. Prevalence, awareness, treatment, and control of hypertension in China, 2004-18: findings from six rounds of a national survey. BMJ. 2023;380:e071952
16. Ranzani OT, Kalra A, Di Girolamo C. et al. Urban-rural differences in hypertension prevalence in low-income and middle-income countries, 1990-2020: A systematic review and meta-analysis. PLoS Med. 2022;19(8):e1004079
17. Evangelou E, Warren HR, Mosen-Ansorena D. et al. Genetic analysis of over 1 million people identifies 535 new loci associated with blood pressure traits. Nat Genet. 2018;50(10):1412-1425
18. Giri A, Hellwege JN, Keaton JM. et al. Trans-ethnic association study of blood pressure determinants in over 750,000 individuals. Nat Genet. 2019;51(1):51-62
19. Alexander MR, Hank S, Dale BL. et al. A Single Nucleotide Polymorphism in SH2B3/LNK Promotes Hypertension Development and Renal Damage. Circ Res. 2022;131(9):731-747
20. Seligowski AV, Misganaw B, Duffy LA. et al. Leveraging Large-Scale Genetics of PTSD and Cardiovascular Disease to Demonstrate Robust Shared Risk and Improve Risk Prediction Accuracy. Am J Psychiatry. 2022;179(11):814-823
21. Zhang W, He J, Liu M. et al. Genetic Analysis Reveals Different Mechanisms of IL-5 Involved in the Development of CAD in a Chinese Han Population. Oxid Med Cell Longev. 2023:1700857.
22. Padmanabhan S, Dominiczak AF. Genomics of hypertension: the road to precision medicine. Nat Rev Cardiol. 2021;18(4):235-250
23. Ruocco G, Feola M, Palazzuoli A. Hypertension prevalence in human coronavirus disease: the role of ACE system in infection spread and severity. Int J Infect Dis. 2020;95:373-375
24. Novák J, Maceková S, Héžová R. et al. Polymorphism rs7079 in miR-31/-584 Binding Site in Angiotensinogen Gene Associates with Earlier Onset of Coronary Artery Disease in Central European Population. Genes (Basel). 2022;13(11):1981
25. Yao R, Du YY, Zhang YZ. et al. Association between G-217A polymorphism in the AGT gene and essential hypertension: a meta-analysis. Genet Mol Res. 2015;14(2):5527-5534
26. Satou R, Franco M, Dugas CM. et al. Immunosuppression by Mycophenolate Mofetil Mitigates Intrarenal Angiotensinogen Augmentation in Angiotensin II-Dependent Hypertension. Int J Mol Sci. 2022;23(14):7680
27. Musso G, Saba F, Cassader M. et al. Angiotensin II Type 1 Receptor rs5186 Gene Variant Predicts Incident NAFLD and Associated Hypertension: Role of Dietary Fat-Induced Pro-Inflammatory Cell Activation. Am J Gastroenterol. 2019;114(4):607-619
28. Fliser D, Veldhuis JD, Dikow R. et al. Effects of acute ACE inhibition on pulsatile renin and aldosterone secretion and their synchrony. Hypertension. 1998;32(5):929-934
29. de Montgolfier O, Pouliot P, Gillis MA. et al. Systolic hypertension-induced neurovascular unit disruption magnifies vascular cognitive impairment in middle-age atherosclerotic LDLr-/-:hApoB+/+ mice. Geroscience. 2019;41(5):511-532
30. Chappel MC, Ferrario CM. ACE and ACE2: their role to balance the expression of angiotensin II and angiotensin-(1-7). Kidney Int. 2006;70(1):8-10
31. Tikellis C, Cooper ME, Bialkowski K. et al. Developmental expression of ACE2 in the SHR kidney: a role in hypertension? Kidney Int. 2006;70(1):34-41
32. Heilongjiang Bureau of Statistics. The 6th National Health Services Survey Plan (2018). http://tjj.hlj.gov.cn/.
33. Zheng E, Xu J, Xu J. et al. Health-Related Quality of Life and Its Influencing Factors for Elderly Patients With Hypertension: Evidence From Heilongjiang Province, China. Front Public Health. 2021;9:654822
34. Jiang Y, Feng H, Jiao Z. et al. Environment and chronic disease in rural areas of Heilongjiang, China (ECDRAHC). BMJ Open. 2023;13(1):e063850
35. Yin R, Yin L, Li L. et al. Hypertension in China: burdens, guidelines and policy responses: a state-of-the-art review. J Hum Hypertens. 2022;36(2):126-134
36. Blech I, Katzenellenbogen M, Katzenellenbogen A. et al. Predicting diabetic nephropathy using a multifactorial genetic model. PLoS One. 2011;6(4):e18743
37. Li Q, Sun L, Du J. et al. Risk given by AGT polymorphisms in inducing susceptibility to essential hypertension among isolated populations from a remote region of China: A case-control study among the isolated populations. J Renin Angiotensin Aldosterone Syst. 2015;16(4):1202-1217
38. Fragoso JM, Alvarez-León E, Delgadillo-Rodríguez H. et al. The C4280A (rs5705) gene polymorphism of the renin (REN) gene is associated with risk of developing coronary artery disease, but not with restenosis after coronary stenting. Exp Mol Pathol. 2015;99(1):128-132
39. Alrefaei AF, Abu-Elmagd M. LRP6 Receptor Plays Essential Functions in Development and Human Diseases. Genes (Basel). 2022;13(1):120
40. Singh R, Smith E, Fathzadeh M. et al. Rare nonconservative LRP6 mutations are associated with metabolic syndrome. Hum Mutat. 2013;34(9):1221-1225
41. He Y, Yang W, Liu S. et al. Interactions between angiotensin-converting enzyme-2 polymorphisms and high salt intake increase the risk of hypertension in the Chinese Wa population. Int J Clin Exp Pathol. 2017;10(11):11159-11168
42. Wu X, Zhu B, Zou S. et al. The Association Between ACE2 Gene Polymorphism and the Stroke Recurrence in Chinese Population. J Stroke Cerebrovasc Dis. 2018;27(10):2770-2780
43. Carrel L, Willard HF. X-inactivation profile reveals extensive variability in X-linked gene expression in females. Nature. 2005;434(7031):400-404
44. Tian L, Wang Y, Tian J. et al. Prognostic Value and Genome Signature of m6A/m5C Regulated Genes in Early-Stage Lung Adenocarcinoma. Int J Mol Sci. 2023;24(7):6520
45. Wang P, Wang Y, Hang B. et al. A novel gene expression-based prognostic scoring system to predict survival in gastric cancer. Oncotarget. 2016;7(34):55343-55351
46. Chen S, Zou Y, Song C. et al. The role of glycolytic metabolic pathways in cardiovascular disease and potential therapeutic approaches. Basic Res Cardiol. 2023;118(1):48
47. Yang L, Yang P, Lip GYH. et al. Copper homeostasis and cuproptosis in cardiovascular disease therapeutics. Trends Pharmacol Sci. 2023;44(9):573-585
48. Pahwa P, Chu L, Karunanayake C. et al. Predictive biomarkers of cardiovascular disease in adult Canadian population. J Diabetes Metab Disord. 2021;20(2):1199-1209
Author contact
![]() Corresponding authors: Professor Wei Zhang; zwhxdcom. Center for Endemic Disease Control, Chinese Center for Disease Control and Prevention, Harbin Medical University, 157 Baojian Road, Harbin 150081, China. Tel.: +86 451 87503105; Fax: +86 451 87503105. Professor Dianjun Sun; hrbmusdjcom. Center for Endemic Disease Control, Chinese Center for Disease Control and Prevention, Harbin Medical University, 157 Baojian Road, Harbin 150081, China. Tel.: +86 451 86612695; Fax: +86 451 86657674. Professor Yanhui Gao; gaoyh411com. Center for Endemic Disease Control, Chinese Center for Disease Control and Prevention, Harbin Medical University, 157 Baojian Road, Harbin 150081, China. Tel.: +86 451 86674762; Fax: +86 451 86657674.
Corresponding authors: Professor Wei Zhang; zwhxdcom. Center for Endemic Disease Control, Chinese Center for Disease Control and Prevention, Harbin Medical University, 157 Baojian Road, Harbin 150081, China. Tel.: +86 451 87503105; Fax: +86 451 87503105. Professor Dianjun Sun; hrbmusdjcom. Center for Endemic Disease Control, Chinese Center for Disease Control and Prevention, Harbin Medical University, 157 Baojian Road, Harbin 150081, China. Tel.: +86 451 86612695; Fax: +86 451 86657674. Professor Yanhui Gao; gaoyh411com. Center for Endemic Disease Control, Chinese Center for Disease Control and Prevention, Harbin Medical University, 157 Baojian Road, Harbin 150081, China. Tel.: +86 451 86674762; Fax: +86 451 86657674.