Impact Factor ISSN: 1449-1907
- Issue 8; 2026
- Issue 7; 2026
- Issue 6; 2026
- Issue 5; 2026
- Issue 4; 2026
- Volume 23; 2026
- Past Issues
- Editorial Board
- Cover Images
- Index & Coverage
- Cover Suggestion
- Special Issues
1. Introduction
2. Methods and Materials
3. Results
4. Discussion
5. Conclusion
Abbreviations
Supplementary Material
Acknowledgements
References

 Global reach, higher impact
Int J Med Sci 2024; 21(2):413-423. doi:10.7150/ijms.89141 This issue Cite
Research Paper
Plasma metabolomic analysis of human hepatocellular carcinoma before and after transcatheter arterial chemoembolization
Jing Fan1, Min Xu2, Sizhu Lu2, Mengxuan Shan2, Ke Liu2, Wanping Yan2, Wei Ye2 ![]()
1. Clinical Research Center, The Second Hospital of Nanjing, Affiliated to Nanjing University of Chinese Medicine, Zhong Fu Road, Gulou District, Nanjing, Jiangsu 210003, China.
2. Department of infectious disease and liver disease, The Second Hospital of Nanjing, Affiliated to Nanjing University of Chinese Medicine, Zhong Fu Road, Gulou District, Nanjing, Jiangsu 210003, China.
Received 2023-8-14; Accepted 2023-12-2; Published 2024-1-1
Abstract

Introduction: Hepatocellular carcinoma (HCC) is the fourth most prevalent cancer in China. Transcatheter arterial chemoembolization (TACE) is a common interventional therapy for HCC. In this study, we aimed to explore specific metabolites that can accurately predict prognosis after TACE in patients with HCC.
Methods: Patients with HCC and healthy volunteers (n = 20 each) were recruited to our study; plasma samples were collected from patients before and after TACE and from healthy volunteers. Plasma samples were subjected to untargeted ultra-high performance liquid chromatography-high resolution mass spectrometry metabolomics analysis, to identify metabolites significantly associated with the prognosis of patients with HCC after TACE.
Results: Orthogonal filtered partial least squares discriminant analysis confirmed significant separation of the pre-TACE, post-TACE, and healthy groups, and 34 differential metabolites were identified between the pre-TACE and post-TACE groups. KEGG analysis revealed that phenylalanine, tyrosine, and tryptophan biosynthesis pathways and the phenylalanine metabolism pathway were potentially altered in HCC genesis and during TACE. Phenylalanine and tyrosine are involved in both pathways and were increased in the pre-TACE group relative to controls, with phenylalanine further increased in the post-TACE group. Receiver operating characteristic (ROC) curve analysis indicated that PC 36:4|PC 18:2_18:2 (area under the ROC curve (AUC) = 0.798) is a potential marker for assessment of prognosis in patients with HCC after TACE. Moreover, ROC curve analysis indicated that palmitoylcarnitine (AUC = 1) is a marker with potential value for HCC diagnosis.
Conclusions: Limited studies had been conducted on the detection of metabolites in the plasma of HCC patients before and after TACE. PC 36:4|PC 18:2_18:2 is a potential marker for evaluation of the therapeutic effects of TACE. This finding may be beneficial for the treatment of patients with HCC after TACE.
Keywords: hepatocellular carcinoma, TACE, metabolomic, plasma
1. Introduction
Hepatocellular carcinoma (HCC) is among the most common gastrointestinal malignancies, with the seventh highest incidence worldwide and ranking third for mortality[1]. HCC has a high rate of recurrence, mortality, and metastasis in China[2]. Common treatments for HCC include hepatectomy, liver transplantation, transcatheter arterial chemoembolization (TACE), ablative therapy, radiotherapy, and systematic antitumor therapy, and among others[3]. Since HCC tumors are often detected at an advanced stage or when they are not suitable for surgical excision, interventional radiology is often used for patients with intermediate or advanced HCC. TACE, as a type of interventional surgery, is the first line treatment for intermediate stage HCC, according to the Barcelona Clinic Liver Cancer system and the Chinese University Prognostic Index[4]. In TACE, the hepatic artery is embolized to cut off the blood supply to the HCC tumor, leading to ischemia and hypoxia, which inhibit tumor growth and can even induce tumor necrosis. Moreover, embolization drugs combined with chemotherapy during TACE can further reduce the tumor burden.
Metabolomics is an emerging technology that allows quantitative analysis of all the metabolites in an organism at a given moment, to analyze relative relationships between metabolites and physiological and pathological changes. Metabolite analysis of biological fluid can directly and accurately reflect the pathophysiological state of the subject. By comparing metabolites at different stages, changes can be determined, and the biochemical characteristics of each stage can be elucidated. Since its emergence, metabolomics has been widely used to detect alterations metabolite levels, which can indicate the presence of diseases, such as melanoma, oral squamous cell carcinoma, and lung cancer[5,6,7]. This technique is also widely used in HCC. Various differential metabolites, including phenylalanine-tryptophan, urea, and retinol, are considered potential biomarkers for HCC[8,9,10]. These metabolites and their related enzymes have important roles in HCC diagnosis and prognosis and have provided a theoretical basis and therapeutic indicators for future diagnosis and treatment[8,11,12,13]. For example, Wang et al developed a scoring system that combines phenylalanine and choline with the presence of satellite nodes to assess overall survival of patients with HCC[14]. Another study suggested that there was a positive correlation between purine, pyrimidine, and amino acid metabolism and HCC metastasis[7]. Clinical response to treatment and recurrence or metastasis of HCC may also be traced by metabolite detection in body fluid samples; however, there have been few studies on the metabolomics of patients with HCC before and after TACE. We hypothesized that TACE would change tumor metabolic pathways or affect tumor environmental metabolism, thus playing a role in tumor therapy.
In this study, we employed untargeted metabolomics to investigate the biochemical changes in plasma of patients with HCC before and after TACE. We also compared the plasma metabolites of healthy individuals and patients with HCC, to identify abnormal metabolites associated with HCC development. Further, we analyzed the alterations in metabolites in patients with HCC before and after TACE, to understand the mechanism underlying TACE therapy. Additionally, we used differential metabolite and pathway analysis to determine pathways potentially affected by TACE. Finally, we conducted receiver operating characteristic (ROC) curve analysis, to identify markers with potential for application in evaluating the therapeutic effects of TACE.
2. Methods and Materials
2.1. Study cohort
Plasma samples from 20 patients with HCC were collected before and 7 days after TACE. In addition to TACE, all patients with HCC received general liver protection treatment. Plasma samples from 20 healthy volunteers were collected as the control group. All patients with HCC and healthy volunteers were recruited from the Second Hospital of Nanjing, Nanjing University of Chinese Medicine, from September 2020 to September 2021. Patients with HCC ranged in age from 45 to 75 years, and there were no significant differences in age or sex between the patient and control groups (Table 1). Diagnosis of HCC was based on alpha-fetoprotein level, computed tomography/magnetic resonance imaging, and histopathological changes. Individuals with severe cardiopulmonary insufficiency or coagulopathy or cachexia were excluded. Further, enrolled healthy volunteers had no current or past history of liver disease, infectious diseases, or metabolic disorders, and had not used medication that may affect liver metabolism. Clinical information was collected from the enrolled subjects. Tumor response was assessed by radiographic findings at 4-6 weeks postoperative, according to response evaluation criteria in solid tumours. This study was approved by the medical ethical committee of the Second Hospital of Nanjing, Nanjing University of Chinese Medicine, and written informed consent was received from all subjects.
Clinical characteristics of subjects in the HCC and healthy groups
| HCC (n = 20) | Healthy (n = 20) | p | ||
|---|---|---|---|---|
| Pre-TACE | Post-TACE | |||
| Male/Female | 14/6 | 13/7 | 0.736 | |
| Age (years) | 61 ± 8 | 57 ± 6 | 0.229 | |
| Pathogenesis (HBV/HCV) | 18/2 | |||
| AFP (ng/mL) | 179.82 ± 237.64 | 117.56 ± 166.55 | 0.277 | |
| ALT (U/L) | 45.84 ± 10.68 | 52.37 ± 8.69 | 0.517 | |
| AST (U/L) | 36.70 ± 3.28 | 44.35 ± 5.55 | 0.192 | |
| Albumin (g/L) | 42.23 ± 2.10 | 41.03 ± 1.80 | 0.660 | |
| TBIL (μM/L) | 19.84 ± 2.06 | 23.66 ± 3.19 | 0.189 | |
| ALP (U/L) | 100.20 ± 8.89 | 99.11 ± 9.74 | 0.773 | |
| Platelet (109/L) | 102.30 ± 10.17 | 103.4 ± 11.98 | 0.940 | |
Note: HCC, hepatocellular carcinoma; TACE, transcatheter arterial chemoembolization; HBV, hepatitis B virus; HCV, hepatitis C virus; AFP, alpha-fetoprotein; ALT, alanine transaminase; AST, aspartate transaminase; TBIL, total bilirubin; ALP, alkaline phosphatase.
2.2. Plasma sample preparation and quality control (QC)
Plasma samples (n = 60) were analyzed using an ultra-high performance liquid chromatography-high resolution mass spectrometry (UHPLC-HRMS/MS)-based untargeted metabolomics platform. All enrolled subjects followed overnight fasting. Methanol (200 μL) was added to 50 μL plasma samples, and vortexed to mix evenly. Then, samples were incubated at -40 ℃ for 30 min and 4 ℃ for 10 min, before centrifugation (15000 g, 4℃, 15 min). Supernatants were evaporated to dryness, and samples then reconstituted in 50 μL 10% methanol. A QC sample was obtained by isometric pooling of all prepared samples. Internal standards were valine-13C5-15N, leucine-13C6, phenylalanine-d5, 3-chloro-D-phenylalanine, octanoic-d15 acid, decanoic-d19 acid, octadecanoic-d35 acid, tetradecanoic-d27 acid, hexadecanoyl-L-carnitine-d3, and decanoyl-L-carnitine-d3.
2.3. UHPLC-HRMS/MS platform
Chromatographic separation of all samples was performed using a ThermoFisher Ultimate 3000 UHPLC system with a Waters ACQUITY UPLC BEH Amide column (2.1 × 100 mm, 1.7 μm). Mobile phases were solvent A (water containing 15 mM ammonium acetate (pH = 9)) and solvent B (90% acetonitrile containing 10 mM ammonium acetate). Linear gradient elution was performed as follows: 0 min, 90% B; 4 min, 85% B; 11-18 min, 75% B; 18.1-20 min, 90% B. Flow rate was 0.25 mL/min. Eluents were analyzed on a ThermoFisher Q Exactive™ Hybrid Quadrupole-Orbitrap™ Mass Spectrometry in heated electrospray ionization positive and negative modes, separately. The main parameters were set as follows: (1) spray voltage, 3500 V; (2) capillary and probe heater temperature, both 350°C; (3) sheath gas flow rate, aux gas flow rate, and S-Lens RF level, 40 (Arb), 10 (Arb), and 50 (Arb), respectively; (4) full scan was operated at high-resolution (35000 FWHM, m/z = 200), range 70-1050 m/z, with AGC target, 3 × 10⁶. Data-dependent acquisition was used to acquire fragment ion information from up to 8 precursors in each scan. Parameters were as follows: HCD energy, 15, 30, and 45 eV; mass resolution, 17500 FWHM; and AGC threshold, 2 × 10⁵.
2.4. Data processing and identification of UHPLC-HRMS/MS data
ProteoWizard software was used to transform the UHPLC-HRMS/MS data to mzXML format. The XCMS and CAMERA packages were employed in the R software platform, to further process the data, and final data were compiled as a peak table file, containing observations (sample name), variables (retention times (RT)_mass to charge ratio (m/z)), and peak areas. Peak area data were normalized to internal standards before performing univariate or multivariate statistical analysis. All results with relative standard deviation ≥ 30% within the repeated injections of QC samples were removed.
MS-DIAL software was used to identify metabolites. Accurate mass to charge ratio (m/z) of parent ions, mass spectra of fragment ions, and RT were matched against mzCloud, MoNA, and HMDB databases. Tolerances of accurate mass to charge ratio (m/z) for parent ion and mass spectra of fragment ions to theoretical mass to charge ratio were limited to 0.005 Da and 0.05 Da, respectively. The matching similarity threshold for mass spectra of fragment ions was set at 70%. For the in-house database, RT tolerance was set to 0.5 min. For public or commercial databases, RT tolerance was set to infinity.
2.5. Statistical analysis
Data were normalized by PAR scaling before undergoing multivariate statistical analysis. Principal component analysis (PCA) and orthogonal filtered partial least squares discriminant analysis (OPLS-DA) were performed using normalized data. Model quality is described using R2X or R2Y and Q2 values. Student's t test or paired t test was used to evaluate the significance of differences between two groups and p values exported. Screening criteria defining differential metabolites between two groups were: fold change > 1.2 and p < 0.05. Pathway analysis was performed using the MetaboAnalyst 5.0 (http://www.metaboanalyst.ca/) online tool. ROC curves were calculated and plotted using Medcalc software. Relative quantification of differential metabolites was plotted using GraphPad Prism 9.0.
3. Results
3.1. Clinical characteristics of study participants
A total of 20 patients with HCC (14 males and 6 females; mean age, 61 years) were recruited to this study and 20 healthy volunteers (13 males and 7 females; mean age, 57 years) were recruited as the control group. There was no significant difference in sex or age between patients with HCC and healthy volunteers (Table 1). No differences in biological or histological parameters were detected between patients with HCC pre- and post-TACE (Table 1).
3.2. UHPLC-HRMS/MS-based metabolic profiling
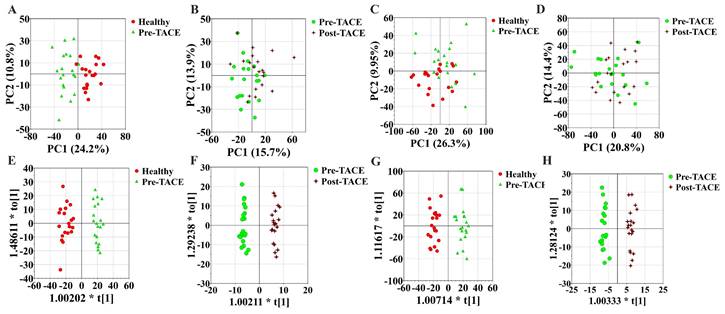
To discover differences in metabolic patterns in patients with HCC before and after TACE, we used UHPLC-HRMS/MS to compare metabolites among the healthy, pre-TACE, and post-TACE groups. Normalized data were preprocessed by par scaling and mean centering. PCA plots for these three groups and QC data are presented in Supplemental Figure 1. PCA score plots in positive and negative ion modes suggested distinct clustering of samples between the healthy and pre-TACE groups (R2X = 0.532 in positive ion mode, R2X = 0.521 in negative ion mode), but not between the pre- and post-TACE groups (R2X = 0.651 in positive ion mode, R2X = 0.546 in negative ion mode) (Fig. 1A-D). OPLS-DA was further used to analyze metabolite data from the different groups. The resulting OPLS-DA model could distinguish samples between the healthy and pre-TACE groups (R2X = 0.361, R2Y = 0.947, Q2 = 0.771 in positive ion mode, R2X = 0.414, R2Y = 0.938, Q2 = 0.789 in negative ion mode) and between the pre- and post-TACE groups (R2X = 0.349, R2Y = 0.983, Q2 = 0.568 in positive ion mode, R2X = 0.356, R2Y = 0.975, Q2 = 0.514 in negative ion mode), (Fig. 1E-H). Moreover, the results of permutation tests for OPLS-DA model shown in Supplemental Fig. 2 and all the p value of CV-ANOVA for OPLS-DA was <0.05. So, these results indicated that there were significant differences in metabolites among the groups.
Metabolic profiling. (A-B) PCA analysis, positive ion mode. 5 principal components for the comparison in (A) and 8 principal components for the comparison in (B); (C-D) PCA analysis, negative ion mode. 5 principal components for the comparison in (C) and 6 principal components for the comparison in (D); (E-F) OPLS-DA analysis, positive ion mode.; (G-H) OPLS-DA analysis, negative ion mode. There was one predictive component and one orthogonal component used for the comparison in (E) and (G), and one predictive component and three orthogonal components used for the comparison in (F) and (H).
3.3. Discovery of metabolic profiles of different groups
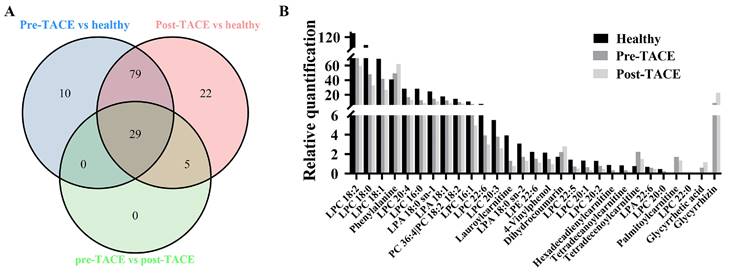
The criteria for identification of differential metabolites among the analyzed groups were set as fold change > 1.2 and p < 0.05. The obtained data indicated that 29 metabolites exhibited clear variation in levels among the healthy, pre-TACE, and post-TACE groups (Fig. 2). Further analysis of the pre-TACE group versus healthy group revealed that 118 metabolites differed significantly, of which 96 were decreased and 26 were increased (Fig. 3A and C) (Supplemental Fig. 3). Differences in metabolites before and after TACE in patients with HCC have not been reported. These metabolites may be useful to evaluate the therapeutic effect of TACE. To explore the metabolic changes during TACE, we compared metabolites between the pre- and post-TACE groups and found that 34 metabolites differed significantly, of which 4 were decreased, and 30 were increased (Fig. 3B and D) (Supplemental Fig. 4).
Differential metabolites among the healthy, pre-TACE, and post-TACE groups. (A) Venn diagram of differential metabolites among the healthy, pre-TACE, and post-TACE groups. (B) Relative quantification of 29 differential metabolites in the three groups.
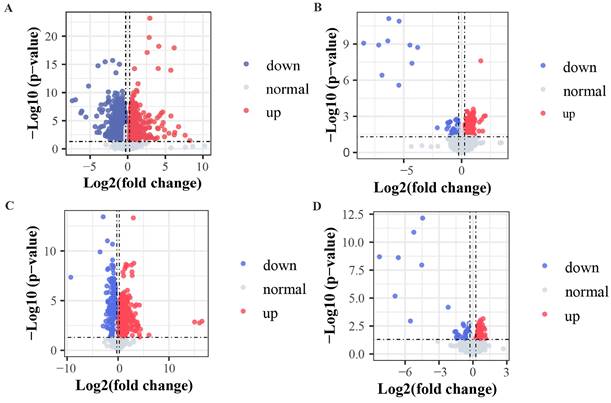
Volcano plots comparing metabolites among different groups. (A and C) Pre-TACE group compared with the healthy group. (B and D) Post-TACE group compared with the pre-TACE group. (A-B) Positive ion mode. (C-D) Negative ion mode. Threshold parameters: fold change > 1.2, p < 0.05.
3.4. Metabolic Pathway Analysis
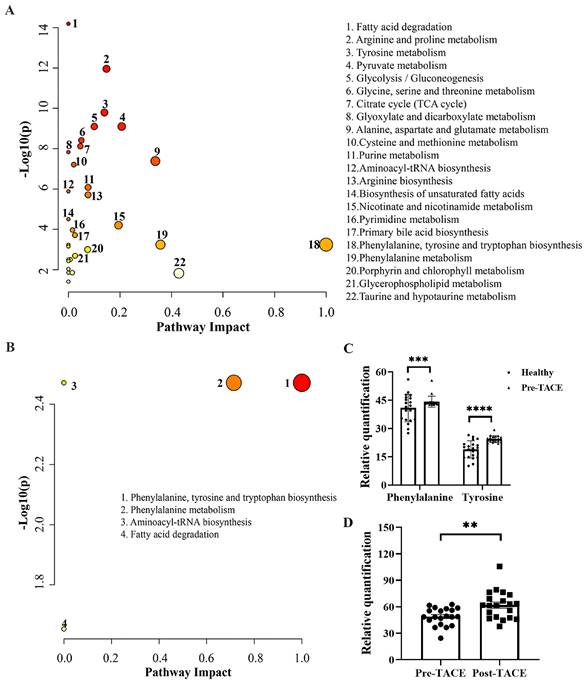
To investigate potential pathways that may be significantly altered during HCC genesis and TACE treatment, MetaboAnalyst version 5.0 was used to identity pathways enriched for differential metabolites. KEGG analysis between the healthy and pre-TACE groups showed that 22 pathways were significantly enriched. By combining -LOG(p) and impact values, we concluded that phenylalanine, tyrosine, and tryptophan biosynthesis (-LOG(p) = 3.24, impact = 1) and phenylalanine metabolism (-LOG(p) = 3.24, impact = 0.36) pathways may been involved in HCC genesis (Fig. 4A). Both pathways involved phenylalanine and tyrosine, which were increased in the pre-TACE group relative to the healthy group (Fig. 4C). Further, KEGG analysis of the pre- and post-TACE groups showed that four metabolic pathways were significantly enriched (Fig. 4B). According to -LOG(p) and impact values, the phenylalanine, tyrosine, and tryptophan biosynthesis and phenylalanine metabolism pathways may be altered during TACE (Table 2). Phenylalanine was involved in both pathways and was increased in the post-TACE group relative to the pre-TACE group (Fig. 4D). Given that many of the differential metabolites between the pre-TACE and post-TACE groups were lipid substances, we employed BioPan for a lipid pathway enrichment analysis. The results indicated that PC36:4|PC18:2_18:2 plays a significant role (Supplemental Fig. 5).
Pathway enrichment analysis of differential metabolites between different groups. Pathways enriched for differential metabolites (A) between the healthy and pre-TACE groups and (B) between the pre- and post-TACE groups. Abscissa values were based on pathway topology analysis, and indicate the importance of the pathway to the occurrence of the difference. Larger circles indicate higher importance. Ordinate values indicate the correlation between metabolic pathways and groups. Deeper red color indicates a stronger correlation. (C) Histogram showing the relative abundance of phenylalanine and tyrosine in the healthy and pre-TACE groups. Statistical analysis was performed using the student's t test. (D) Histogram showing the relative abundance of phenylalanine between the pre- and post-TACE groups. The paired t test was used for comparisons. **p < 0.01, ***p < 0.001, ****p < 0.0001.
Summary of pathways differing between the pre- and post-TACE groups
| Pathway | Totala | Hitsb | -LOG(p) | FDRc | Impactd |
|---|---|---|---|---|---|
| Phenylalanine, tyrosine, and tryptophan biosynthesis | 4 | 1 | 2.47 | 0.0045 | 0.50 |
| Phenylalanine metabolism | 10 | 1 | 2.47 | 0.0045 | 0.36 |
| Aminoacyl-tRNA biosynthesis | 48 | 1 | 2.47 | 0.0045 | 0 |
| Fatty acid degradation | 39 | 1 | 1.65 | 0.022 | 0 |
aTotal number of compounds in the pathway
bNumber of plasma metabolites involved in the pathway
cFalse discovery rate (FDR) was analyzed using the “fdrtool” package in the R platform
dPathway impact value calculated by pathway topology analysis
3.5. Potential biomarkers for HCC diagnosis and evaluation of TACE efficacy
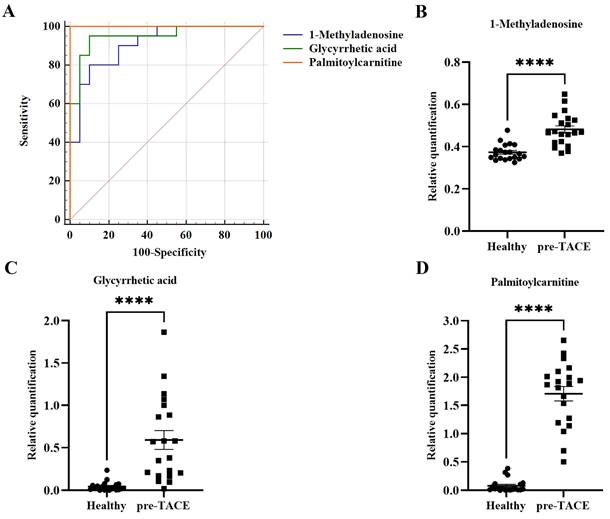
To discover potential biomarkers for diagnosis of HCC, ROC curves were plotted for the 118 differential metabolites between the healthy and pre-TACE groups, among which, three metabolites (1-methyladenosine, glycyrrhetic acid, and palmitoylcarnitine) had AUC values > 0.9 (p < 0.05) (Fig. 5A). Notably, all three of these metabolites were increased in the pre-TACE group compared with the healthy group (Fig. 5B-C). Together with the results of sensitivity and specificity analysis, our data led us to speculate that palmitoylcarnitine (AUC = 1) has potential as an auxiliary biomarker for HCC diagnosis; the cut-off value for palmitoylcarnitine was > 0.38.
Potential biomarkers for HCC diagnosis. (A) ROC curves for differential metabolites between the healthy and pre-TACE groups. AUC1-methyladenosine = 0.91; AUCglycyrrhetic acid = 0.95; AUCpalmitoylcarnitine = 1.00. (B-D) Histograms showing the relative abundance of three differential metabolites between the healthy and pre-TACE groups. Statistical analysis was performed using the student's t test. ****p < 0.0001.
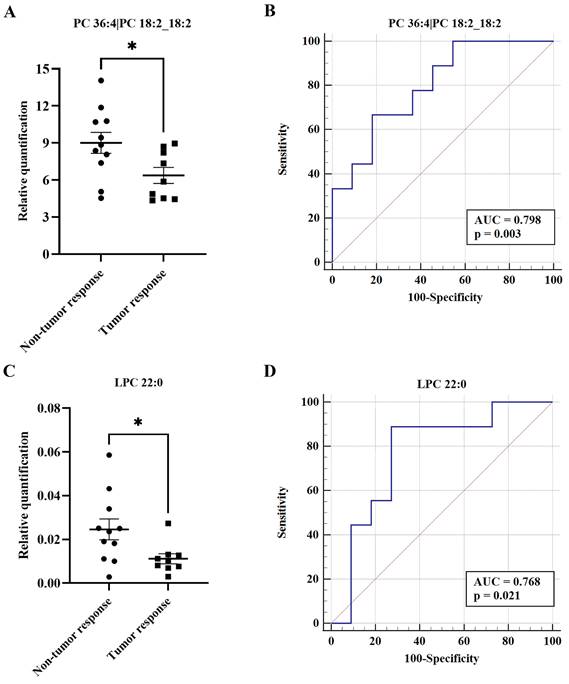
To date, there are no effective indicators for evaluation of the therapeutic effects of TACE. Therefore, we divided the post-TACE group into non-tumor response (n = 11) and tumor response (n = 9) groups. Of 34 differential metabolites between the pre- and post-TACE groups, two metabolites (PC 36:4|PC 18:2_18:2 and LPC 22:0) differed significantly between the non-tumor response and tumor response groups (Fig. 6A and C). Furthermore, ROC curve analysis yielded AUC > 0.75 and p < 0.05 for these two metabolites (Fig. 6B and D). Given the low relative quantities of LPC 22:0 detected and the results of comprehensive sensitivity and specificity analysis, we favor PC 36:4|PC 18:2_18:2 as a metabolite potentially useful for evaluation of the therapeutic effects of TACE (Table 3).
Potential biomarkers to evaluate the therapeutic effect of TACE. (A and C) Histograms showing the relative abundance of PC 36:4|PC 18:2_18:2 and LPC 22:0 between the non-tumor response and tumor response groups, respectively. The Student's t test was used for comparisons; *p < 0.05. (B and D) ROC curves for PC 36:4|PC 18:2_18:2 and LPC 22:0 between the non-tumor response and tumor response groups, respectively. ROC curves and AUC values were generated using Medcalc software.
List of significant metabolites identified by ROC curve analysis
| Metabolite | Sensitivity | Specificity | 95% CI | Cut off value |
|---|---|---|---|---|
| PC 36:4|PC 18:2_18:2 | 66.67% | 81.82% | 0.561-0.942 | ≤ 7.348 |
| LPC 22:0 | 88.89% | 72.73% | 0.528-0.924 | ≤ 0.013 |
Note: CI, confidence interval
4. Discussion
HCC is the fourth most common malignant tumor in China, with a high rate of metastasis and mortality[15]. TACE is a non-invasive interventional radiology treatment that limits the blood supply to tumors while delivering chemotherapy drugs[16]. Metabolic disorders occur during tumor progression, and metabolomics is a high throughput approach that measures metabolite concentrations in different pathological or physiological states to define the metabolic status of biological systems associated with diseases. In this study, untargeted UHPLC-HRMS/MS metabolomics analysis was performed on serum samples from 20 patients with HCC and 20 healthy volunteers to detect metabolic differences and predict patient prognosis after TACE.
OPLS-DA model analysis revealed clear distinctions among the groups. We identified 118 differential metabolites between the healthy and pre-TACE groups and 34 between the pre- and post-TACE groups. KEGG analysis revealed that the phenylalanine, tyrosine, and tryptophan biosynthesis pathway, as well as the phenylalanine metabolism pathway, may be involved in HCC genesis and the TACE treatment process. Consistent with our results, Jee et al[17] found abnormalities in these pathways in patients with HCC relative to healthy volunteers. To date, there have been few reports on differences in metabolites or pathways before and after TACE in patients with HCC. The key amino acids involved in these two pathways are phenylalanine and tyrosine. In this study, phenylalanine and tyrosine were elevated in the plasma of the pre-TACE group compared with the healthy group, consistent with previous reports[18]. In addition, phenylalanine, but not tyrosine, was further increased after TACE. These two amino acids participate in the synthesis of important neurotransmitters and hormones, such as dopamine and thyroid hormone[19] and abnormal metabolism of tyrosine is associated with HCC occurrence[20]. Phenylalanine, as the precursor of tyrosine, is converted to tyrosine by phenylalanine 4-hydroxylase. Tumor inflammation and immune activation interfere with phenylalanine conversion in ovarian carcinoma by attenuating phenylalanine 4-hydroxylase activity, resulting in increased phenylalanine concentration[21]. Moreover, inflammation and immune activation can increase the plasma phenylalanine/tyrosine ratio[22]. We suspect that this phenomenon also occurs in HCC, leading to elevated plasma phenylalanine and tyrosine compared with healthy controls. The mechanism underlying the increased level of phenylalanine after TACE is not well understood; however, it is plausible that elevated plasma phenylalanine levels may be related to changes in tumor metabolism or immune responses after TACE. Previous studies on the effect of TACE on immune status in HCC showed that Th17 cells and the CD4/CD8 ratio increased, while regulatory T cells significantly decreased, in the periphery after TACE, representing an immune-activated environment[23,24]. Thus, this immune-activated environment following TACE may be responsible for the further elevation of phenylalanine compared with those in patients pre-TACE; however, another study also indicated that cytokines associated with Th2 cells were elevated after TACE, leading to an immune suppressive environment[25]. Therefore, the reason for the increase in phenylalanine after TACE in HCC requires further exploration.
ROC curve analysis comparing the healthy and pre-TACE groups showed that palmitoylcarnitine is a potential biomarker for HCC auxiliary diagnosis. We found that palmitoylcarnitine was increased in plasma from patients with HCC compared with the healthy group, consistent with the results of a previous study[26]. Contrary to our findings, Jee et al found that palmitoylcarnitine levels were lower in patients with HCC than in healthy controls[17]. Palmitoylcarnitine is a long chain acylcarnitine. The main function of palmitoylcarnitine is as a carrier for transporting long-chain fatty acids into the mitochondria for β-oxidation, which provides energy for cell activities[27]. Palmitoylcarnitine stimulates the early growth of HepG2 cells[28], which may explain the elevated levels of palmitoylcarnitine in HCC, which represent a marker with potential for application in HCC auxiliary diagnosis.
Finally, ROC curve analysis between the non-tumor response and tumor response groups after TACE showed that PC 36:4|PC 18:2_18:2, which was decreased in the tumor response group, may be a useful marker for evaluating the therapeutic effects of TACE; similar results have not been reported previously. PC 36:4|PC 18:2_18:2 belongs to the class of phosphatidylcholines (PCs), and an association between PCs and HCC has been reported in many studies. Further, PCs are established as involved in lipid metabolism reprogramming[29,30,31]. A recent study showed that overexpression of lysophosphatidylcholine (LPC) acyltransferase 1 catalyzed the transformation of LPCs to PCs in the Lands PCs biosynthesis cycle, which could enrich PC species and promote cell proliferation in HCC[32]. Moreover, PCs are reported to promote tumorigenesis and metastasis[33,34]. Thus, a decline in PCs may predict tumor response after TACE in patients with HCC.
A limitation of our study is the small sample size used, which may impact the generalizability of our findings. Future research efforts with larger and more diverse cohorts are warranted to validate and extend our current findings, enhancing the reliability of the conclusions drawn from this study.
5. Conclusion
In this study we aimed to investigate metabolic changes in patients with HCC and to identify potential markers for HCC diagnosis and prognosis assessment after TACE. By analyzing metabolomic profiles, we identified several differential metabolites and related metabolic pathways that may function in HCC development and response to TACE treatment. Our findings suggest that palmitoylcarnitine is a potential marker for HCC auxiliary diagnosis and that PC 36:4|PC 18:2_18:2 could serve as a marker for evaluating the therapeutic effects of TACE; however, our study was limited by a relatively small sample size, and further studies with larger patient cohorts are needed to validate our findings.
Abbreviations
HCC: Hepatocellular carcinoma; TACE: transcatheter arterial chemoembolization; ROC: receiver operating characteristic; UHPLC-HRMS/MS: liquid chromatography-high resolution mass spectrometry; PCA: principal component analysis; OPLS-DA: orthogonal filtered partial least squares discriminant analysis; HBV: hepatitis B virus; HCV: hepatitis C virus; AFP: alpha-fetoprotein; ALT: alanine transaminase; AST: aspartate transaminase; TBIL: total bilirubin; ALP: alkaline phosphatase.
Supplementary Material
Supplementary figures.
Acknowledgements
Funding
This study was funded by the Medical Science and Technology Development Foundation, Nanjing Department of Health (grant numbers: YKK21119), the 333 Project of Jiangsu Province (Wei Ye), the Scientific research project of Jiangsu Provincial Health Commission (M2021074) (Wei Ye), and the Talent Support Program of the Second Hospital of Nanjing (RCMS23001). Nanjing Infectious Disease Clinical Medical Center, Innovation center for infectious disease of Jiangsu Province (No. CXZX202232) (Wei Ye).
Ethics approval and informed consent
This study was approved by the medical ethical committee of the Second Hospital of Nanjing, Nanjing University of Chinese Medicine and written informed consent was received from all subjects.
Author contributions
JF performed research and wrote the paper. MX and SZL collected the clinical samples and clinical information. MXS, KL, and WPY analyzed data. WY conceived and designed the study. All authors read and approved the final version of the manuscript.
Competing Interests
The authors have declared that no competing interest exists.
References
1. Bray F. et al. Global cancer statistics 2018: GLOBOCAN estimates of incidence and mortality worldwide for 36 cancers in 185 countries. CA: A Cancer Journal for Clinicians. 2018;68:394-424
2. McGlynn KA. et al. Epidemiology of Hepatocellular Carcinoma. Hepatology. 2021;73:4-13
3. Reig M. et al. BCLC strategy for prognosis prediction and treatment recommendation: The 2022 update. Journal of Hepatology. 2022;76:681-693
4. Raoul JL. et al. Updated use of TACE for hepatocellular carcinoma treatment: How and when to use it based on clinical evidence. Cancer Treatment Reviews. 2019;72:28-36
5. Zhao F. et al. Specific Gut Microbiome and Serum Metabolome Changes in Lung Cancer Patients. Frontiers in cellular and infection microbiology. 2021;11:725284-725284
6. Sridharan G. et al. Evaluation of salivary metabolomics in oral leukoplakia and oral squamous cell carcinoma. Journal of Oral Pathology & Medicine. 2019;48:299-306
7. Kosmopoulou M. et al. Human Melanoma-Cell Metabolic Profiling: Identification of Novel Biomarkers Indicating Metastasis. International journal of molecular sciences. 2020;21:2436
8. Luo P. et al. A Large-scale, multicenter serum metabolite biomarker identification study for the early detection of hepatocellular carcinoma. Hepatology. 2018;67:662-675
9. Bai C. et al. Urea as a By-Product of Ammonia Metabolism Can Be a Potential Serum Biomarker of Hepatocellular Carcinoma. Frontiers in Cell and Developmental Biology. 2021 9
10. Han J. et al. Tissue and serum metabolomic phenotyping for diagnosis and prognosis of hepatocellular carcinoma. International Journal of Cancer. 2020;146:1741-1753
11. Ferrarini A. et al. Metabolomic Analysis of Liver Tissues for Characterization of Hepatocellular Carcinoma. Journal of Proteome Research. 2019;18:3067-3076
12. Huang Q. et al. Metabolic Characterization of Hepatocellular Carcinoma Using Nontargeted Tissue Metabolomics. Cancer Research. 2013;73:4992-5002
13. Lu D. et al. A prognostic fingerprint in liver transplantation for hepatocellular carcinoma based on plasma metabolomics profiling. European Journal of Surgical Oncology. 2019;45:2347-2352
14. Wang Q. et al. Liquid Chromatography-Mass Spectrometry-Based Nontargeted Metabolomics Predicts Prognosis of Hepatocellular Carcinoma after Curative Resection. Journal of Proteome Research. 2020;19:3533-3541
15. Feng RM. et al. Current cancer situation in China: good or bad news from the 2018 Global Cancer Statistics? Cancer Communications. 2019;39:22
16. Miyayama S. Treatment Strategy of Transarterial Chemoembolization for Hepatocellular Carcinoma. Applied Sciences. 2020 10
17. Jee SH. et al. Metabolomics Profiles of Hepatocellular Carcinoma in a Korean Prospective Cohort: The Korean Cancer Prevention Study-II. Cancer Prevention Research. 2018;11:303-312
18. Liang KH. et al. Plasma phenylalanine and glutamine concentrations correlate with subsequent hepatocellular carcinoma occurrence in liver cirrhosis patients: an exploratory study. Scientific Reports. 2020;10:10926
19. Korner J. et al. A role for foregut tyrosine metabolism in glucose tolerance. Molecular metabolism. 2019;23:37-50
20. van Ginkel WG. et al. Hepatocellular Carcinoma in Tyrosinemia Type 1 Without Clear Increase of AFP. Pediatrics. 2015;135:e749-e752
21. Neurauter G. et al. Serum phenylalanine concentrations in patients with ovarian carcinoma correlate with concentrations of immune activation markers and of isoprostane-8. Cancer Letters. 2008;272:141-147
22. Geisler S. et al. Immune activation and inflammation increase the plasma phenylalanine-to-tyrosine ratio. Pteridines. 2013;24:27-31
23. Liao Y. et al. Increased circulating Th17 cells after transarterial chemoembolization correlate with improved survival in stage III hepatocellular carcinoma: a prospective study. PloS one. 2013;8:e60444-e60444
24. Liao J. et al. Effect of transcatheter arterial chemoembolization on cellular immune function and regulatory T cells in patients with hepatocellular carcinoma. Mol Med Rep. 2015;12:6065-6071
25. Kim MJ. et al. Change in inflammatory cytokine profiles after transarterial chemotherapy in patients with hepatocellular carcinoma. Cytokine. 2013;64:516-522
26. Lu Y. et al. Identification of serum biomarkers associated with hepatitis B virus-related hepatocellular carcinoma and liver cirrhosis using mass-spectrometry-based metabolomics. Metabolomics. 2015;11:1526-1538
27. Tarasenko TN. et al. Tissue acylcarnitine status in a mouse model of mitochondrial β-oxidation deficiency during metabolic decompensation due to influenza virus infection. Molecular genetics and metabolism. 2018;125:144-152
28. Turnbull PC. et al. Synergistic activation of mitochondrial metabolism and the glutathione redox couple protects HepG2 hepatocarcinoma cells from palmitoylcarnitine-induced stress. American Journal of Physiology Cell Physiology. 2019;317:C1324-C1329
29. Li Z. et al. Aberrant Lipid Metabolism in Hepatocellular Carcinoma Revealed by Liver Lipidomics. International Journal of Molecular Sciences. 2017 18
30. Chen SL. et al. Serum lipid profiling of patients with chronic hepatitis B, cirrhosis, and hepatocellular carcinoma by ultra fast LC/IT-TOF MS. Electrophoresis. 2013;34:2848-2856
31. Skill NJ. et al. Hepatocellular Carcinoma Associated Lipid Metabolism Reprogramming. Journal of Surgical Research. 2011;169:51-56
32. Morita Y. et al. Lysophosphatidylcholine acyltransferase 1 altered phospholipid composition and regulated hepatoma progression. Journal of Hepatology. 2013;59:292-299
33. Seok JK. et al. Oxidized Phospholipids in Tumor Microenvironment Stimulate Tumor Metastasis via Regulation of Autophagy. Cells. 2021 10
34. Kühn T. et al. Higher plasma levels of lysophosphatidylcholine 18:0 are related to a lower risk of common cancers in a prospective metabolomics study. BMC Medicine. 2016;14:13
Author contact
![]() Corresponding author: Wei Ye: yeweiedu.cn, Department of infectious disease and liver disease, The Second Hospital of Nanjing, Affiliated to Nanjing University of Chinese Medicine, Zhong Fu Road, Gulou District, Nanjing, Jiangsu 210003, China Phone: +8613951729085.
Corresponding author: Wei Ye: yeweiedu.cn, Department of infectious disease and liver disease, The Second Hospital of Nanjing, Affiliated to Nanjing University of Chinese Medicine, Zhong Fu Road, Gulou District, Nanjing, Jiangsu 210003, China Phone: +8613951729085.