Impact Factor ISSN: 1449-1907
- Issue 9; 2026
- Issue 8; 2026
- Issue 7; 2026
- Issue 6; 2026
- Issue 5; 2026
- Volume 23; 2026
- Past Issues
- Editorial Board
- Cover Images
- Index & Coverage
- Cover Suggestion
- Special Issues
Introduction
Materials and methods
Experimental design
Results
Discussion
Conclusion
Acknowledgements
References

 Global reach, higher impact
Int J Med Sci 2023; 20(1):102-113. doi:10.7150/ijms.78861 This issue Cite
Research Paper
Upregulation of Brain's Calcium Binding Proteins in Mitragynine Dependence: A Potential Cellular Mechanism to Addiction
Murtadha Basheer1, Zurina Hassan2 ![]() , Lay-Harn Gam1
, Lay-Harn Gam1 ![]()
1. School of pharmaceutical sciences, Universiti Sains Malaysia, Penang, Malaysia
2. Center of Drug Research, Universiti Sains Malaysia, Penang, Malaysia
Received 2022-9-12; Accepted 2022-10-20; Published 2023-1-1
Abstract

Background: Mitragyna speciosa Korth or Kratom is widely used traditionally for its medicinal values. The major alkaloid content of kratom leaves is mitragynine, which binds to opioid receptors to give opioid-like effects. This study aimed to analyse the brain proteome of animals that displayed addictive behaviors.
Design and Methods: Six groups (n=6-8) of rats made up of negative control, positive control using morphine (10 mg/kg), and treatment groups at low (1mg/kg) and high doses of mitragynine (30 mg/kg) for 1 and 4 days. The rats' behaviors were evaluated and subsequently the rats' brains were harvested for proteomic analysis that was performed by using 2D gel electrophoresis and LC/MS/MS.
Results: The rats developed physical dependence only on day 4 following morphine and mitragynine (1 and 30mg/kg) treatments. Among the proteins that were up-regulated in treatment groups were four calcium-binding proteins, namely calretinin, F-actin, annexin A3 and beta-centractin.
Conclusions: Upregulation of calretinin acted as low Ca2+ buffering upon the blockage of Ca2+ ion channel by mitragynine in the brain, which subsequently caused a reduction of GABA released and inversely increased the dopamine secretions that contributed to dependence indicators.
Keywords: Mitragynine, animal behavioral study, proteomics, calcium-related proteins
Introduction
Kratom (Mitragyna speciosa) is one of Southeast Asia native herbs. Traditionally, rural residents consumed kratom leaves for its recreational properties. It was also used for treating common illnesses such as fever, cough, diarrhea, and discomfort (1,2). Given its putative pain-relieving and mood-altering properties, kratom is increasingly used in the United States (US) to treat chronic pain, opioid use disorder (OUD) and withdrawal, as well as anxiety and depression (3,4). Multiple studies have shown that persistent kratom intake can lead to dependence (4,5). FDA reported that among kratom withdrawal symptoms are irritability, aggression, tears, runny nose, difficulty working, jerky motions of the limbs, and aches in the muscles and bones (6,7). Fatalities due to kratom as the sole intoxicant are uncommon although hundreds of deaths related to kratom that involved more than one drug usage was reported by the Center for Disease Control and Prevention (CDC) of the United States (7,8). Nevertheless, despite the FDA's repeated calls to criminalize kratom under the Control Substances Act, there is no proof that kratom use has caused significant health problems such as those of classical opioids (9).
Kratom leaves contain approximately 40 types of alkaloids (10). Mitragynine is the most abundant indole alkaloid (11) consisting of 66% of the alkaloids content (11). 7-Hydroxymitragynine (7-HMG), an active metabolite of mitragynine, is made up 0.04% of the alkaloid content of kratom leaves extracts (11-13). 7-HMG is formed as the break down product of mitragynine by the activity of CYP3A4 (14). In addition, 7-HMG may be formed post-harvest in kratom products that possibly contributing to increased reports of kratom toxicity in the Western world (14). Mitragynine has 9 times lower binding affinity to mu receptors (MOR) compared to 7-HMG, mitragynine is an MOR antagonist while 7-HMG is a partial agonist (15). The analgesic effect of mitragynine is mediated partially via mu and delta opioid receptors (16). Other physiological effects of mitragynine include ileum motility inhibition (3), smooth muscle contracture (17), and gastric acid secretion inhibition (18).
Cellular opioid dependence resulting from continuous stimulation of opioid-regulated signaling networks may ultimately lead to alterations in protein activities (19,20). It has been shown that repeated exposure to an addictive substance has modified the quantity or type of proteins expressed in specific brain areas (21). Such change in protein expression controls the activities of individual neurons that linked the brain circuits, from which may result in behavioral abnormalities associated with addiction (22). Amongst which are calcium-binding proteins that were expressed in many brain regions, and in various neuronal types in rodent (23). Thus, identifying the proteins related to the development and maintenance of drug dependence is critical not only in understanding the molecular mechanisms underlying addiction but also for developing of new pharmacological means to reverse the addictive state, prevent relapse, or reduce the use of these drugs (24).
We aimed to study the behavior of rats upon treatment with mitragynine, the main alkaloid constituent of kratom. Subsequently, the brain protein profile of the animals will be compared to the untreated rats to identify the differential expression of proteins. Such protein(s) is hoped to provide information on the possible mechanism of dependence or addiction on mitragynine, or both, which have not been documented.
Materials and methods
Animals
Animal study was carried out in compliance with the Institutional Animal Care and Use Committee rules and regulations [Reference number: USM/Animal Ethics Approval/2020/ (125) (1091)]. The rats were purchased from Universiti Sains Malaysia's Animal Research and Service Centre (ARASC) in Penang, Malaysia. A total of 48 male Sprague-Dawley rats (weighing 200 to 300g) were tested. They were naive and only utilized in one experiment. Under typical laboratory circumstances, they were socially housed in groups of 4 per cage in a temperature-controlled environment (24 ± 1 C). The room was kept on a standard 12 h light/12 h dark cycle. Before the experiments, the animals were handled for a week. Food and drink were freely available.
Drug preparation
Mitragynine was extracted, separated, and validated from fresh Mitragyna speciosa leaves at the Centre for Drug Research, University Sains Malaysia, Penang, Malaysia. High-performance liquid chromatography (HPLC) and proton nuclear magnetic resonance (1H-NMR) (400 MHz) examinations showed 98 percent mitragynine purity (10,25). Mitragynine was dissolved in Tween 80 (20% v/v) as a vehicle. The doses of mitragynine (1 and 30 mg/kg) were given intraperitoneally.
Experimental design
Experiment I: Groups design
Pilot research was undertaken to determine the mitragynine behavioral implications (26). Daily injections of mitragynine (1, 30 mg/kg) and morphine (10 mg/kg) were given for 1 and 4 days in separate groups of rats. Selection of treatment durations were based on previous studies by Effendy et al. (2021) and Yusoff et al. (2014) (26,27). Tween 80 (20%) was injected into the negative control group. The behavioral signs were assessed and recorded for 30 minutes after 1 hour of mitragynine, morphine, and Tween 80 (20%) treatments.
Assessment of motor activities and indicators of dependence and addiction
One hour after the last treatment doses, the recording began. For 30 minutes, rats were placed in an open field test box (Automated open field, Pan Lab, USA), and withdrawal behavior was assessed. Chewing, head shakes, exploring, digging, yawning, teeth chattering, wet dog shakes, writhing, and test indicators such as squeaking on touch, hostility on handling, and diarrhea were included in behavioral scoring to determine physical dependency. Counted and checked signs were evaluated using the previously described scoring technique. The findings were multiplied by the relevant weighting factors to determine the intensity of addictive behaviors (10,28,29).
Behavioral analysis
The data were presented as mean ± standard error of the mean (SEM). Paired Student's t-test was used for open field test and Two-way ANOVA was used for counter and sign checks. In addition, One-way ANOVA was used to assess the global behavior scores. A significance level of p < 0.05 was used to test for statistical significance. GraphPad Prism 9.0 software (GraphPad Software Inc., La Jolla, CA, USA) was used to perform the statistics.
Experiment II: Proteomic analysis of brain samples from treatment groups
Rats' brain collection
All rats treated with mitragynine, and control groups were sacrificed with pentobarbital (60 mg/kg, i.p.) an hour after the final treatment (26). The brains were collected as soon as possible and cleaned in normal saline before being shocked frozen in liquid nitrogen. The fatty layer around the brain was carefully removed to avoid undesirable influence during protein analysis. The tissues were stored at -80°C for further examination.
Brain Protein extraction
Three hundred microliters of Thiourea Lysis Buffer (TLB) [8 mM urea, 2 mM thiourea, 4 % (w/v) 3- [(3- cholamidopropyl) dimethylammonio] pH 3-10, 50mM, -1-propanesulfonate hydrate (CHAPS), 0.4 percent (w/v) carrier ampholytes 1,4-dithiothreitol (DTT)] was added at a ratio of 1:1.5 to 0.2 g of brain powder; tissue (weight): buffer (volume). Using a hand plastic homogenizer, the mixture was homogenized in an icebox, the mixture was centrifuged for 35 minutes at 14,000 rpm. The supernatant was collected and stored at -80 °C. One hundred mL of brain protein extract was added with 0.8 mL cold acetone containing 20 mM dithiothreitol (DTT). Trichloroacetic acid (TCA) in 100 mL was added to the mixture and thoroughly stirred. The mixture was then incubated for 100 minutes at -20°C. After incubation, the mixture was centrifuged for 15 minutes at 4°C at 14,000 rpm. The pellet was recovered, washed three times in cold acetone with 0.5 mL of 20 mM DTT. It was then centrifuged at 14,000 rpm for 15 minutes at 4°C. The pellet was air-dried for 30 minutes. The pellet was then reconstituted in 150 mL of TLB buffer. The mixture was incubated for 2 hours at 4°C and thoroughly mixed by brief vertexing for 20 min. The mixture was then centrifuged at 13,000 rpm for 15 minutes at 4°C. After centrifugation, the supernatant was collected in a microcentrifuge tube and subjected to protein concentration determination using an RC-DC protein assay (Bio-Rad, USA).
Two-dimensional polyacrylamide gel electrophoresis (2D-PAGE)
Six hundred µg of the protein extract in 125 µL TLB buffer containing a trace amount of Bromophenol Blue was passively rehydrated unto a 7 cm 4-7 immobilized pH gradient (IPG) strip (Bio-Rad, USA) for 15 hours. The IPG strip was then transferred to PROTEAN i12 IEF Cell (Bio-Rad, USA) for the focusing process (30). The focusing protocol followed (31) with slight modification as follow: 150V rapid climb for 1 h, 200V with a linear climb for 1 h, 500V with a linear climb for 1 h, 4000V with a linear climb for 2 h, 4000V with a linear climb until 10,000V was reached and then hold at 500V. After focusing, the IPG strip was treated with equilibration buffer I (6 M urea, 0.375 M Tris pH 8.8, 2% SDS, 20% glycerol, and 2% DTT) and subsequently with equilibration II (6 M urea, 0.375 M Tris pH 8.8, 2% SDS, 20% glycerol, and 2.5% iodoacetamide). The second-dimension separation was carried out on 12% SDS-PAGE using a constant voltage of 160 V throughout the run. The gel was stained using Coomassie Blue solution (0.01% Coomassie brilliant blue R250, 45% (v/v) methanol and 10% (v/v) glacial acetic acid) for 30 min at room temperature and distained with 50% (v/v) methanol and 2% (v/v) acetic acid for until the gel background turned colorless.
In-gel digestion
In-gel digestion of the target protein spots was performed according to the method of (32) . A clean blade was used to remove the spots from the gel. The excised gel fragments were rinsed for 10 minutes with 100 mM ammonium bicarbonate (NH4HCO3). After the buffer was discarded, the gel fragments were dehydrated using acetonitrile (ACN), then discarded after 5 minutes. The gel fragments were vacuum dried in a centrifuge (Eppendorf, Germany). The dehydration and washing processes were performed four times. Finally, the gel fragments were vacuum centrifuged to dry completely (Eppendorf, Germany). The dried gel fragments were soaked in 30 µl of 100 mM ammonium bicarbonate containing 10 mM DTT for an hour in a water bath at 56 °C. After removing the supernatant, the gel fragments were incubated for 45 minutes at room temperature in the dark in 30 µl of 100 mM ammonium bicarbonate containing 55 mM iodoacetamide. The previous steps of hydration and dehydration were repeated twice. Then, in digestion buffer (50 mM NH4HCO3, 5 mM CaCl2), 15 ng/µL trypsin was added to the gel pieces and incubated on ice for 1 hour. After discarding the trypsin solution, a volume of digestion buffer without trypsin was added to cover the gel pieces and incubated overnight at 37°C. The next day, the supernatant was collected into a clean vial, and peptides were extracted from the gel fragments using four cycles of 5% (v/v) formic acid in a 7:3 ACN: dH2O solution. Each cycle involved incubating gel fragments for 20 minutes before spinning them down and collecting the supernatant. All supernatants were recovered and dried at 37°C under a constant nitrogen gas flow.
LC/MS/MS analysis
The dried material was reconstituted with 30 µl of 0.1 % formic acid in HPLC grade water prior to LC/MS/MS analysis. The LC/MS/MS analysis was carried out using a Finnigan LTQ LC/MS/MS Easy-nLC II (Thermo Scientific, USA) system, with minor modifications to the method reported by Choi et al., 2015 (33). Easy column C18 (10cm, 0.75mm i.d., 3µm; Thermo Scientific, San Jose, CA, USA) was conditioned at a flow rate of 0.3µl/min for 4 µl, whereas Easy column C18 (2cm 0.1mm i.d., 5µm; Thermo Scientific, San Jose, CA, USA) was used as the pre-column, it was conditioned at a flow rate of 3 µl/min for 15µl. The running buffers A and B were 0.1% FA in deionized water and 0.1% FA in acetonitrile, respectively. Fifteen µl of samples were injected into the columns and separated in 30 minutes at a flow rate of 0.3 µl/min with a gradient of 5 % to 100 % solvent B. With a capillary temperature of 220 °C and a source voltage of 2.1 kV, the eluent was interphase to the mass spectrometer. Peptides were identified using data-dependent LC/MS/MS with full scan mass analysis from m/z 300-2000 at a resolving power of 60,000. (ITMS). Charge states that were single or unassigned were discarded. Collision-induced dissociation was utilized as the fragmentation approach, with a collision energy of 35. Database matching was carried out using PEAKS studio Version 7 (Bioinformatics Solution, Waterloo, Canada). Peptide matching was performed using a database acquired from Uniport. Fixed alterations were Carbamidomethylation and oxidation. The maximum number of miss-cleavages was set to two, and the maximum number of variables after translation medication was set to three.
Western blot
Protein extraction was conducted with 1 mL of lysis buffer [0.5 M Tris-HCl (pH 7.5), 50 μL of 1 M magnesium chloride (MgCl2), 10 μL of 1 M dithiothreitol (DTT), 100 μL of 0.2 M sodium orthovanadate (Na3OV4), 100 µL of Triton-X 100, 8.4 mL of deionized water, and 400μL of protease inhibitor cocktail]. The brain tissue was then homogenized on ice at a 1 g of brain tissue ratio per 9 mL of ice-cold lysis buffer (34) until the tissue powder was thoroughly lysed. The samples were centrifuged for 10 minutes at 8000 g at 4°C. The supernatant was transferred to a new tube. The protein content was determined using RCDC method (Bio-Rad). The supernatants were split into small aliquots and kept at -80°C deep freezer until analysis. SDS-PAGE was used to separate proteins from 30 μg of protein samples loaded onto a polyacrylamide gel using Laemmli method (35). The gel was soaked in cold transfer buffer [25 mM Tris, 192 mM Glycine, and 20% (v/v) methanol] for 30 minutes while nitrocellulose membrane (0.45μm) and blotting papers of 8.0 x 7.4 cm in size (Bio-Rad, USA) were soaked in transfer buffer for 30 min. Wet blotting was used to transfer proteins from gel to nitrocellulose membrane at 90 volts for 45 minutes. The membrane was then rinsed with washing buffer Tris-buffered saline/ Tween 20 (TBST) and gently agitated for 1 hour at room temperature with blocking buffer [5 % Blocker casein (skim milk) in TBST]. After blocking, the membrane was rinsed with washing buffer (TBST) three times. The membrane was then soaked in 1:1000 dilution of TBST rabbit anti-calretinin (Invitrogen, Thermo Fisher Scientific - US) at 4°C overnight with gentle agitation. After being washed three times with washing buffer, the membrane was socked in 1:2000 dilution of TBST goat anti-rabbit antibody (Invitrogen, Thermo Fisher Scientific - US) for 90 minutes at room temperature with gentle agitation. Finally, the membrane was treated with Opti-4CN substrate (Bio-Rad, USA) for 15 minutes with gentle shaking until the protein band was visualized.
Statistical Analysis
Image analysis
ChemiDocTM Imaging System (Bio-Rad, USA) was used to capture all the 2D gel images. The images were analyzed using PDQuest Software version 7.3. (Bio-Rad, USA). 2D-gel images of protein isolated from the controls and treatment groups were used to create match sets. The standard and differentially expressed protein spots were compared and identified between the negative control and treatment groups. All of the gel images were normalized to minimized background interference. Every protein spot's intensity was calculated as a percentage of the overall intensity of valid spots. Differential protein expression was evaluated using protein spot intensity analyzed using One-way ANOVA at p<0.05 significance level.
Results
Experiment 1: Assessment of motor activity and addictive behaviors
The open-field test was performed one hour following treatments with the vehicle, mitragynine (1 and 30mg/kg), and morphine (10mg/kg) on days 1 and 4 for a period of 30 minutes. Spontaneous movement and activity of the animal were measured after drugs consumption. Tasks such as total distance travelled, total activity, locomotor activity, mean velocity, stereotypic (repetitive) movements, and rearings were recorded (Fig 1A to F). Paired Student's t-test showed no significant differences in total distance travelled (p = 0.125, Fig. 1A), total activity (p = 0.125, Fig. 1B), locomotor activity (p = 0.125, Fig. 1C), mean velocity (p = 0.125, Fig. 1D), stereotypic behavior (p = 0.25, Fig. 1E), and number of rearing (p = 0.125, Fig. 1F).
Effects of vehicle, morphine (10mg/kg) and mitragynine (1 and 30mg/kg) treatments on motor activities using automated open-field task on A) total distance travel, B) total activity, C) locomotor activity, D) mean velocity, E) stereotypic and F) number of rearing. Data are expressed as mean ± SEM from rats (n = 6-8) per group and analyzed using the unpaired Student t-test.

Two-way ANOVA revealed significant behavioral score for head shakes in the group treated with morphine 10 mg/kg for 4 days (p = 0.0495); writhing in the groups treated with mitragynine 1 mg/kg and 30 mg/kg for 4 days (p = 0.0495), and morphine 10 mg/kg for 4 days (p = 0.0495). The results of the one-way ANOVA revealed a significant treatment between groups with F (6, 21) = 2.796; p = 0.0369 for the global withdrawal scores (Table 1).
Results of the counted and checked signs for evaluation of the severity of withdrawal signs for negative control, mitragynine (MIT) (1 and 30mg/kg) and morphine (Mor)(10mg/kg) for days 1 and 4. Data are expressed as mean ± SEM from rats (n = 6-8) per group and analyzed using Two-way ANOVA.
| Days | Day 1 | Day 4 | ||||||
|---|---|---|---|---|---|---|---|---|
| Behavioral activity | Negative Control | MIT 1mg/kg | MIT 30mg/kg | Mor 10mg/kg | Negative Control | MIT 1mg/kg | MIT 30mg/kg | Mor 10mg/kg |
| Chewing | 2 ± 0.00 | 1 ± 057 | 3.5 ± 0.95 | 2 ± 0.00 | 2 ± 0.00 | 1.5 ± 0.5 | 4 ± 0.81 | 3 ± 0.57 |
| Head shakes | 4± 0.816 | 5 ± 1.29 | 4 ± 1.41 | 2.5 ± 0.5 | 4± 0.820 | 4.5 ± 0.95 | 5.5 ± 0.95 | 1 ± 0.57 * |
| Exploring | 1 ± 0.00 | 1 ± 0.00 | 1 ± 0.00 | 1 ± 0.00 | 1 ± 0.00 | 1 ± 0.00 | 1 ± 0.00 | 1 ± 0.00 |
| Digging | 0.00 ± 0.00 | 0.00 ± 0.00 | 0.00 ± 0.00 | 0.00 ± 0.00 | 0.00 ± 0.00 | 0.00 ± 0.00 | 0.00 ± 0.00 | 0.00 ± 0.00 |
| Yawning | 0.00 ± 0.00 | 0.00 ± 0.00 | 0.00 ± 0.00 | 0.00 ± 0.00 | 0.00 ± 0.00 | 0.00 ± 0.00 | 0.00 ± 0.00 | 0.00 ± 0.00 |
| Teeth chattering | 0.5± 0.5 | 0.5 ± 0.5 | 0.00 ± 0.00 | 0.00 ± 0.00 | 0.5± 0.5 | 0.5 ± 0.5 | 0.00 ± 0.00 | 0.00 ± 0.00 |
| Wet dog shakes | 0.00 ± 0.00 | 0.5 ± 0.5 | 0.5 ± 0.5 | 0.00 ± 0.00 | 0.00 ± 0.00 | 0.5 ± 0.5 | 0.00 ± 0.00 | 0.00 ± 0.00 |
| Writhing | 6 ± 0.81 | 5.5 ±1.25 | 1 ± 0.5* | 1± 0.57* | 6 ± 0.82 | 3± 0.57 * | 1± 0.57* | 3.57 ± 0.57 * |
| Squeaking on touch | 0.00 ± 0.00 | 0.25± 0.25 | 0.00 ± 0.00 | 0.00 ± 0.00 | 0.00 ± 0.00 | 0.5 ± 0.28 | 0.00 ± 0.00 | 0.00 ± 0.00 |
| Hostility on handling | 0.5 ± 0.288 | 0.5 ± 0.28 | 0.5 ± 0.28 | 0.5 ± 0.28 | 0.5 ± 0.283 | 0.5± 0.28 | 0.25 ± 0.25 | 0.25 ± 0.25 |
| Diarrhea | 0.00 ± 0.00 | 0.00 ± 0.0 | 0.00 ± 0.00 | 0.00 ± 0.00 | 0.00 ± 0.00 | 0.00 ± 0.00 | 0.25 ± 0.25 | 0.00 ± 0.00 |
Experiment 2: Proteomic analysis of brain samples
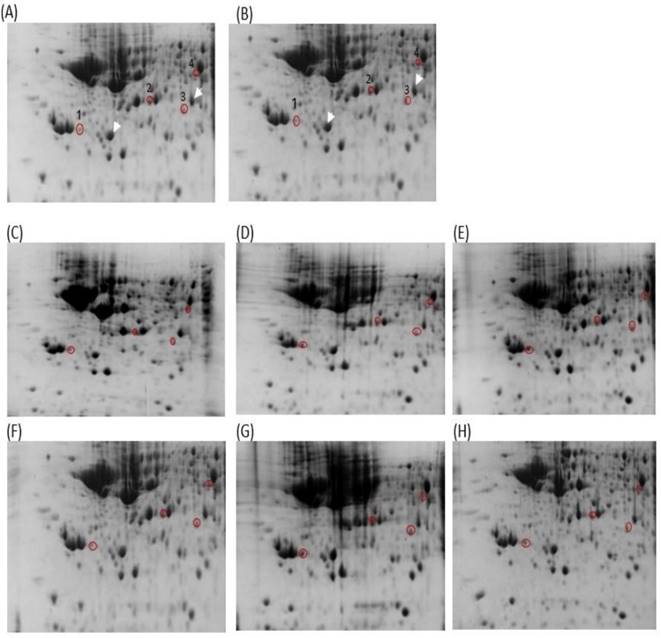
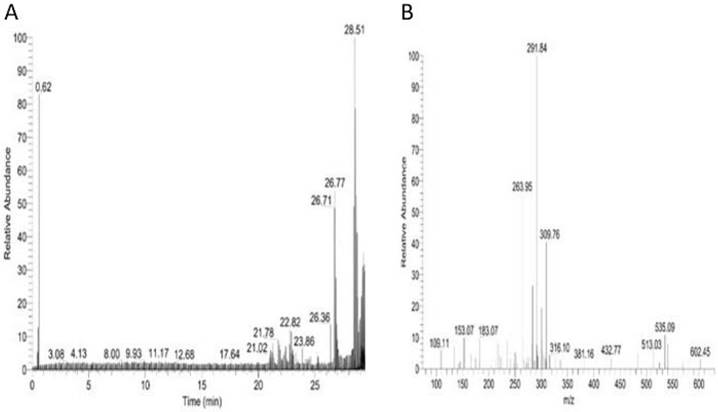
This study analyzed the proteome of proteins extracted from brain tissues that were separated by 2D gel electrophoresis. The brain proteomes of rats treated with mitragynine, and morphine (positive control) were compared to those of negative control rats. The upregulated calcium-binding proteins from the brain proteome of the low dose (1 mg/kg) and the high dose (30 mg/kg) of mitragynine treated rats were circled in red (Fig. 3). Compared to the negative control rats, these protein spots were found significantly upregulated and consistently presented with > 2 folds intensity in all the animals. These protein spots were excised from the gel and subjected to in-gel digestion with trypsin enzyme, and LC-MS/MS analysis was performed on the digested protein fragments. Table 2 shows the identity of the four protein spots, the proteins were calretinin, F-actin, annexin A3 and beta-centractin. For 1 day and 4 days treatment groups, the expression of these four proteins in the low dose (1 mg/kg) and high dose (30 mg/kg) mitragynine rats was consistently presented with significantly upregulation intensity (p<0.05) in all the rats. Fig. 4 shows an example of the MS and MS/MS spectrum, respectively, for calretinin.
List of up-regulated calcium-binding proteins detected in TLB extract.
| NO. | Protein ID | Protein name | Accession | Protein function |
|---|---|---|---|---|
| 1 | 299787 | Calretinin | P47728|CALB2 | the modulator of neuronal excitability including the induction of long-term potentiation. |
| 2 | 308407 | F-actin | Q3T1K5|CAZA | cell stability and morphogenesis. |
| 3 | 300852 | Annexin A3 | P14669|ANXA3 | differentiation, cell migration, immune regulation, and bone formation |
| 4 | 309415 | Beta-centractin | Q8R5C5|ACTY | cellular functions |
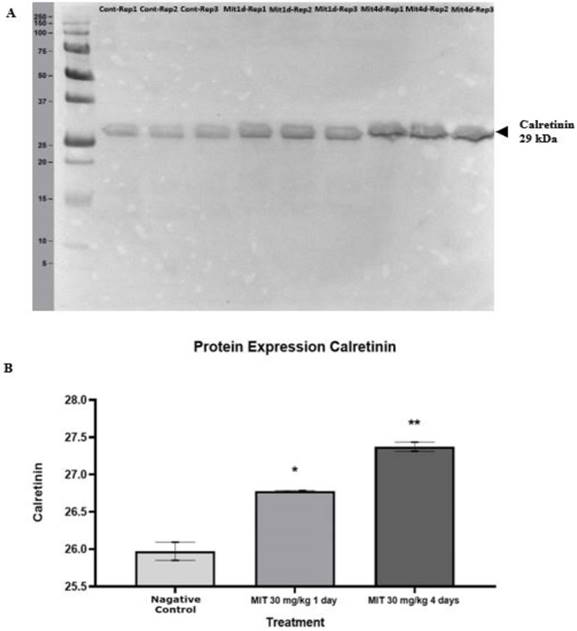
Table 3 shows the protein expression levels of the four calcium-binding proteins according to their spot intensity. Each gel was loaded with an equal quantity of protein (600 µg). Analysis on the intensity of the protein spots showed that at 1 day treatment with mitragynine at low and high doses, significant changes in the intensity of all the four calcium binding protein spots (p<0.05) was observed when compared to the negative control group. Similarly, for 4 days treatment with mitragynine, both the low and high doses caused significant up-regulation (p<0.05) in the calcium binding proteins' expression levels as indicated by spot intensities of the four proteins when compared to the negative control group. When comparing between day 1 and day 4 treatments, the expression of these proteins was found significantly higher in day 4 treatments groups for both low and high doses of mitragynine when compared to their corresponding treatments groups in day 1. When comparing within the day 1 treatments groups, there was no significant difference in the intensity of the proteins in low and high doses of mitragynine. On the contrary, the 4 days treatments groups showed a significant upregulation (p<0.05) of all the four calcium-binding proteins at high dose of mitragynine compared to low dose mitragynine. The Western blot experiment confirmed the identity of calretinin. The calretinin antibody was found binding to the calretinin band at 29kDa (Fig. 5A). The binding of the calretinin antibody to the calretinin band, as shown by the intensity, indicated that a higher expression of calretinin was detected in the treatment groups. Fig.5B shows the bar chart of calretinin expression in negative control, and high dose of mitragynine for 1 day and 4 days treatment. The data showed that at 30 mg/kg high dose of mitragynine, the expression of calretinin was significantly higher (p<0.05) in 4 days treatment compared with 1 day treatment and the negative control group.
The protein expression levels of the four calcium-binding proteins according to their spot intensity.
| Groups | Calretinin | F-actin | Annexin A3 | Beta-centractin | |
|---|---|---|---|---|---|
| 1 day | Negative Control | 1641±0.56 | 1297±0.35 | 1537±0.7 | 1354±0.29 |
| Morphine 10 mg/kg | 4243±1.00*** | 4803±0.017*** | 4491±0.61*** | 4211±0.82*** | |
| Mitragynine 1 mg/kg | 2490±1*** | 2515±0.76*** | 2781±0.45*** | 2291±0.93** | |
| Mitragynine 30 mg/kg | 2835±0.95*** | 3020±1.00*** | 2385±0.87** | 3031±0.76*** | |
| 4 days | Negative Control | 1599±0.90 | 1312±0.55 | 1579±0.90 | 1299±0.77 |
| Morphine 10 mg/kg | 5490±0.59*** | 6926±0.91*** | 5216±1.50*** | 4089±2.00*** | |
| Mitragynine 1 mg/kg | 3477±0.63*** | 3536±0.34** | 2551±0.55* | 2471±0.89*** | |
| Mitragynine 30 mg/kg | 4145±0.57*** | 3369±0.33** | 2792±1.00** | 2938±0.70*** | |
Discussion
Mitragynine made up 66% of the total alkaloids content in kratom (11). Although mitragynine binds to opioid receptors, this indole alkaloid is structurally and pharmacodynamically different from its opioid rival. Therefore it is identified as atypical opioid that distinguishes it from morphine, semisynthetic opioids, and endogenous ligands (36). Upon binding to opioid receptors, the indole alkaloid activates G-protein-coupled receptors (GPCRs). Nevertheless, unlike conventional opioids, indole alkaloids do not initiate the β-arrestin pathway when they activate GPCRs (37). β-arrestin recruitment is responsible for the symptoms of opioid use, such as respiratory depression, sleepiness, and constipation (38,39). Kratom, like opioids or some stimulants, may cause dependency (40). In view of the high quantity of indole alkaloid content of kratom, kratom addiction mechanism pathway may not be identical to those of conventional opioids. Nevertheless, the use of single alkaloid of kratom poses limitation to this study. The data presented here may not fully illustrate the effects of kratom on animal behavior or brain proteome changes caused by kratom consumption, although the study of singular alkaloid (mitragynine) would have the advantages of isolating the effects of this single alkaloid.
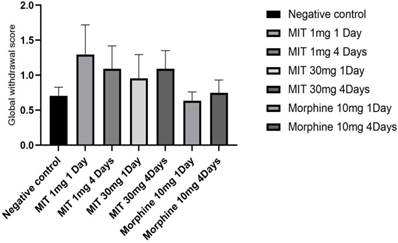
In this study, the behavioral responses of rats to single and multiple doses of mitragynine at low (1mg/kg) and high (30mg/kg) doses were evaluated and subsequently the differential brain proteins expressions of the rats were analysed. The rats' behavior was recorded and scored day 1 after a single dose (both high and low doses) or day 4 following repeated administration of mitragynine (both high and low doses). Morphine was used as the positive control substance to study the behavioral changes of the animal upon treatment with addictive substance. There were no significant differences in motor activity of rats between single and repeated mitragynine treatment by using open field tasks. Nevertheless, both rats in low and high mitragynine doses showed slightly reduce motor activity on day 4. The severity of withdrawal after a single and repeated doses of mitragynine was evaluated to assess animal physical dependence. The behavioral scoring data revealed that the rats developed physical dependence only on day 4 following morphine and mitragynine (1 and 30mg/kg) treatments. This is seen when the number of writhing decreases dramatically compared to the negative control. The morphine and mitragynine treatments groups reduced withdrawal discomfort following a single (high dose) and repeated (both doses) therapy by lowering the number of writhes. In order to reduce variability and to improve dependability of the results, single behavior scores were calculated and translated into a global withdrawal score (Figure 2), where no significant difference was found between the groups (p>0.05).
Single behavior ratings were generated and translated into a global withdrawal score to reduce variability and increase the reliability of withdrawal signs outcomes. Data are expressed as mean ± SEM from rats (n = 6-8) per group and analyzed using one-way ANOVA.
2D gel images of Thiourea Lysis Buffer (TLB) extracts: (A) negative control 1 day, (B) negative control 4 days, (C) mitragynine (MIT) 1 day (1mg/kg), (D) MIT 1 day (30 mg/kg), (E) morphine 1 day (10 mg/kg), (F) MIT 4 days (1mg/kg), (G) MIT 4 days (30 mg/kg), (H) morphine 4 days (10 mg/kg). The white arrow denoted the landmark used in gel image analysis. Red circles denoted the up-regulated proteins. The spot number was labeled accordingly to the protein listed in Table 2.
LC/MS/MS analysis for brain calretinin. Panel A. shows the total ion chromatogram of brain calretinin; Panel B. shows an MS/MS spectrum of one of the peptides of brain calretinin.
(A) The Western blot analysis of the calretinin at 29 kDa extracted from rats' brain tissues. (B) A statistical representation of Western blot analysis of the protein expression. Calretinin expression in mitragynine (30 mg/kg) treated groups (1st day * p < 0.05, 4th day ** p < 0.01) was significantly higher compared to negative control group.
In the second part of the study, the brains of the rats were harvested, and their brain proteome were analyzed using 2D gel electrophoresis. The brain proteomes of the morphine and the treatments groups at low dose (1 mg/kg) and high dose (30 mg/kg) of mitragynine for day 1 and day 4 revealed that a few protein spots were expressed at higher intensity compared to the negative control group. The protein spots were excised from the gel and subjected to mass spectrometry analysis. Among these proteins, four belonged to calcium-binding proteins. All these protein spots were consistently present at higher intensities in the mitragynine and morphine groups when compared to the negative control group at significant levels (p<0.05). These calcium-binding proteins were calretinin, F-actin, annexin A3 and beta-centractin. When comparing between days of treatment, the 4 days treatment group showed a significantly (p<0.05) higher expression of the proteins for both low and high doses of mitragynine than the day 1 treatment groups. When comparing between low and high doses mitragynine treatments on the same day, the high dose mitragynine treatment for day 4 showed a significant (p<0.05) upregulation of all the four proteins compared to the low dose mitragynine. In contrary, on 1 day treatment groups, there was no significant difference in protein expression in both doses of mitragynine treatments.
Our previous study by Hassan et al., (2019) (10) stated the importance of Ca2+ influx in the initiation of the most forms of long-term potentiation (LTP) and short-term potentiation, which included changes in the postsynaptic calcium levels, such as those seen during LTP induction. Another study by Matsumoto et al. (2005) (41) reported that mitragynine blocks T- and L-type Ca2+ channel currents and reduces KCl-induced Ca2+ influx in neuroblastoma cells. Based on these findings, changes in Ca2+ signaling showed to be responsible for the impairments in hippocampal transmission and plasticity and memory acquisition observed with mitragynine administration. Hence, Ca2+ plays a significant pharmacological role in mitragynine treatment rats. Consequently, the up-regulation of the brain's calcium binding proteins that were reported in this study may be the result of the lowering of Ca2+ concentration due to the blocking of the Ca2+ ion channel upon ingestion of mitragynine. Both annexins (42) and actin (43) are involved in Ca2+ channels regulation, while centractin is characterized as actin-related protein (44). All these proteins were detected up-regulated in our current study.
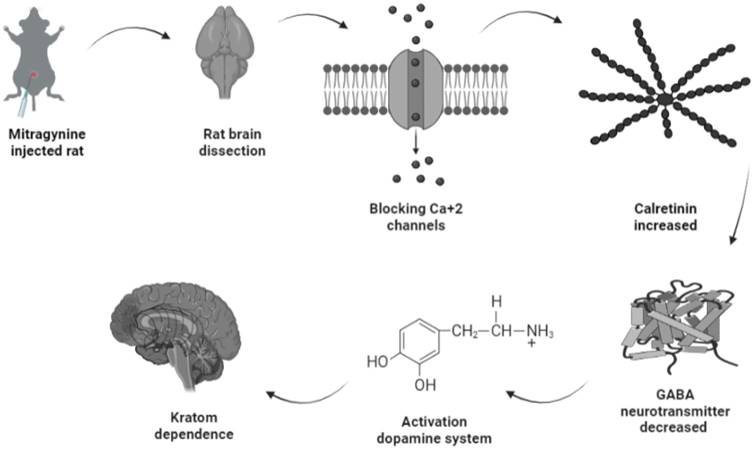
Amongst the four upregulated calcium-binding proteins, calretinin is expressed on the excitability neurons (45). Structurally, calretinin is a calcium-binding protein which contains 6 EF-hand domains, four of them bind to Ca2+ with high affinity, one is not binding to Ca2+, while one was non-functional and without Ca2+ binding affinity (46,47). With such a characteristic, calretinin shares some kinetic properties of both slow and fast buffers in modifying dendritic Ca2+ transients (48). Upon binding of Ca2+ to calretinin, the mammalian neuronal cytoplasmic concentration of calretinin was estimated to be in order of tens of micromoles (49) and it was shown to be highly concentrated beneath the cell membrane (50), which affects intracellular calcium signals both pre- and postsynaptically (51-55). One putative biological function of calretinin was its role in the modulation of neuronal excitability. Modulation of calcium signaling by calretinin has been reported to play a critical role for precise timing and plasticity of synaptic events in neuronal networks (45). A study by Schurmans et al., (1997) (51) has reported that LTP induction of mice lacking calretinin (calretinin -/- null mutant mice) was impaired following tetanic stimulation of hippocampal inputs. LTP of excitatory synaptic responses of principal neurons in the hippocampus is accompanied by changes in GABAergic inhibition mediated by interneurons (56). Therefore, upregulation of calretinin in the mitragynine treated rats as reported by this current study will concomitantly strengthen LTP induction and thus results in reduction of GABA neurotransmitter being released. This will inversely induce the secretion of dopamine neurotransmitter unto granule cells. While activation of dopamine system was reported to play a role in several behavioral including depression, ADHD, and various forms of addiction (57), which may explain the dependence of rats to mitragynine as displayed by their behaviors. The demonstration of this possible pathway of mitragynine dependence is described in Fig. 6.
Possible pathway of kratom dependence.
Systems that regulate intracellular Ca2+ levels are part of the complex Ca2+ signaling network. They include gated Ca2+ channels, energy-dependent pumps, and intracellular Ca2+ binding proteins that act as controlled Ca2+ buffers. Amongst these, Ca2+ binding proteins are more directly involved in Ca2+ signaling because their characteristics change in response to Ca2+ binding (58). Furthermore, neuroprotective effect of calretinin against cellular damage mediated by very low Ca2+ concentration has been described (59,60). The upregulation of calretinin may indicate its neuroprotective effect towards the cellular damage in the condition of inhibition of Ca2+ influx to the cellular system by treatment with mitragynine.
It was showed in this study that the opioid effects of mitragynine as referenced to the positive control substance, morphine, causing behavioral changed in the rats only at high dose for 1 day treatment or 4 days continuous administration of mitragynine at high and low doses. These concentrations of mitragynine may be needed to cause an upregulation of calretinin to a threshold that manifested as drug dependence behaviors similar to those of morphine.
Conclusion
The upregulation of calcium-binding proteins may be the direct response of the brain to the lack of Ca2+ in the brain upon mitragynine ingestion by the treatment rats. The upregulation of calretinin may potentially explain the cellular mechanism to regular or high dose mitragynine ingestion which correlated to the dependence behavior of the rats. This possible mechanism of mitragynine dependence behavior will be further investigated in our future study.
Acknowledgements
Funding
We would like to express our gratitude to the grant provider, Ministry of Higher Education Malaysia for the Fundamental Research Grant Scheme with Project Code: FRGS/1/2020/STG02/USM/01/1. We would also like to acknowledge the support of the Higher Education Centre of Excellence (HiCoE) PHASE II special funding (304/CDADAH/4401009).
Ethical Approval
All animal studies were carried out in compliance with the Institutional Animal Care and Use Committee rules and regulations [Reference number: USM/Animal Ethics Approval/2020/ (125) (1091)].
Author Contributions
MB: Performed the experiments; Analyzed and interpreted the data; Wrote the first draft of the manuscript.
ZH: Analyzed and interpreted the data; Contributed reagents, materials, analysis tools or data.
LHG: Conceived and designed the experiments; Contributed reagents, materials, analysis tools or data; Edit the manuscript.
Competing Interests
The authors have declared that no competing interest exists.
References
1. Boyer EW, Babu KM, Adkins JE, McCurdy CR, Halpern JH. Self-treatment of opioid withdrawal using kratom (Mitragynia speciosa korth). Addiction. 2008;103(6):1048-50
2. Singh D, Müller CP, Vicknasingam BK, Mansor SM. Social Functioning of Kratom (Mitragyna speciosa) Users in Malaysia. J Psychoactive Drugs. 2015;47(2):125-31
3. Grundmann O, Veltri CA, Morcos S, Smith KE. Correlations of Kratom ( Mitragyna speciosa Korth.) Use Behavior and Psychiatric Conditions from a cross-sectional survey. 2022
4. Smith KE, Rogers JM, Dunn KE, Grundmann O, McCurdy CR, Schriefer D. et al. Searching for a Signal: Self-Reported Kratom Dose-Effect Relationships Among a Sample of US Adults With Regular Kratom Use Histories. Front Pharmacol. 2022;13(March):1-17
5. Smith KE, Rogers JM, Schriefer D, Grundmann O. Therapeutic benefit with caveats?: Analyzing social media data to understand the complexities of kratom use. Drug Alcohol Depend. 2021;226(June):108879
6. Ahmad K, Aziz Z. Mitragyna speciosa use in the northern states of Malaysia: A cross-sectional study. J Ethnopharmacol. 2012;141(1):446-50 http://dx.doi.org/10.1016/j.jep.2012.03.009
7. Hassan R, Othman N, Mansor SM, Müller CP, Hassan Z. Proteomic analysis reveals brain Rab35 as a potential biomarker of mitragynine withdrawal in rats. Brain Res Bull. 2021;172(January):139-50 https://doi.org/10.1016/j.brainresbull.2021.04.018
8. Kuehn B. Kratom Related Deaths. JAMA. 2019 321; 21(20)
9. Singh D, Damodaran T, Prozialeck WC, Grundmann O, Karunakaran T, Vicknasingam B. Constipation prevalence and fatigue severity in regular kratom (Mitragyna speciosa Korth.) users. J Subst Use. 2019;24(3):233-9 https://doi.org/10.1080/14659891.2018.1546340
10. Hassan Z, Suhaimi FW, Ramanathan S, Ling KH, Effendy MA, Müller CP. et al. Mitragynine (Kratom) impairs spatial learning and hippocampal synaptic transmission in rats. J Psychopharmacol. 2019;33(7):908-18
11. Hassan Z, Muzaimi M, Navaratnam V, Yusoff NHM, Suhaimi FW, Vadivelu R. et al. From Kratom to mitragynine and its derivatives: Physiological and behavioural effects related to use, abuse, and addiction. Neurosci Biobehav Rev. 2013;37(2):138-51
12. León F, Habib E, Adkins JE, Furr EB, McCurdy CR, Cutler SJ. Phytochemical characterization of the leaves of Mitragyna speciosa grown in USA. Nat Prod Commun. 2009;4(7):907-10
13. Orio L, Alexandru L, Cravotto G, Mantegna S, Barge A. UAE, MAE, SFE-CO2 and classical methods for the extraction of Mitragyna speciosa leaves. Ultrason Sonochem. 2012;19(3):591-5 http://dx.doi.org/10.1016/j.ultsonch.2011.10.001
14. Kamble SH, Sharma A, King TI, León F, McCurdy CR, Avery BA. Metabolite profiling and identification of enzymes responsible for the metabolism of mitragynine, the major alkaloid of Mitragyna speciosa (kratom). Xenobiotica. 2019;49(11):1279-88 https://doi.org/10.1080/00498254.2018.1552819
15. Obeng S, Wilkerson JL, León F, Reeves ME, Restrepo LF, Gamez-Jimenez LR. et al. Pharmacological comparison of mitragynine and 7-hydroxymitragynine: In vitro affinity and efficacy for μ-opioid receptor and opioid-like behavioral effects in rats. J Pharmacol Exp Ther. 2021;376(3):410-27
16. Kruegel AC, Gassaway MM, Kapoor A, Váradi A, Majumdar S, Filizola M. et al. Synthetic and Receptor Signaling Explorations of the Mitragyna Alkaloids: Mitragynine as an Atypical Molecular Framework for Opioid Receptor Modulators. J Am Chem Soc. 2016;138(21):6754-64
17. Matsumoto K, Yamamoto LT, Watanabe K, Yano S, Shan J, Pang PKT. et al. Inhibitory effect of mitragynine, an analgesic alkaloid from Thai herbal medicine, on neurogenic contraction of the vas deferens. Life Sci. 2005;78(2):187-94
18. Tsuchiya S, Miyashita S, Yamamoto M, Horie S, Sakai SI, Aimi N. et al. Effect of mitragynine, derived from Thai folk medicine, on gastric acid secretion through opioid receptor in anesthetized rats. Eur J Pharmacol. 2002;443(1-3):185-8
19. Minami M. Molecular pharmacology of opioid receptors. Folia Pharmacol Jpn. 2004;123(2):95-104
20. Guitart X, Thompson MA, Mirante CK, Greenberg ME, Nestler EJ. Regulation of Cyclic AMP Response Element-Binding Protein (CREB) Phosphorylation by Acute and Chronic Morphine in the Rat Locus Coeruleus. J Neurochem. 1992;58(3):1168-71
21. Wang J, Yuan W, Li MD. Genes and pathways co-associated with the exposure to multiple drugs of abuse, including alcohol, amphetamine/methamphetamine, cocaine, marijuana, morphine, and/or nicotine: a review of proteomics analyses. Mol Neurobiol. 2011;44(3):269-86
22. Nestler EJ. MOLECULAR BASIS OF LONG-TERM PLASTICITY UNDERLYING ADDICTION. Nat Rev Neurosci. 2001 2(February)
23. Baimbridge KG, MILLER JJ, PARKES CO. CALCIUM-BINDING PROTEIN DISTRIBUTION IN THE RAT BRAIN. 1982. p. 519-25.
24. Larsson A, Engel JA. Neurochemical and behavioral studies on ethanol and nicotine interactions. Neurosci Biobehav Rev. 2004;27(8):713-20
25. Jamil MFA, Subki MFM, Lan TM, Majid MIA, Adenan MI. The effect of mitragynine on cAMP formation and mRNA expression of mu-opioid receptors mediated by chronic morphine treatment in SK-N-SH neuroblastoma cell. J Ethnopharmacol. 2013;148(1):135-43
26. Effendy MA, Yunusa S, Zain ZM, Hassan Z. Real time monitoring of dopamine release evoked by mitragynine (Kratom): An insight through electrochemical sensor. Neurosci Lett. 2021;763(July):136183
27. Yusoff NHM, Mansor SM, Müller CP, Hassan Z. Opioid receptors mediate the acquisition, but not the expression of mitragynine-induced conditioned place preference in rats. Behav Brain Res. 2017;332(May):1-6
28. Rahman S, Khan RA, Kumar A. Experimental study of the morphine de-addiction properties of Delphinium denudatum Wall. BMC Complement Altern Med. 2002;2:4-7
29. Sabetghadam A, Navaratnam V, Mansor SM. Doseresponse relationship, acute toxicity, and therapeutic index between the alkaloid extract of mitragyna speciosa and its main active compound mitragynine in mice. Drug Dev Res. 2013;74(1):23-30
30. Lee HH, Lim CA, Cheong YT, Singh M, Gam LH. Comparison of protein expression profiles of different stages of lymph nodes metastasis in breast cancer. Int J Biol Sci. 2012;8(3):353-62
31. Jiang N, Kham SKY, Koh GS, Suang Lim JY, Ariffin H, Chew FT. et al. Identification of prognostic protein biomarkers in childhood acute lymphoblastic leukemia (ALL). J Proteomics. 2011;74(6):843-57 http://dx.doi.org/10.1016/j.jprot.2011.02.034
32. Wai-Hoe L, Wing-Seng L, Ismail Z, Lay-Harn G. Proteomics and detection of uromodulin in first-time renal calculi patients and recurrent renal calculi patients. Appl Biochem Biotechnol. 2009;159(1):221-32
33. Choi JY, Heo S, Yoo GJ, Park SK, Yoon CY, Baek SY. Development and validation of an LC-MS/MS method for the simultaneous analysis of 28 specific narcotic adulterants used in dietary supplements. Food Addit Contam - Part A Chem Anal Control Expo Risk Assess. 2015;32(7):1029-39 http://dx.doi.org/10.1080/19440049.2015.1040080
34. Agbas A, Krishnamurthy P, Michaelis ML, Michaelis EK. Mitochondrial Electron Transfer Cascade Enzyme Activity Assessment in Cultured Neurons and Select Brain Regions. Curr Protoc Toxicol. 2019;80(1):1-34
35. Laemmli UK. Cleavage of Structural Proteins during the Assembly of the Head of Bacteriophage T4. Nature. 1970;227:680-5
36. Raffa RB, Pergolizzi J V, Taylor R, Ossipov MH. Nature's first “atypical opioids”: Kratom and mitragynines. J Clin Pharm Ther. 2018;43(3):437-41
37. Suwanlert S. Erowid.org is a one-of-a-kind resource! A Study of Kratom Eaters in Thailand. Bull Narc. 1975;27(3):21-7 http://www.erowid.org/plants/kratom/kratom_journal3.shtml
38. Raehal KM, Bohn LM. The role of beta-arrestin2 in the severity of antinociceptive tolerance and physical dependence induced by different opioid pain therapeutics. Neuropharmacology. 2011;60(1):58-65 http://dx.doi.org/10.1016/j.neuropharm.2010.08.003
39. Bohn LM, Lefkowitz RJ, Caron MG. Differential mechanisms of morphine antinociceptive tolerance revealed in βarrestin-2 knock-out mice. J Neurosci. 2002;22(23):10494-500
40. Eggleston W, Stoppacher R, Suen K, Marraffa JM, Nelson LS. Kratom Use and Toxicities in the United States. Pharmacotherapy. 2019;39(7):775-7
41. Matsumoto K, Horie S, Takayama H, Ishikawa H, Aimi N, Ponglux D. et al. Antinociception, tolerance and withdrawal symptoms induced by 7-hydroxymitragynine, an alkaloid from the Thai medicinal herb Mitragyna speciosa. Life Sci. 2005;78(1):2-7
42. Lizarbe MA, Barrasa JI, Olmo N, Gavilanes F, Turnay J. Annexin-phospholipid interactions. Functional implications. Vol. 14, International Journal of Molecular Sciences. 2013:2652-2683 p
43. Marston SB, Burton D, Copeland O, Fraser I, Gao Y, Hodgkinson J. et al. Structural interactions between actin, tropomyosin, caldesmon and calcium binding protein and the regulation of smooth muscle thin filaments. Acta Physiol Scand. 1998;164(4):401-14
44. Clark SW, Staub O, Clark IB, Holzbaur ELF, Paschal BM, Vallee RB. et al. β-Centractin: Characterization and distribution of a new member of the centractin family of actin-related proteins. Mol Biol Cell. 1994;5(12):1301-10
45. Camp AJ, Wijesinghe R. Calretinin: Modulator of neuronal excitability. Int J Biochem Cell Biol. 2009;41(11):2118-21
46. Schwaller B, Durussel I, Jermann D, Herrmann B, Cox JA. Comparison of the Ca2+-binding properties of human recombinant calretinin-22k and calretinin. J Biol Chem. 1997;272(47):29663-71
47. Stevens J, Rogers JH. Chick calretinin: Purification, composition, and metal binding activity of native and recombinant forms. Protein Expr Purif. 1997;9(2):171-81
48. Faas GC, Schwaller B, Vergara JL, Mody I. Resolving the fast kinetics of cooperative binding: Ca2+ buffering by calretinin. PLoS Biol. 2007;5(11):2646-60
49. Hackney CM, Mahendrasingam S, Penn A, Fettiplace R. The concentrations of calcium buffering proteins in mammalian cochlear hair cells. J Neurosci. 2005;25(34):7867-75
50. Hack NJ, Wride MC, Charters KM, Kater SB, Parks TN. Developmental changes in the subcellular localization of calretinin. J Neurosci. 2000;20(7):1-5
51. Schurmans S, Schiffmann SN, Gurden H, Lemaire M, Lipp HP, Schwam V. et al. Impaired long-term potentiation induction in dentate gyrus of calretinin-deficient mice. Proc Natl Acad Sci U S A. 1997;94(19):10415-20
52. Schiffmann SN, Cheron G, Lohof A, D'Alcantara P, Meyer M, Parmentier M. et al. Impaired motor coordination and Purkinje cell excitability in mice lacking calretinin. Proc Natl Acad Sci U S A. 1999;96(9):5257-62
53. Gall D, Prestori F, Sola E, D'Errico A, Roussel C, Forti L. et al. Intracellular calcium regulation by burst discharge determines bidirectional long-term synaptic plasticity at the cerebellum input stage. J Neurosci. 2005;25(19):4813-22
54. Cheron G, Servais L, Wagstaff J, Dan B. Fast cerebellar oscillation associated with ataxia in a mouse model of angelman syndrome. Neuroscience. 2005;130(3):631-7
55. Cheron G, Servais L, Dan B, Gall D, Roussel C, Schiffmann SN. Oscillations and Synchrony in Cerebellar Cortex and Inferior Olive. Brain. 2005;148:165-80 http://www.ncbi.nlm.nih.gov/entrez/query.fcgi?cmd=Retrieve&db=PubMed&dopt=Citation&list_uids=15661189
56. Chapman CA, Perez Y, Lacaille JC. Effects of GABA(A) inhibition on the expression of long-term potentiation in CA1 pyramidal cells are dependent on tetanization parameters. Hippocampus. 1998;8(3):289-98
57. Wise RA, Jordan CJ. Dopamine, behavior, and addiction. J Biomed Sci [Internet]. 2021;28(1):1-9 https://doi.org/10.1186/s12929-021-00779-7
58. Chazin WJ. Relating Form and Function of EF-Hand Calcium Binding Proteins WALTER. ACCOUNTS Chem Res'. 2011;44(3):171-9
59. Turner CP, Connell J, Blackstone K, Ringler SL. Loss of calcium and increased apoptosis within the same neuron. Brain Res. 2007;1128(1):50-60
60. Tomé CML, Bauer C, Nottingham C, Smith C, Blackstone K, Brown L. et al. Mk801-induced caspase-3 in the postnatal brain: Inverse relationship with calcium binding proteins. Neuroscience. 2006;141(3):1351-63
Author contact
![]() Corresponding authors: Prof. Lay-Harn Gam; School of Pharmaceutical Sciences, Universiti Sains Malaysia, 11800 USM, Penang, Malaysia; layharnmy. Associate Professor Dr. Zurina Hassan; zurina_hassanmy; Address: Center of Drug Research, Universiti Sains Malaysia, 11800 USM, Penang, Malaysia.
Corresponding authors: Prof. Lay-Harn Gam; School of Pharmaceutical Sciences, Universiti Sains Malaysia, 11800 USM, Penang, Malaysia; layharnmy. Associate Professor Dr. Zurina Hassan; zurina_hassanmy; Address: Center of Drug Research, Universiti Sains Malaysia, 11800 USM, Penang, Malaysia.