Impact Factor ISSN: 1449-1907
- Issue 9; 2026
- Issue 8; 2026
- Issue 7; 2026
- Issue 6; 2026
- Issue 5; 2026
- Volume 23; 2026
- Past Issues
- Editorial Board
- Cover Images
- Index & Coverage
- Cover Suggestion
- Special Issues
Introduction
Materials and methods
Results
Discussion
Supplementary Material
Acknowledgements
Abbreviations
References

 Global reach, higher impact
Int J Med Sci 2022; 19(1):1-12. doi:10.7150/ijms.65002 This issue Cite
Research Paper
Expression profiling of lncRNAs and mRNAs in placental site trophoblastic tumor (PSTT) by microarray
Jianfeng Gan1,2, Zhixian Chen1,2, Xuan Feng1,2, Zhi Wei1,2, Sai Zhang1,2, Yan Du1,2, Congjian Xu1,2 ![]() , Hongbo Zhao1,2
, Hongbo Zhao1,2 ![]()
1. Shanghai Key Laboratory of Female Reproductive Endocrine Related Diseases, Obstetrics and Gynecology Hospital, Fudan University, Shanghai 200011, People's Republic of China.
2. Department of Obstetrics and Gynecology of Shanghai Medical School, Fudan University, Shanghai 200032, People's Republic of China.
Received 2021-8-10; Accepted 2021-10-19; Published 2022-1-1
Abstract

As a rare type of gestational trophoblastic disease, placental site trophoblastic tumor (PSTT) is originated from intermediate trophoblast cells. Long noncoding RNAs (lncRNAs) regulate numerous biological process. However, the role of lncRNAs in PSTT remains poorly understood. In the present study, expression levels of lncRNAs and mRNAs in four human PSTT tissues and four normal placental villi were investigated. The results of microarray were validated by the reverse transcription and quantitative real-time polymerase reaction (RT-qPCR) and immunohistochemistry analyses. Furthermore, GO and KEGG pathway analyses were performed to identify the underlying biological processes and signaling pathways of aberrantly expressed lncRNAs and mRNAs. We also conducted the coding-non-coding gene co-expression (CNC) network to explore the interaction of altered lncRNAs and mRNAs. In total, we identified 1247 up-regulated lncRNAs and 1013 down-regulated lncRNAs as well as 828 up-regulated mRNAs and 1393 down-regulated mRNAs in PSTT tissues compared to normal villi (fold change ≥ 2.0, p < 0.05). GO analysis showed that mitochondrion was the most significantly down-regulated GO term, and immune response was the most significantly up-regulated term. A CNC network profile based on six confirmed lncRNAs (NONHSAT114519, NR_103711, NONHSAT003875, NONHSAT136587, NONHSAT134431, NONHSAT102500) as well as 354 mRNAs was composed of 497 edges. GO and KEGG analyses indicated that interacted mRNAs were enriched in the signal-recognition particle (SRP)-dependent cotranslational protein targeting to membrane and Ribosome pathway. It contributes to expand the understanding of the aberrant lncRNAs and mRNAs profiles of PSTT, which may be helpful for the exploration of new diagnosis and treatment of PSTT.
Keywords: placental site trophoblastic tumor (PSTT), microarray analysis, lncRNA
Introduction
Placental site trophoblastic tumor (PSTT) is a rare type of gestational trophoblastic neoplasms (GTN), which was first described in 1976[1]. Compared with other types of GTN, PSTT tends to have a more unpredictable biological behavior, chemotherapy resistance and poor prognosis [2]. Therefore, hysterectomy is the first-consideration for PSTT patients who may face the fertility problems after the operations [3]. The proportion of PSTT in GTN is about 0.2-3% with an estimated incidence of 1/100000 pregnancies [4-10]. The early diagnosis of PSTT remains unclear, and distinguishing the benign and malignant forms of PSTT in the early stage is important to determine next clinical therapy [11]. Therefore, it is in urgent need for a better comprehension of PSTT to explore new diagnostic and therapeutic targets.
Long non-coding RNAs (lncRNAs) are non-protein-coding RNAs that longer than 200 nucleotides, which have been confirmed to function as regulators of many cellular processes, such as development, differentiation, cell fate and disease pathogenesis as well as tumorigenesis [12-14]. It has been reported that lncRNAs may play important roles in chemoresistance in many malignant tumors including ovarian cancer [15], breast cancer [16], gastric cancer [17], glioblastoma [18]. For example, LINC00261 is abnormally expressed in a number of tumors including pancreatic cancer, gastric cancer, choriocarcinoma and so on [19]. It has been confirmed to alleviate cisplatin resistance in colon-cancer via Wnt/β-catenin pathway [20]. Nevertheless, little is known about the lncRNA and mRNA expression profiles of PSTT and their involvement in the progression of PSTT. The present study performed the first microarray analysis of lncRNA and mRNA expression profiles of PSTT, which may contribute to expand our understanding of PSTT as well as explore more effective treatment strategy.
Materials and methods
Tissues and ethics statement
In total, 4 human first-trimester placental villi, 18 PSTT tissues were obtained from the tissue bank of Obstetrics and Gynecology Hospital of Fudan University. Written informed consent was obtained. The pathological diagnosis of choriocarcinoma and PSTT was confirmed in the department of pathology in Obstetrics and Gynecology Hospital. Human first-trimester placental villi (6-7 weeks of gestation) were collected from 25-30 years old women without underlying health conditions that had normal pregnancies and terminated for non-medical reasons. PSTT tissues were collected from surgeries for primary tumors. Patients were 25.5-38 years old with at least 1 gravidity and 1 parity. And the stage of PSTT is FIGO Ⅰ. All the PSTT tissues were affirmed by frozen sections to contain more than 75% lesions. This study was approved by the Institution Ethics Committee of Obstetrics and Gynecology Hospital of Fudan University.
Microarray analysis
Total RNAs were isolated by using Trizol RNA extraction kit (Invitrogen, Carlsbad,CA, USA) and was quantified by the NanoDrop ND-2000 (Thermo Scientific), and the RNAs integrity and 28S/18S were assessed using Agilent Bioanalyzer 2100 (Agilent Technologies). The sample labeling, microarray hybridization and washing were performed based on the manufacturer's standard protocols. Briefly, total RNAs were transcribed to double strand cDNAs and then synthesized cRNAs. Next, 2nd cycle cDNAs were synthesized from cRNAs. Followed fragmentation and biotin labeling, the 2nd cycle cDNAs were hybridized onto the microarray. After washing and staining, the arrays were scanned by the Affymetrix Scanner 3000 (Affymetrix). The sample with RIN (RNA integrity number) values of RIN ≥ 7.0, 28S/18S ≥ 0.7 and the total amount can meet 2 or more experiments were processed for subsequent experiments. In this case, 4 human first-trimester placental villi and 4 PSTT tissues were selected and subjected to the Affymetrix Human OElncRNA Array.
Reverse transcription and quantitative real-time polymerase chain reaction (RT-qPCR)
Quantification was performed with a two-step reaction process: reverse transcription (RT) and quantitative PCR. Firstly, mRNA was transcribed to cDNA in a GeneAmp® PCR System 9700 (Applied Biosystems, USA). The second step was performed in a GeneAmp® PCR System 9700 (Applied Biosystems, USA) with 5 × HiScript II Q RT SuperMix IIa. Quantitative Real-time PCR was performed using LightCycler® 480 Ⅱ Real-time PCR Instrument (Roche, Swiss). The primer sequences were designed and synthesized by Generay Biotech (Generay, PRC) based on the mRNA sequences obtained from the NCBI database as shown in Table 1.
The sequence of the primers for lncRNAs and mRNAs
| Gene name | Forward and reverse primer | Tm (℃) | Product length (bp) |
|---|---|---|---|
| DPP4 | F: 5'CTAGGGCAGGGACAGGATAA3' | 60 | 126 |
| R: 5'TGTGAACAGCTCTTCTCCG3' | |||
| PARP14 | F: 5'ACATTGTGTGCCAGGTAG3' | 60 | 116 |
| R: 5'GCTTCTTGCACTCTGAGC3' | |||
| ADAMTS9 | F: 5'AATGCTTTGAGTCTTTCCGA3' | 60 | 112 |
| R: 5'GCTTCCCTTCATCAGCTTG3' | |||
| F: 5'ATGAATGCTGTCTGTGTGGAA3' | 60 | 106 | |
| R:5'CAGCAAAGAGTTGCCATATAGT3' | |||
| AQPEP//LVRN | F: 5'CCATCAGCACATCTCCATTC3' | 60 | 122 |
| R: 5'TTTACTCACAGCTTGCCAG3' | |||
| EGR1 | F: 5'CAAACCAATGGTGATCCTCTAT3' | 60 | 101 |
| R: 5'CTGACACATGCTCTGAGAAT3' | |||
| PLK2 | F: 5'ATTAGTCAAGTGACGGTGC3' | 60 | 115 |
| R: 5'GAAGGAGGTAGAGCCGAG3' | |||
| ADAMTS6 | F: 5'GATCTAATGCAGATGACTAGGC3' | 60 | 107 |
| R: 5'ATTCCATGCTGATTGTCCAC3' | |||
| HTRA4 | F: 5'CCAATGCCCATGTTGTCAG3' | 60 | 110 |
| R: 5'CACCGCAAGATCCAATTTAAG3' | |||
| CDH11 | F: 5'CCTGGGTCATTGTGACATA3' | 60 | 101 |
| R: 5'CCTCTTCTGCTCAGAGACT3' | |||
| GAPDH | F: 5'TGTTGCCATCAATGACCCCTT3' | 60 | 201 |
| R: 5'CTCCACGACGTACTCAGCG3' | |||
| NONHSAT003875 | F: 5'GGTGGGGCAGAGAACATAGAAAAAGA3' | 60 | 246 |
| R: 5'TCAAGGAAGAGTTGGGAAGGAAGAGA3' | |||
| NONHSAT102500 | F: 5'GGGAGCCTTTTCGTTTTGTGCTTTTT3' | 58 | 202 |
| R: 5'ATTTCGTGCCCTTTGCCTCACTTTTC3' | |||
| NONHSAT114519 | F: 5'AAAGAGGTAGGAGCAAGAAAGAGGAG3' | 58 | 214 |
| R: 5'TCTATGTGCATATTTGGGATGAGATT3' | |||
| NONHSAT134431 | F: 5'CATTATATAGATGGAAACATCGAGGG3' | 60 | 264 |
| R: 5'TGCTTATTAGAATTTTTGTGGTGAGA3' | |||
| NR_103711 | F: 5'ACTGGACTGTGCAGTGTGGTTCTGAG3' | 58 | 190 |
| R: 5'TGGGCATTTTGTTTATTTGTTTGGTG3' | |||
| NONHSAT136587 | F: 5'AAGAGATTTTGTCTAAAGGGCAGCAT3' | 60 | 326 |
| R: 5'CAGAGAAAGCCAGTCGGTAAGTTCTG3' |
Tm: temperature. bp: base pair
Immunohistochemistry
The first-trimester placental villi, choriocarcinoma tissues, and PSTT tissues sections were immunohistochemically stained by using primary antibodies of PLAC8, EGR1 and ADAMTS6 at 4°C overnight followed by the secondary antibody for 1 h at 37°C. The band was then visualized using the EnVision Detection Systems (Dako, Glostrup, Denmark). Paraffin-embedded tissue sections were stained with hematoxylin-eosin (HE) on Leica automated Staining/Coverslipping Workstations (Leica Biosystems, Nussloch, Germany). PLAC8 antibody (12284- 1-AP) for immunohistochemistry (IHC) was purchased from Proteintech (Chicago, IL, USA). EGR1 antibody (4154S) was purchased from Cell Signaling Technology (San Diego, CA, USA). ADAMTS6 antibody (PA5-60365) was obtained from Thermo Fisher Scientific (Waltham, MA, USA). HRP- conjugated secondary antibodies were purchased from Jackson ImmunoResearch Laboratories (West Grove, PA, USA).
Gene Oncology (GO) analysis, Kyoto Encyclopedia of Genes and Genomes (KEGG) pathway analysis and coding-non-coding gene co-expression (CNC) network
GO analysis and KEGG analysis were applied to determine the potential biological functions and significant pathways of altered mRNAs or lncRNA-interacted associated mRNAs. Afterwards, we established a CNC network between validated 6 lncRNAs and interacted mRNAs to explore their relationships. Pearson correlation coefficients (PCCs) ≥ 0.95 were selected as the baseline of correlation analysis. Cytoscape V3.8.0 (The Cytoscape Consortium, San Diego, CA, USA) was used to represent the interaction in pictures.
Gene set enrichment analysis (GSEA)
GSEA was conducted using the Molecular Signatures Database hallmark gene set collection (v7.4) to identify differences in pathways among choriocarcinoma (CC), PSTT, epithelioid trophoblastic tumor (ETT) and normal villi. Data set GSE135727 [21] was downloaded from Gene Expression Omnibus [22].
Statistical analysis
Affymetrix GeneChip Command Console (version 4.0, Affymetrix) software was used to extract raw data. Next, Expression Console (version1.3.1, Affymetrix) software offered RMA normalization for both gene and exon level analysis. Genesrping software (version 13.1; Agilent Technologies) was employed to finish the basic analysis. Differentially expressed genes were then identified through fold change as well as P value calculated with t-test. P values were also adjusted for multiple comparison. The threshold set for up- and down-regulated genes was fold change ≥ 2.0 and P value ≤ 0.05. Hierarchical Clustering was performed to display the distinguishable genes' expression pattern among samples.
Results
Expression profiles of lncRNAs and mRNAs in PSTT
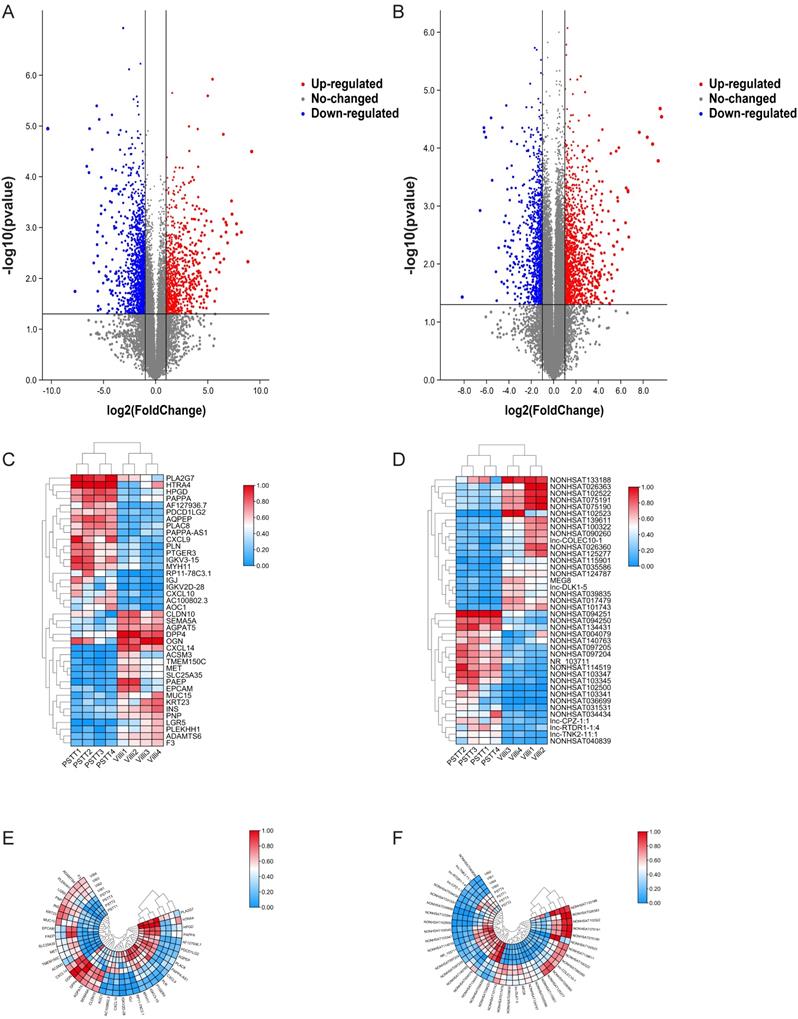
In order to identify the expression of lncRNAs in PSTT compared to normal villi, microarray was conducted as described. Principal component analysis (PCA) was performed to explore the expression patterns associated with differentially expressed lncRNAs and mRNAs in our datasets. Both mRNA and lncRNA expression levels could be distinguished between the PSTT and control samples (Figure S1A and S1B). In brief, 1247 up-regulated lncRNAs and 1013 down-regulated lncRNAs were detected (FC ≥ 2.0 and P ≤ 0.05). The top 20 up-regulated and down-regulated lncRNAs are shown in Table 2. Among our data, the most significantly up-regulated lncRNA is NONHSAT114519 with FC of 801.27435, whereas NONHSAT102523 is the most significantly down-regulated lncRNA. Clustering analysis of top 20 up- and down-regulated lncRNAs and volcano plot of lncRNAs expression were shown in Figure 1D, F and B.
Differential mRNA and lncRNA expression of PSTT and villi by microarray. The volcano plot represents total identified mRNAs (A) and lncRNAs (B) expression between the PSTT and normal villi. The horizontal black lines show the default 2.0-fold change and the vertical black lines represent a P-value of 0.05. The red and blue plots represent up- and downregulated RNAs with FC ≥ 2.0 and P < 0.05. Heat map and hierarchical clustering analysis of the top 20 up- and downregulated mRNAs (C, E) and lncRNAs (D, F) between PSTT and normal villi.
Top 20 significantly up-regulated and down-regulated lncRNAs
| Probe Set ID | p | FC (abs) | Regulation | PSTT1 | PSTT2 | PSTT3 | PSTT4 | Villi1 | Villi2 | Villi3 | Villi4 | GeneSymbol | NonCodeID |
|---|---|---|---|---|---|---|---|---|---|---|---|---|---|
| TC0600002926.oe.1 | 2.876E-05 | 801.27435 | up | 14.57266 | 17.61935 | 14.21191 | 15.35068 | 5.161994 | 5.335738 | 5.820837 | 6.851423 | lnc-LAMA4-4 | NONHSAT114519 |
| TC0500001030.oe.1 | 2.075E-05 | 734.45276 | up | 14.62951 | 16.50723 | 16.46539 | 13.9997 | 5.054627 | 5.078194 | 6.540246 | 6.846658 | lnc-COMMD10-8 | NONHSAT103347 |
| TC0300003446.oe.1 | 0.0001658 | 650.9045 | up | 18.86095 | 18.16658 | 18.05667 | 18.81532 | 7.498871 | 7.042424 | 10.36552 | 11.6075 | lnc-TNK2-9 | NONHSAT094251 |
| TC0300003445.oe.1 | 8.53E-05 | 460.6303 | up | 16.55804 | 15.36818 | 15.39982 | 16.55225 | 5.795643 | 5.417085 | 8.381965 | 8.893738 | lnc-TNK2-10 | NONHSAT094250 |
| TC0500001029.oe.1 | 6.498E-05 | 330.9917 | up | 12.91026 | 15.37042 | 15.56427 | 12.90601 | 6.14006 | 4.675454 | 6.697259 | 5.755586 | lnc-COMMD10-9 | NONHSAT103345 |
| TC0400000688.oe.1 | 5.345E-05 | 202.31433 | up | 14.13912 | 16.11971 | 14.57873 | 14.29385 | 6.061105 | 6.281838 | 7.472301 | 8.674349 | lnc-COPS4-1 | NONHSAT097204 |
| TC0500002484.oe.1 | 0.0034374 | 105.16381 | up | 10.39773 | 11.63986 | 14.5663 | 7.646206 | 4.406109 | 4.058787 | 4.508239 | 4.410984 | RP11-78C3.1 | NONHSAT102500 |
| TC0900000988.oe.1 | 0.0005695 | 100.53162 | up | 14.10921 | 16.4567 | 17.14165 | 16.3712 | 8.728636 | 7.745153 | 11.29517 | 9.703777 | lnc-TRIM32-11 | NONHSAT134431 |
| TC0900002221.oe.1 | 0.0005368 | 99.72805 | up | 12.96074 | 14.52683 | 14.38401 | 14.13185 | 6.12572 | 5.533823 | 9.488853 | 8.295328 | PAPPA-AS1 | NR_103711 |
| TC0400002102.oe.1 | 0.0004868 | 89.59299 | up | 11.60127 | 15.63266 | 14.06496 | 13.14861 | 6.616827 | 6.794709 | 6.660107 | 8.434599 | lnc-LIN54-3 | NONHSAT097205 |
| TC0500002714.oe.1 | 0.001948 | 86.06065 | up | 10.93789 | 13.99877 | 12.5951 | 8.366644 | 4.825502 | 4.857947 | 5.668418 | 4.837413 | lnc-ATG12-2 | NONHSAT103341 |
| TC1300001424.oe.1 | 0.0055827 | 71.04717 | up | 11.47673 | 10.99826 | 10.81088 | 16.38293 | 5.018981 | 5.45683 | 7.269685 | 7.320484 | RP11-318G21.4 | NONHSAT034434 |
| TC0300003444.oe.1 | 9.85E-05 | 56.742313 | up | 12.1657 | 10.80384 | 11.8323 | 12.61162 | 5.355786 | 5.137434 | 6.225355 | 7.389472 | lnc-TNK2-11 | --- |
| TC1400000340.oe.1 | 0.002576 | 54.023994 | up | 7.73035 | 11.65167 | 12.14659 | 8.160899 | 3.831198 | 4.072921 | 4.663983 | 4.099294 | lnc-LRR1-6 | NONHSAT036699 |
| TC0400000156.oe.1 | 0.000826 | 53.37624 | up | 9.918715 | 12.84252 | 12.94642 | 13.54016 | 5.980694 | 5.678541 | 7.029627 | 7.606449 | lnc-CPZ-1 | --- |
| TC1500001204.oe.1 | 0.000714 | 52.510838 | up | 12.26639 | 8.419676 | 12.00192 | 11.29106 | 4.842388 | 5.158345 | 5.542342 | 5.577796 | RP11-73C9.1 | NONHSAT040839 |
| TC0100001151.oe.1 | 0.0125757 | 51.62064 | up | 12.92449 | 13.55079 | 13.03012 | 11.93119 | 6.584359 | 11.71653 | 4.420371 | 5.955827 | lnc-IFI44-5 | NONHSAT004079 |
| TSUnmapped00002029.oe.1 | 0.0041549 | 51.021782 | up | 14.78756 | 9.150758 | 13.04631 | 11.74117 | 6.185886 | 7.775435 | 6.255181 | 5.817128 | lnc-RTDR1-1 | --- |
| TC1200003068.oe.1 | 0.0001133 | 48.14622 | up | 9.09206 | 12.02009 | 10.97622 | 11.14791 | 5.561361 | 4.952483 | 5.211253 | 5.153783 | lnc-HCAR3-1 | NONHSAT031531 |
| TC1600001762.oe.1 | 0.006927 | 43.289265 | up | 14.51361 | 12.54379 | 14.508 | 11.07535 | 8.799093 | 10.1918 | 6.002627 | 5.903477 | lnc-KIAA0430-2 | NONHSAT140763 |
| TC0500002493.oe.1 | 0.0370893 | 288.59473 | down | 5.638968 | 5.017736 | 4.947758 | 5.209421 | 7.599888 | 8.595558 | 18.266 | 19.04404 | lnc-EDIL3-6 | NONHSAT102523 |
| TC1100001750.oe.1 | 0.0011976 | 95.452 | down | 5.716751 | 6.666399 | 6.126871 | 5.764963 | 10.45444 | 10.97112 | 14.49622 | 14.66002 | NONHSAG007410 | NONHSAT017479 |
| TC0200004232.oe.1 | 4.448E-05 | 75.3497 | down | 8.218021 | 9.405064 | 9.379367 | 9.757372 | 16.38943 | 16.15815 | 14.58752 | 14.56685 | lnc-GCG-3 | NONHSAT075191 |
| TC0500002278.oe.1 | 5.254E-05 | 73.73616 | down | 7.36856 | 5.65632 | 6.768617 | 6.701671 | 11.46042 | 12.73857 | 13.50097 | 13.61241 | lnc-CENPK-2 | NONHSAT101743 |
| TC0200004231.oe.1 | 6.523E-05 | 66.59564 | down | 8.589523 | 9.65343 | 9.179054 | 9.526411 | 16.27332 | 16.25944 | 14.06544 | 14.57964 | lnc-GCG-4 | NONHSAT075190 |
| TC0Y00000312.oe.1 | 3.009E-05 | 48.222668 | down | 7.416726 | 7.051343 | 7.681014 | 7.152988 | 13.70421 | 13.75827 | 11.88662 | 12.31953 | lnc-HSFY2-10 | NONHSAT139611 |
| TC0500000786.oe.1 | 0.0003598 | 45.157536 | down | 8.937391 | 8.656306 | 9.234922 | 11.02877 | 16.14978 | 15.59811 | 13.88346 | 14.21362 | lnc-XRCC4-6 | NONHSAT102522 |
| TC1200000179.oe.1 | 0.013569 | 35.71296 | down | 8.367052 | 8.457984 | 10.00808 | 9.479094 | 17.09085 | 16.33409 | 11.90496 | 11.61581 | lnc-RIMKLB-1 | NONHSAT026363 |
| TC0900001993.oe.1 | 0.0428375 | 34.091114 | down | 15.47735 | 10.6726 | 13.60676 | 6.988581 | 16.36274 | 14.92022 | 18.08391 | 17.74372 | lnc-OMD-1 | NONHSAT133188 |
| TC14000659.hg.4 | 0.0052727 | 30.134325 | down | 6.758659 | 6.755126 | 8.207018 | 6.675376 | 10.21877 | 10.03378 | 13.81844 | 13.97853 | MEG8 | NR_024149 |
| TC1200000178.oe.1 | 0.0203783 | 25.076464 | down | 6.339385 | 7.046954 | 8.730094 | 8.730531 | 14.91692 | 14.49464 | 10.01952 | 10.00893 | lnc-RIMKLB-3 | NONHSAT026360 |
| TC1400000032.oe.1 | 4.427E-05 | 23.937801 | down | 5.908465 | 6.809318 | 6.180269 | 6.861191 | 10.77885 | 10.08512 | 11.60237 | 11.61778 | lnc-APEX1-3 | NONHSAT035586 |
| TC0800000155.oe.1 | 0.0219285 | 21.791851 | down | 7.052204 | 6.485874 | 7.214129 | 7.360553 | 13.46182 | 14.35795 | 8.499699 | 9.576158 | lnc-PDGFRL-3 | NONHSAT125277 |
| TSUnmapped00000268.oe.1 | 0.0018863 | 21.46142 | down | 6.592407 | 6.48301 | 7.71503 | 7.08154 | 10.66954 | 9.543282 | 12.30839 | 13.04547 | lnc-DLK1-5 | --- |
| TC1400000966.oe.1 | 0.0049216 | 20.716341 | down | 6.727886 | 6.515725 | 6.867692 | 6.953129 | 9.094263 | 9.745587 | 12.64482 | 13.07055 | OTTHUMG00000029060 | NONHSAT039835 |
| TC0500001872.oe.1 | 0.0040102 | 19.861301 | down | 9.433871 | 6.534947 | 7.719427 | 6.949482 | 13.23098 | 13.10029 | 10.4047 | 11.14931 | lnc-TAS2R1-24 | NONHSAT100322 |
| TC0300002485.oe.1 | 0.0014715 | 19.597805 | down | 7.21331 | 7.91722 | 7.539716 | 7.546046 | 13.63197 | 12.58882 | 10.73676 | 10.42922 | lnc-PRICKLE2-6 | NONHSAT090260 |
| TC0800000049.oe.1 | 1.843E-05 | 18.799055 | down | 7.130774 | 5.713998 | 6.799021 | 6.786564 | 11.20656 | 10.67594 | 10.49293 | 10.98528 | lnc-MCPH1-3 | NONHSAT124787 |
| TC0600001704.oe.1 | 0.0002245 | 17.906603 | down | 6.236846 | 4.643425 | 6.369543 | 5.58888 | 9.445736 | 9.72422 | 10.91174 | 9.406675 | lnc-SLC22A1-6 | NONHSAT115901 |
| TSUnmapped00000213.oe.1 | 0.006309 | 17.698973 | down | 6.089841 | 7.533654 | 7.496603 | 6.496414 | 13.19711 | 12.04852 | 9.260924 | 9.692332 | lnc-COLEC10-1 | --- |
P values were calculated using unpaired t-test and adjusted for multiple comparison. FC (abs): the absolute ratio (no log scale) of average normalized intensities between PSST and normal villi. PSTT 1 to 4 and Villi 1 to 4: each sample's normalized intensity (log2 scale). The same goes for the follow-up table.
We also demonstrated 828 up-regulated mRNAs and 1393 down-regulated mRNAs in PSTT tissues compared to normal villi (fold change ≥ 2.0, p ≤ 0.05). The top 20 up-regulated and down-regulated mRNAs are shown in Table 3. Among those upregulated mRNAs, AQPEP also known as LVRN ranges as top with an FC of 591.0085, while expression of CXCL14 tops among downregulated genes with FC of 1304.5027. The heatmap plot showed the clustering analysis among mRNA expression profiles by revealing the top 20 up- and downregulated mRNAs (Figure 1 C, E). A volcano plot (Figure 1A) showed the variation of mRNA expression between PSTT tissues and normal villi. The heatmaps and hierarchical clustering were drawn by the TBtools [23].
Top 20 significantly up-regulated and down-regulated mRNAs
| Probe Set ID | p | FC (abs) | Regulation | PSTT1 | PSTT2 | PSTT3 | PSTT4 | Villi1 | Villi2 | Villi3 | Villi4 | GeneSymbol | strand |
|---|---|---|---|---|---|---|---|---|---|---|---|---|---|
| TC05000549.hg.4 | 3.19235E-05 | 591.0085 | up | 14.27506 | 16.42701 | 15.97555 | 13.53596 | 4.718653 | 5.511204 | 6.863236 | 6.292351 | AQPEP | + |
| TC08000297.hg.4 | 0.004722227 | 458.7278 | up | 17.73262 | 18.95313 | 17.89105 | 17.81702 | 5.701577 | 6.169894 | 11.17874 | 13.97764 | HTRA4 | + |
| TC04001304.hg.4 | 0.001240178 | 298.35522 | up | 17.31657 | 11.57826 | 13.04546 | 16.06837 | 5.285185 | 7.790433 | 5.599919 | 6.449578 | CXCL9 | - |
| TC05001550.hg.4 | 0.001369429 | 220.83633 | up | 10.24931 | 11.60825 | 14.99216 | 8.492987 | 3.193323 | 3.266655 | 3.947432 | 3.787961 | RP11-78C3.1 | - |
| TC02004950.hg.4 | 0.000845117 | 215.45534 | up | 16.68137 | 12.53434 | 15.61682 | 14.56816 | 7.122076 | 9.626941 | 5.731162 | 5.915533 | IGKV3-15 | - |
| TC04001753.hg.4 | 0.000546863 | 160.13506 | up | 13.51392 | 17.16884 | 15.11037 | 15.33165 | 7.005078 | 6.216195 | 9.034913 | 9.57601 | HPGD | - |
| TC21000287.hg.4 | 0.000300168 | 154.46967 | up | 10.59372 | 13.89927 | 14.52517 | 11.97499 | 4.889561 | 4.769378 | 6.180188 | 6.069306 | AF127936.7 | - |
| TC06000935.hg.4 | 0.002012451 | 119.142746 | up | 15.03825 | 12.59383 | 14.74779 | 11.78778 | 7.760329 | 8.965266 | 5.600394 | 4.255473 | PLN | + |
| TC04001344.hg.4 | 0.000890978 | 111.79973 | up | 12.05535 | 15.73258 | 14.5653 | 13.71613 | 6.178575 | 5.559375 | 8.119697 | 8.99262 | PLAC8 | - |
| TC01002774.hg.4 | 0.001239457 | 107.338455 | up | 14.57023 | 12.06937 | 14.90409 | 11.53205 | 7.059074 | 8.57903 | 5.266312 | 5.187234 | PTGER3 | - |
| TC09001525.hg.4 | 0.000788934 | 105.381905 | up | 12.49726 | 13.83948 | 13.67676 | 13.49805 | 5.165512 | 4.803937 | 9.22176 | 7.44241 | PAPPA-AS1 | - |
| TC04001270.hg.4 | 0.004180308 | 93.43535 | up | 14.72628 | 7.911443 | 11.8912 | 10.37814 | 4.447676 | 5.532782 | 4.042093 | 4.700925 | IGJ | - |
| TC06001773.hg.4 | 0.000682254 | 90.94472 | up | 17.52071 | 17.21107 | 17.07343 | 17.87255 | 12.42595 | 11.83653 | 11.40955 | 7.978059 | PLA2G7 | - |
| TC09000038.hg.4 | 1.45655E-05 | 89.93031 | up | 12.54376 | 13.83348 | 11.77462 | 13.4532 | 6.069004 | 6.997876 | 6.103081 | 6.472157 | PDCD1LG2 | + |
| TC08000150.hg.4 | 0.001507328 | 77.45381 | up | 9.458164 | 13.66541 | 9.141149 | 12.47632 | 4.575369 | 4.467356 | 5.268524 | 5.328737 | AC100802.3 | + |
| TC16000898.hg.4 | 0.004886279 | 72.98015 | up | 15.8717 | 13.48058 | 15.87599 | 12.17157 | 9.269753 | 10.68977 | 6.477879 | 6.204714 | MYH11 | - |
| TC02004978.hg.4 | 0.007539266 | 68.028145 | up | 12.40944 | 5.704045 | 9.07485 | 11.44005 | 3.022104 | 4.692099 | 3.458396 | 3.103549 | IGKV2D-28 | + |
| TC09000593.hg.4 | 0.003252797 | 66.812675 | up | 13.59354 | 16.24804 | 15.87841 | 15.89478 | 7.747241 | 7.059897 | 11.45904 | 11.10039 | PAPPA | + |
| TC04001305.hg.4 | 0.003304237 | 56.946953 | up | 13.42061 | 10.216 | 9.274749 | 13.00267 | 5.717486 | 7.589098 | 4.4457 | 4.835558 | CXCL10 | - |
| TC07001008.hg.4 | 0.006718533 | 56.503063 | up | 8.288177 | 11.47205 | 10.50508 | 14.01944 | 5.617546 | 7.370414 | 3.747692 | 4.268066 | AOC1 | + |
| TC05001804.hg.4 | 1.13295E-05 | 1304.5027 | down | 4.789694 | 4.781364 | 4.235359 | 4.61926 | 16.16161 | 16.39945 | 13.47281 | 13.78895 | CXCL14 | - |
| TC09000799.hg.4 | 0.018049004 | 212.94751 | down | 4.27957 | 5.484641 | 4.4404 | 5.481874 | 16.75124 | 16.76882 | 8.093913 | 9.009928 | PAEP | + |
| TC02002478.hg.4 | 6.23932E-05 | 97.702 | down | 9.555952 | 11.27693 | 10.58138 | 11.23763 | 18.28535 | 18.10812 | 16.43987 | 16.25981 | DPP4 | - |
| TC07000722.hg.4 | 8.31021E-05 | 84.22738 | down | 5.371543 | 4.937615 | 5.333688 | 5.770316 | 13.12773 | 12.60029 | 10.39067 | 10.87934 | MET | + |
| TC05001406.hg.4 | 1.12984E-05 | 81.3294 | down | 6.72622 | 5.453224 | 6.382895 | 5.675251 | 11.48571 | 12.12078 | 12.89001 | 13.12391 | ADAMTS6 | - |
| TC04001335.hg.4 | 2.90216E-05 | 67.747826 | down | 6.126198 | 4.339462 | 4.120981 | 5.204585 | 11.40271 | 11.55877 | 10.85734 | 10.30082 | TMEM150C | - |
| TC12000624.hg.4 | 0.004995465 | 61.509308 | down | 4.402699 | 5.301405 | 3.562141 | 4.060987 | 7.529198 | 8.502194 | 12.1875 | 12.87927 | LGR5 | + |
| TC17001112.hg.4 | 4.01987E-06 | 50.456596 | down | 5.316912 | 5.662082 | 5.71819 | 5.521931 | 11.64679 | 11.93939 | 10.48815 | 10.77267 | SLC25A35 | - |
| TC11001274.hg.4 | 0.002174686 | 49.247604 | down | 6.986232 | 9.491581 | 7.071369 | 8.253414 | 11.63622 | 12.38722 | 14.7717 | 15.49538 | INS | - |
| TC14000407.hg.4 | 0.001220558 | 48.467384 | down | 5.233055 | 4.43302 | 5.984023 | 6.457338 | 10.24269 | 9.109385 | 12.45468 | 12.69645 | PLEKHH1 | + |
| TC11001505.hg.4 | 0.003624685 | 47.256374 | down | 5.270397 | 8.929316 | 6.762051 | 5.760069 | 12.42111 | 10.82543 | 11.03148 | 14.69356 | MUC15 | - |
| TC17001474.hg.4 | 0.01790399 | 47.178997 | down | 6.29473 | 6.818648 | 8.245532 | 6.971005 | 11.13493 | 8.638376 | 15.39309 | 15.40381 | KRT23 | - |
| TC09001334.hg.4 | 0.042527948 | 46.31269 | down | 15.78603 | 11.14224 | 14.07409 | 6.869641 | 16.99306 | 15.18752 | 19.40821 | 18.41655 | OGN | - |
| TC05001151.hg.4 | 0.000906728 | 45.62948 | down | 9.584321 | 6.191512 | 8.45069 | 8.70398 | 14.70294 | 14.62603 | 12.47793 | 13.17118 | SEMA5A | - |
| TC13000335.hg.4 | 0.035226125 | 45.062977 | down | 11.85807 | 7.952482 | 11.39816 | 3.792094 | 15.23736 | 15.66917 | 12.14623 | 13.92353 | CLDN10 | + |
| TC16000223.hg.4 | 0.007389613 | 43.19478 | down | 4.741453 | 4.390289 | 4.657523 | 4.420307 | 12.78836 | 11.86416 | 7.820678 | 7.467516 | ACSM3 | + |
| TC08000022.hg.4 | 7.42939E-06 | 42.766193 | down | 8.376294 | 7.954287 | 9.139468 | 9.321456 | 14.22422 | 13.52475 | 14.43939 | 14.27674 | AGPAT5 | + |
| TC02000293.hg.4 | 0.040336728 | 39.249073 | down | 7.892764 | 5.327816 | 7.782251 | 6.065664 | 15.51643 | 15.24631 | 8.215117 | 9.268984 | EPCAM | + |
| TC01002886.hg.4 | 0.000537544 | 37.86066 | down | 6.817955 | 5.422742 | 6.118052 | 6.653155 | 9.519774 | 11.35453 | 12.57758 | 12.53053 | F3 | - |
| TC14000056.hg.4 | 0.000102863 | 37.460266 | down | 6.568504 | 8.084141 | 6.370689 | 7.934472 | 12.03227 | 11.67531 | 12.92644 | 13.23294 | PNP | + |
Validation of the aberrantly expressed lncRNAs and mRNAs by RT-qPCR
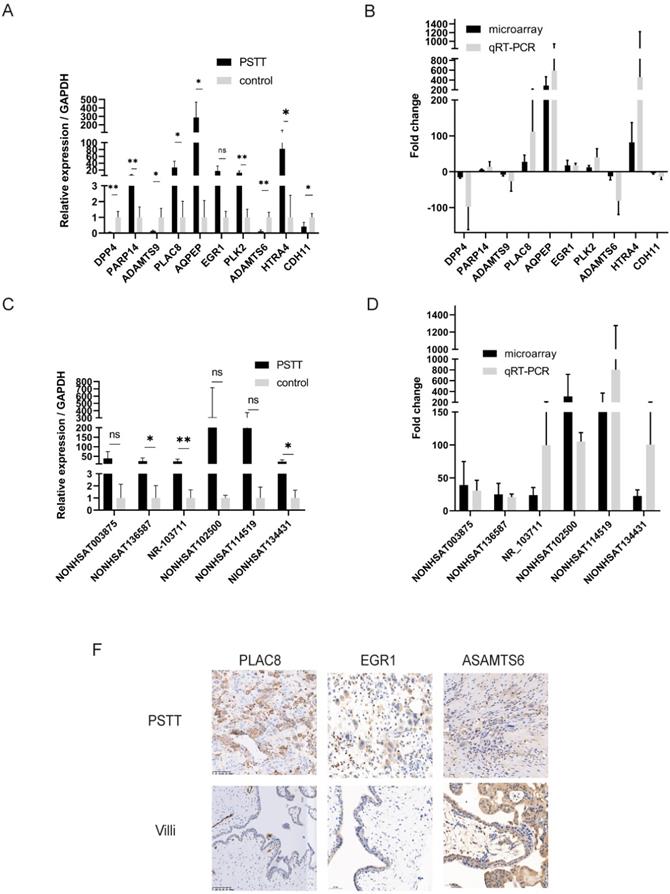
To confirm the reliability of the microarray profiling results, six lncRNAs (NONHSAT114519, NR_103711, NONHSAT003875, NONHSAT136587, NONHSAT134431, NONHSAT102500) as well as ten mRNAs (DPP4, PARP14, ADAMTS9, PLAC8, AQPEP, EGR1, PLK2, ADAMTS6, HTRA4, CDH11) were chosen randomly for RT-qPCR. The microarray samples including four PSTT tissues and normal villi counterparts were further used for RT-qPCR. The results of RT-qPCR were in accordance with microarray observations. In PSTT tissues, the lncRNA expression of NONHSAT114519, NR_103711, NONHSAT003875, NONHSAT136587, NONHSAT134431, NONHSAT102500 was up-regulated when compared with those in normal placental villi (Figure 2C, D). Further, the mRNA expression of PARP14, PLAC8, AQPEP, EGR1, PLK2, and HTRA4 was significantly up-regulated whereas the expression of DPP4, ADAMTS9, ADAMTS6 and CDH11 in PSTT tissues was significantly down-regulated compared with those in normal placental villi (Figure 2A, B).
Validation of the microarray results of mRNAs and lncRNAs by RT-qPCR and immunohistochemistry. RT-qPCR was performed to test the differentially expressed mRNAs (A) and lncRNAs (C) (n=4 for PSTT group and control group, respectively); the fold change of each mRNA (B) and lncRNA (D) between PSTT tissues and control group was determined microarray and RT-qPCR. The expression of PLAC8 and EGR1 was obviously higher than normal villi, while ADAMTS6 expression is much lower in PSTT compared to normal villi (F). ns, No significance; *, P < 0.05; **, P < 0.01, P < 0.001, Student t-test. Scale bar = 100μm.
Validation of the PLAC8, EGR1 and ADAMTS6 by immunohistochemistry
To further confirm the microarray data, the protein products of several genes were measured by immunohistochemistry analysis. We randomly chose two up-regulated mRNAs (PLAC8 and EGR1) as well as one down-regulated mRNAs (ADAMTS6) for immunohistochemistry. As shown in Figure 2F, PLAC8 and EGR1 expression was dramatically elevated in PSTT tissues compared with those in normal villi. Comparatively, ADAMTS6 was diffusely positive in normal villi but only partly positive in PSTT. Immunohistochemistry data were consistent with microarray analysis. Furthermore, we also found that PLAC8 was highly expressed in PSTT but not choriocarcinoma, which indicates that PLAC8 may act as a potential marker to distinguish PSTT from choriocarcinoma Figure S2.
GO and KEGG analyses of differential genes
GO analysis of the altered 2221 mRNAs showed that up-regulated genes were enriched in immune response (ontology: biological process, GO:0006955), actin cytoskeleton (ontology: cellular component, GO:0015629) and actin binding (ontology: molecular function, GO:0003779) (Figure 3B); On the other hand, the top 10 enriched GO terms on down-regulated genes included small molecule metabolic process (ontology: biological process, GO:0044281), mitochondrion (ontology: cellular component, GO:0005739 and structural constituent of ribosome (ontology: molecular function, GO:0003735) (Figure 3A).
GO and KEGG analysis of altered mRNAs. The GO analysis of down-regulated mRNAs (A) and up-regulated mRNAs (B). KEGG pathways showed TOP 10 significantly enriched pathways of down-regulated mRNAs(C) and up-regulated mRNAs(D).
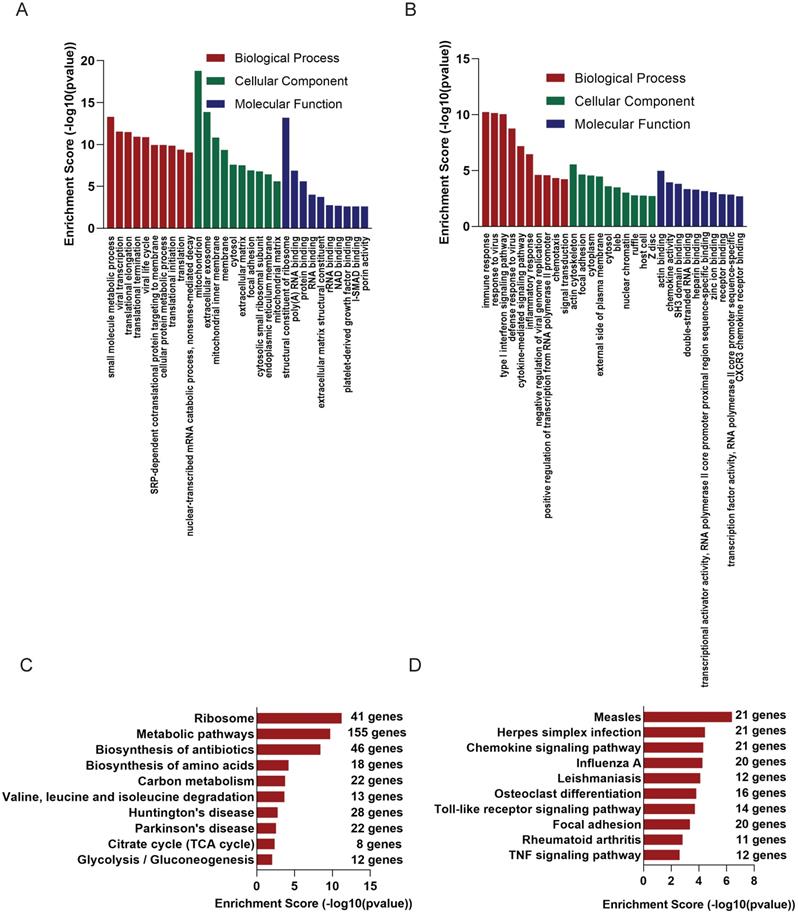
KEGG analysis was of these differentially expressed mRNAs was also conducted. Up-regulated mRNAs were involved in Measles, Herpes simplex infection, Chemokine signaling pathway (Figure 3D), while down-regulated mRNAs were most enriched in Ribosome, Metabolic pathways, Biosynthesis of antibiotics (Figure 3C).
CNC network with GO and KEGG analyses
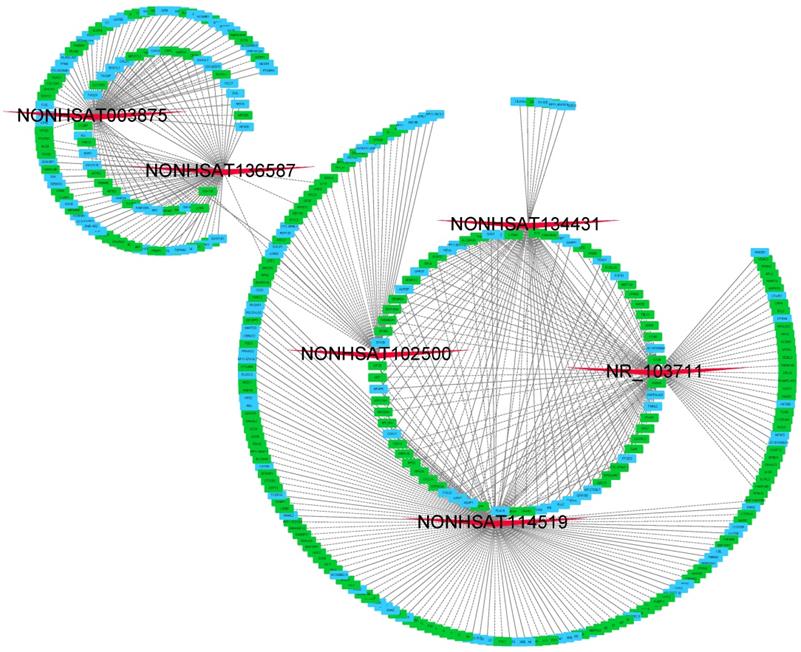
We then constructed lncRNA-mRNA co-expression networks on the basis of 6 validated lncRNAs as well as 354 mRNAs. In brief, the CNC networks were composed of 497 edges and 360 nodes with 207 positive interactions (continuous lines) and 290 negative interactions (dotted lines) (Figure 4). The lncRNA NONHSAT114519 is connected with 151 mRNAs, NR_103711 is connected with 97 mRNAs, NONHSAT003875 is connected with 77 mRNAs, NONHSAT136587, NONHSAT134431, and NONHSAT102500 are connected with 71, 66 and 35 mRNAs respectively.
CNC networks by validated lncRNAs. The CNC networks were performed by 6 validated lncRNAs and 354 interacted mRNAs. The CNC networks were composed of 497 edges and 360 nodes with 207 positive interactions (continuous lines) and 290 negative interactions (dotted lines). The green nodes represented down-regulated mRNAs and blue ones denoted up-regulated mRNAs.
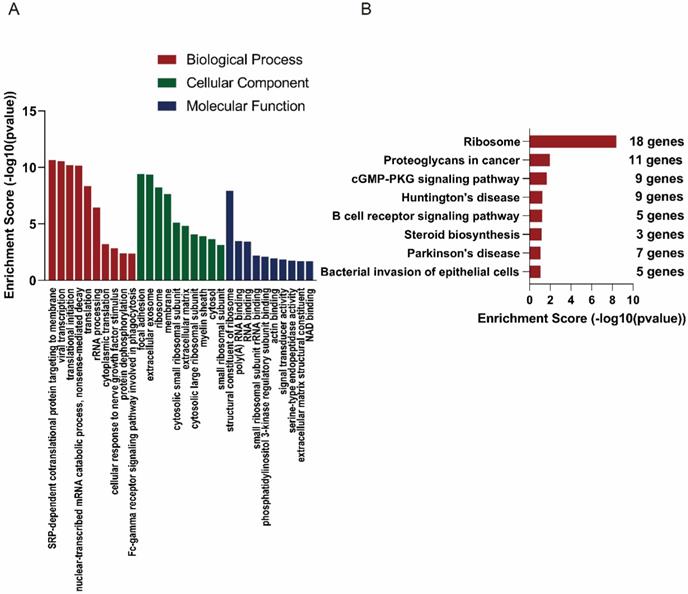
In order to explore the functions of the lncRNAs, GO and KEGG analysis were also performed based on the interacted mRNAs from CNC networks. SRP-dependent cotranslational protein targeting to membrane (ontology: biological process, GO:0006614), focal adhesion (ontology: cellular component, GO:000592) and structural constituent of ribosome (ontology: molecular function, GO:0003735) were the most significantly enriched GO terms of the interacted genes (Figure 5A). KEGG data indicated that those targeted mRNAs were enriched in Ribosome, Proteoglycans in cancer, cGMP-PKG signaling pathway (Figure 5B).
GO and KEGG analyses of interacted mRNAs in CNC networks. GO (A) and KEGG (B) analyses of CNC interacted mRNAs
Discussion
A number of studies have demonstrated that lncRNAs play important roles in the differentiation [24, 25] and biological behaviors [26-32] of trophoblast cells. The impaired trophoblast migration and invasion abilities may further lead to preeclampsia and miscarriage. PSTT is originated from abnormally differentiated intermediate trophoblasts [2]. However, aberrant lncRNAs expression profiles remain unknown in GTN, especially in PSTT. Presumably, the aberrantly expressed lncRNAs may contribute to the development and progression of PSTT. In the present study, expression levels of lncRNAs and mRNAs in four human PSTT tissues and four normal villi tissues were investigated by integrated microarray analysis. 2221 significantly altered mRNAs were identified (including 828 up-regulated; 1393 down-regulated) and 2260 differentially expressed lncRNAs (1247 upregulated; 1013 downregulated) in the PSTT compared to normal villi.
Our GO analysis showed that the most up-regulated mRNAs was involved in immune system process, while the most down-regulated mRNAs participate in mitochondrion.
Furthermore, the KEGG pathway analysis demonstrated that the aberrantly expressed mRNAs are mainly enriched in ribosome, metabolic pathways and biosynthesis of antibiotics (down-regulated mRNAs); measles, herpes simplex infection and chemokine signaling pathway (up-regulated mRNAs). Similarly, the most enriched GO terms are SRP-dependent cotranslational protein targeting to membrane, focal adhesion and structural constituent of ribosome of the lncRNA-interacted mRNAs. Furthermore, the top one enriched KEGG pathway is also ribosome. Such analysis inferred that PSTT might be mainly immune-regulated by ribosome. Besides, we also found that HMOX1, EPHB2, CLIC4 and CCL2 were up-regulated in PSTT, which were identified to be angiogenesis-related genes in previous studies [33-36]. Protein-protein interaction network based on ten validated mRNAs were shown in Figure S3.
The gene expressions of our research were correlated with previous reported biomarkers including GATA3, which was known expressed in 71% of PSTT [37]. Our results showed that compared to normal villi MAPK14, MAPK13, MAPK7 and MAPK1 were significantly down-regulated in PSTT, but Köbel et al. have reported that MAPK was highly expressed [38]. PLAC8, also named onzin, is a small protein (∼16 kDa) that was originally described to be highly expressed in mouse placenta [39] and its deficiency in mice may result in innate immunity deficiency [40]. We also found that PLAC8 is highly expressed in PSTT but not choriocarcinoma (Figure S2). Our previous study has indicated that PLAC8 may promote autophagic activity and improves the growth priority of human trophoblast cells [41]. We have also demonstrated that the overexpression of AQPEP//LVRN could influence the invasion of trophoblast [42]. In addition, NONHSAT003875/miR-363/EGR1 regulatory network in the carcinoma -associated fibroblasts was confirmed to control the angiogenesis of PSTT [43]. Further studies focusing on these proteins may be promising methods to a better understanding of the pathogenesis process in PSTT.
To further study the changed signaling pathways between different types of GTN. GSEA analysis were performed on the basis of data set GSE135727. Significant differences in signaling pathways were identified by nominal p < 0.05 and FDR q-value < 0.25 (Table S1). Four representative GSEA-enrichment plots were indicated in Figure S4. Compared to PSTT, choriocarcinoma tended to alter in Coagulation, KRAS, P53 and MYC targets pathways. KRAS and P53 signaling pathways were significantly enriched in ETT and CC. GSEA analysis also suggest that alteration in the MYC targets pathway might be one of the major pathways altered in PSTT when compared to normal villi.
In conclusion, we revealed that lncRNAs and mRNAs are differentially expressed in PSTT and normal villi by microarray analysis. GO and KEGG showed that immunotherapy may be effective in PSTT. Furthermore, GO and KEGG analyses of lncRNA-interacted mRNAs based on 6 validated lncRNAs were also performed, which indicated that these specific lncRNAs may be involved in the biological processes of ribosome that might contribute to PSTT pathogenesis. GSEA analysis based on GSE135727 and microarray data set among different types GTN were performed to study the altered signaling pathways. The function of these lncRNAs in PSTT required further research.
Supplementary Material
Supplementary figures and table.
Acknowledgements
This work was funded by the National Natural Science Foundation of China [grant number: 81971394, 81571457], the Shanghai Pujiang Program [grant number: 15PJ1400900].
Author Contributions
Conceptualization, Jianfeng Gan and Hongbo Zhao; Methodology, Sai Zhang, Xuan Feng and Zhi Wei; Investigation, Jianfeng Gan, Zhixian Chen and Yan Du; Writing - Original Draft, Jianfeng Gan; Writing -Review & Editing, Jianfeng Gan and Hongbo Zhao; Funding Acquisition, Hongbo Zhao and Congjian Xu; Resources, Hongbo Zhao and Congjian Xu.; Supervision, Hongbo Zhao and Congjian Xu; Literature search and critical revision, Jianfeng Gan; Conception of the work and final version approval, Jianfeng Gan and Hongbo Zhao. All authors read and approved the final manuscript.
Abbreviations
PSTT: placental site trophoblastic tumor; RT-qPCR: reverse transcription and quantitative real-time polymerase reaction; GO: Gene Ontology; KEGG: Kyoto Encyclopedia of Genes and Genomes; CNC: coding-non-coding gene co-expression; PCCs: Pearson correlation coefficients; SRP: signal-recognition particle; GTN: gestational trophoblastic neoplasms; lncRNAs: long non-coding RNAs; GSEA: gene set enrichment analysis; ETT: epithelioid trophoblastic tumor; CC: choriocarcinoma; PCA: principal component analysis.
Competing Interests
The authors have declared that no competing interest exists.
References
1. Kurman RJ, Scully RE, Norris HJ. Trophoblastic pseudotumor of the uterus: an exaggerated form of "syncytial endometritis" simulating a malignant tumor. Cancer. 1976;38:1214-26
2. Feng X, Wei Z, Zhang S, Du Y, Zhao H. A Review on the Pathogenesis and Clinical Management of Placental Site Trophoblastic. Frontiers in oncology. 2019;9:937
3. Feng X, Wei Z, Zhang S, Du Y, Zhao H. A Review on the Pathogenesis and Clinical Management of Placental Site Trophoblastic. Frontiers in oncology. 2019;9:937
4. Seckl MJ, Sebire NJ, Fisher RA, Golfier F, Massuger L, Sessa C. Gestational trophoblastic disease: ESMO Clinical Practice Guidelines for diagnosis, treatment and follow-up. Annals of oncology: official journal of the European Society for Medical Oncology. 2013;24(Suppl 6):vi39-50
5. Schmid P, Nagai Y, Agarwal R, Hancock B, Savage PM, Sebire NJ, Lindsay I, Wells M, Fisher RA, Short D, Newlands ES, Wischnewsky MB, Seckl MJ. Prognostic markers and long-term outcome of placental-site trophoblastic tumours: a retrospective observational study. Lancet (London, England). 2009;374:48-55
6. Lan C, Li Y, He J, Liu J. Placental site trophoblastic tumor: lymphatic spread and possible target markers. In. 2010 p. 430-7
7. Papadopoulos AJ, Foskett M, Seckl MJ, McNeish I, Paradinas FJ, Rees H, Newlands ES. Twenty-five years' clinical experience with placental site trophoblastic tumors. The Journal of reproductive medicine. 2002;47:460-4
8. Hassadia A, Gillespie A, Tidy J, Everard R G N J, Wells M, Coleman R, Hancock B. Placental site trophoblastic tumour: clinical features and management. Gynecologic oncology. 2005;99:603-7
9. Zhao J, Lv WG, Feng FZ, Wan XR, Liu JH, Yi XF, Qu PP, Xue FX, Wu YM, Zhao X, Ren T, Yang JJ, Xie X, Xiang Y. Placental site trophoblastic tumor: A review of 108 cases and their implications for prognosis and treatment. Gynecologic oncology. 2016;142:102-108
10. Lee H, Shin W, Jang YJ, Choi CH, Lee J, Bae D, Kim B. Clinical characteristics and outcomes of placental site trophoblastic tumor: experience of single institution in Korea. Obstetrics & gynecology science. 2018;61:319-327
11. Braga A, Mora P, de Melo AC, Nogueira-Rodrigues A, Amim-Junior J, Rezende-Filho J, Seckl MJ. Challenges in the diagnosis and treatment of gestational trophoblastic neoplasia worldwide. In. 2019 p. 28-37
12. Wang C, Zhu C, Xu J, Wang M, Zhao W, Liu Q, Zhao G, Zhang Z. The lncRNA UCA1 promotes proliferation, migration, immune escape and inhibits apoptosis in gastric cancer by sponging anti-tumor miRNAs. Molecular Cancer. 2019 18
13. Yang L, Lin C, Jin C, Yang JC, Tanasa B, Li W, Merkurjev D, Ohgi KA, Meng D, Zhang J, Evans CP, Rosenfeld MG. lncRNA-dependent mechanisms of androgen-receptor-regulated gene activation programs. Nature. 2013;500:598-602
14. Sun X, Yuan Y, Xiao Y, Lu Q, Yang L, Chen C, Guo Q. Long non-coding RNA, Bmcob, regulates osteoblastic differentiation of bone marrow mesenchymal stem cells. Biochemical and biophysical research communications. 2018;506:536-542
15. Wambecke A, Ahmad M, Morice P, Lambert B, Weiswald L, Vernon M, Vigneron N, Abeilard E, Brotin E, Figeac M, Gauduchon P, Poulain L, Denoyelle C, Meryet-Figuiere M. The lncRNA 'UCA1' modulates the response to chemotherapy of ovarian cancer through. Molecular oncology. 2021
16. Thakur KK, Kumar A, Banik K, Verma E, Khatoon E, Harsha C, Sethi G, Gupta SC, Kunnumakkara AB. Long noncoding RNAs in triple-negative breast cancer: A new frontier in the. Journal of cellular physiology. 2021
17. Xu W, Ding M, Wang B, Cai Y, Guo C, Yuan C. Molecular mechanism of the canonical oncogenic lncRNA MALAT1 in gastric cancer. Current medicinal chemistry. 2021
18. Wang X, Li X, Zhou Y, Huang X, Jiang X. Long non-coding RNA OIP5-AS1 inhibition upregulates microRNA-129-5p to repress. Cell biology and toxicology. 2021
19. Zhang M, Gao F, Yu X, Zhang Q, Sun Z, He Y, Guo W. LINC00261: a burgeoning long noncoding RNA related to cancer. Cancer Cell International. 2021 21
20. Wang ZK, Yang L, Wu LL, Mao H, Zhou YH, Zhang PF, Dai GH. Long non-coding RNA LINC00261 sensitizes human colon cancer cells to cisplatin therapy. Brazilian journal of medical and biological research = Revista brasileira de pesquisas medicas e biologicas. 2017;51:e6793
21. Cho EJ, Chun S, Park H, Sung CO, Kim K. Whole transcriptome analysis of gestational trophoblastic neoplasms reveals altered PI3K signaling pathway in epithelioid trophoblastic tumor. Gynecologic Oncology. 2020;157:151-160
22. Edgar R, Domrachev M, Lash AE. Gene Expression Omnibus: NCBI gene expression and hybridization array data repository. Nucleic acids research. 2002;30:207-10
23. Chen C, Chen H, Zhang Y, Thomas HR, Frank MH, He Y, Xia R. TBtools: An Integrative Toolkit Developed for Interactive Analyses of Big Biological Data. Molecular plant. 2020;13:1194-1202
24. Chu T, Mouillet J, Cao Z, Barak O, Ouyang Y, Sadovsky Y. RNA Network Interactions During Differentiation of Human Trophoblasts. Frontiers in Cell and Developmental Biology. 2021 9
25. You J, Wang W, Chang H, Yi Y, Zhao H, Zhu H, Sun Y, Tang M, Wang C, Sang Y, Feng G, Cheng S, Leung PCK, Zhu Y. The BMP2 Signaling Axis Promotes Invasive Differentiation of Human Trophoblasts. Frontiers in cell and developmental biology. 2021;9:607332
26. Wang R, Zou L, Yang X. microRNA-210/ Long non-coding RNA MEG3 axis inhibits trophoblast cell migration and invasion by suppressing EMT process. Placenta. 2021;109:64-71
27. Chen X, Guo D, Yin T, Yang J. Non-Coding RNAs Regulate Placental Trophoblast Function and Participate in Recurrent Abortion. Frontiers in Pharmacology. 2021 12
28. Chi Z, Gao Q, Sun Y, Zhou F, Wang H, Shu X, Zhang M. LINC00473 downregulation facilitates trophoblast cell migration and invasion via the. Environmental toxicology. 2021
29. Fan X, Lou J, Zheng X, Wang Y, Wang J, Luo M, Hu M. Interference with lncRNA NEAT1 promotes the proliferation, migration, and invasion. Immunopharmacology and immunotoxicology. 2021;43:334-342
30. Xie J, Liang T, Zhao J, Xu Z, Tian P, Wang R, Mi C, Huang W, Chen W, Zhang H. Lnc-HZ08 regulates BPDE-induced trophoblast cell dysfunctions by promoting PI3K. Cell biology and toxicology. 2021
31. Xu Z, Tian P, Guo J, Mi C, Liang T, Xie J, Huang W, Dai M, Chen W, Zhang H. Lnc-HZ01 with m6A RNA methylation inhibits human trophoblast cell proliferation and. The Science of the total environment. 2021;776:145950
32. Chen Y, Li Z, Chen X, Zhang S. Long non-coding RNAs: From disease code to drug role. Acta pharmaceutica Sinica. B. 2021;11:340-354
33. Luu Hoang KN, Anstee JE, Arnold JN. The Diverse Roles of Heme Oxygenase-1 in Tumor Progression. Frontiers in immunology. 2021;12:658315
34. Sato S, Vasaikar S, Eskaros A, Kim Y, Lewis JS, Zhang B, Zijlstra A, Weaver AM. EPHB2 carried on small extracellular vesicles induces tumor angiogenesis via. JCI insight. 2019 4
35. Edwards JC, Bruno J, Key P, Cheng Y. Absence of chloride intracellular channel 4 (CLIC4) predisposes to acute kidney. BMC nephrology. 2014;15:54
36. Bonapace L, Coissieux M, Wyckoff J, Mertz KD, Varga Z, Junt T, Bentires-Alj M. Cessation of CCL2 inhibition accelerates breast cancer metastasis by promoting angiogenesis. Nature. 2014;515:130-133
37. Banet N, Gown AM, Shih I, Kay Li Q, Roden RBS, Nucci MR, Cheng L, Przybycin CG, Nasseri-Nik N, Wu L, Netto GJ, Ronnett BM, Vang R. GATA-3 expression in trophoblastic tissues: an immunohistochemical study of 445 cases, including diagnostic utility. In. 2015 p. 101-8
38. Köbel M, Pohl G, Schmitt WD, Hauptmann S, Wang T, Shih I. Activation of Mitogen-Activated Protein Kinase Is Required for Migration and Invasion of Placental Site Trophoblastic Tumor. The American Journal of Pathology. 2005;167:879-885
39. Tatura M, Schmidt H, Haijat M, Stark M, Rinke A, Diels R, Lawlor RT, Scarpa A, Schrader J, Hackert T, Schimmack S, Gress TM, Buchholz M. Placenta-Specific 8 Is Overexpressed and Regulates Cell Proliferation in Low-Grade Human Pancreatic Neuroendocrine Tumors. Neuroendocrinology. 2020;110:23-34
40. Ledford JG, Kovarova M, Koller BH. Impaired host defense in mice lacking ONZIN. Journal of immunology (Baltimore, Md.: 1950). 2007;178:5132-43
41. Feng X, Wei Z, Tao X, Du Y, Wu J, Yu Y, Yu H, Zhao H. PLAC8 promotes the autophagic activity and improves the growth priority of human trophoblast cells. The FASEB Journal. 2021 35
42. Feng X, Wei Z, Zhang S, Zhou J, Wu J, Luan B, Du Y, Zhao H. Overexpression of LVRN impedes the invasion of trophoblasts by inhibiting epithelial-mesenchymal transition. Acta Biochimica et Biophysica Sinica. 2021;53:249-257
43. Zhang S, Tao X, Cao Q, Feng X, Wu J, Yu H, Yu Y, Xu C, Zhao H. lnc003875/miR-363/EGR1 regulatory network in the carcinoma -associated fibroblasts controls the angiogenesis of human placental site trophoblastic tumor (PSTT). Experimental Cell Research. 2020;387:111783
Author contact
![]() Corresponding authors: Hongbo Zhao, 413 Zhaozhou Rd, Shanghai 200011, China. Congjian Xu, 128 Shenyang Rd, Shanghai 200090, China. E-mail addresses: zhaohongbo01com (H. Zhao); xucongjiancom (C. Xu).
Corresponding authors: Hongbo Zhao, 413 Zhaozhou Rd, Shanghai 200011, China. Congjian Xu, 128 Shenyang Rd, Shanghai 200090, China. E-mail addresses: zhaohongbo01com (H. Zhao); xucongjiancom (C. Xu).