Impact Factor ISSN: 1449-1907

 Global reach, higher impact
Int J Med Sci 2021; 18(15):3478-3487. doi:10.7150/ijms.63402 This issue Cite
Research Paper
Bioinformatics analysis identified shared differentially expressed genes as potential biomarkers for Hashimoto's thyroiditis-related papillary thyroid cancer
Chang Liu1, Yu Pan1, Qinyu Li2 ![]() , Yifan Zhang1
, Yifan Zhang1 ![]()
1. Department of Nuclear Medicine, Ruijin Hospital, Shanghai Jiao Tong University School of Medicine, Shanghai 200025, China.
2. Department of General Surgery, Ruijin Hospital, Shanghai Jiao Tong University School of Medicine, Shanghai 200025, China.
Received 2021-6-1; Accepted 2021-7-27; Published 2021-8-13
Abstract

Background: Although the etiology of Hashimoto's thyroiditis (HT), a common autoimmune endocrine disease, is unknown, studies suggest a potential association with genetic factors and environmental conditions inducing excessive iodine intake. Additionally, HT patients have a high risk of papillary thyroid cancer (PTC), which is probably related to the chronic inflammation and autoimmune pathologic process occurring in HT, as it is thought to be associated with neoplastic transformation.
Methods: Bioinformatics approaches can identify differentially expressed genes (DEGs) and analyze DEG functions in diseases. R software was used in this study to identify DEGs in HT and PTC using data in Gene Expression Omnibus (GEO). The online tools DAVID, Reactome, and AmiGO were employed for annotation, visualization, and integration of DEGs related to HT and PTC, and the STRING database and Cytoscape software were applied to predict and visualize protein-protein networks (PPIs) for DEG-encoded proteins. Coexpressed DEGs in HT and PTC were validated by reverse transcription PCR (RT-PCR).
Results: In total, 326, 231, and 210 DEGs in HT specimens and samples of central PTC and PTC invasive areas, respectively, were detected. According to the PPI network, PTPN6, HLA-A, C3AR1, LCK and ITGB2 are hub genes among HT-DEGs, whereas FN1, CDH2, SERPINA1, and CYR61 are PTC-DEG hub genes. The shared DEGs LTF and CCL21 were validated by RT-PCR. Both bioinformatics and RT-PCR analyses showed LTF and CCL21 to be upregulated in HT tissues and downregulated in PTC tissues.
Conclusions: We identified that expression of LTF and CCL21 are significantly different in HT and PTC, suggesting an underlying association between HT and PTC.
Keywords: Papillary thyroid cancer, Gene analysis, Biomarkers, Hashimoto's thyroiditis
Introduction
Hashimoto's thyroiditis (HT), also known as lymphocytic thyroiditis, is a common autoimmune endocrine disease with an increasing prevalence in recent decades [1, 2]. Chronic inflammation is connected to neoplastic transformation, and it is known that patients with autoimmune diseases have increased risks for some types of tumors [3, 4], with neoplastic transformation often occurring [5-8]. For example, there is evidence that HT patients have a high risk of thyroid cancer, the most common endocrine malignancy, than the general population [9-15]. According to the literature, the pathogenesis of HT-related thyroid cancer may be due to the diffuse lymphocyte infiltration, apoptosis of thyroid epithelial cells, fibrous replacement, and follicular destruction in HT.
However, controversy exists regarding whether HT is related to papillary thyroid cancer (PTC), which accounts for 95% of all thyroid cancer cases and has increasing prevalence worldwide. Some studies have found that high levels of antithyroid peroxidase antibody (TPO-Ab) and increased thyroid-stimulating hormone (TSH) are related to HT-related thyroid tumors. Thyroid cancer patients with HT have higher TSH levels than those with benign nodules. Higher TSH levels have been found to be related to terminal cancer in Caucasian patients with well-differentiated thyroid cancer [16-20]. Moreover, Kim et al [21] reported a very strong association between PTC and HT (odds ratio [OR] =2.96; 95% CI, 1.81-4.85; P < 0.001). On the other hand, Haymart et al [16, 22] found only borderline significance for the association between HT and PTC (P = 0.051).
Clinically, diagnosis of HT is mainly based on US-FNA, and tools for accurately predicting the risk of PTC are lacking [23]. In this study, we analyzed and validated shared differentially expressed genes (DEGs) of HT and PTC, which may be used as biomarkers for HT-related PTC.
Methods
Gene expression data acquisition
Two expression profiling array datasets (GSE29315 and GSE6004) were downloaded from Gene Expression Omnibus (GEO) [24] and analyzed using Affymetrix Human Genome Array with the annotation platforms GPL8300 [HG_U95Av2] and GPL570 [HG-U133_Plus_2]. The GSE29315 dataset contains 6 HT samples and 8 thyroid hyperplasia (TH) samples. GSE6004 includes 7 PTC samples with a paired central PTC and invasive areas obtained from 7 patients, and 4 control thyroid tissue samples.
Data processing
The quality of the profile data used was assessed by relative log expression (RLE) analysis through the affyPLM package of R software [25]. Boxplots for GSE29315 and GSE6004 are shown in supplement Fig 1. Robust multiarray averages (RMAs) and mismatch probes (PMs) were created for processing the datasets, including background correction, normalization, expression calculation, and probe integration. The classical Bayesian method utilized by the limma package in R software was applied to analyze DEGs for three comparisons (HT vs TH, central area of PTC vs normal, and invasive area of PTC vs normal). P-values were adjusted based on the Benjamini-Hochberg method, and fold-changes (FCs) were calculated by the false discovery rate (FDR) procedure. PTC-DEGs with |log2-fold change| > 1.5 and P < 0.05 were selected. HT-DEGs were filtered according to the criteria |log2-fold change| > 2 and P < 0.05. A heat map of DEGs was constructed using the gplots package, and Venn diagrams were generated using Venny 2.1 (https://bioinfogp.cnb.csic.es/tools/venny/index.html) to identify overlapping genes.
Annotation and functional characterization of DEGs
Gene Ontology (GO) [26] annotation of characteristic genes functions for three categories, biological process (BP), cellular component (CC), and molecular function (MF), was performed, and Kyoto Encyclopedia of Genes and Genome (KEGG) [27] was used to analyze signaling pathways. The identification of DEG functions and signaling pathways can be annotated, visualized, and integrated using several online tools, including DAVID (https://david-d.ncifcrf.gov/) [28], Reactome [29], and AmiGO. [30]. In this study, we used DAVID to perform GO functional enrichment analysis for DEGs of HT and PTC, the AmiGO database to verify enrichment of GO terms, and the DAVID and Reactome databases to analyze KEGG signaling pathways, with a threshold of P < 0.05.
Construction of protein-protein interaction (PPI) networks
The STRING database (v11.0) was used to assess protein interactions, including physical and functional interactions. The results were imported into Cytoscape software (v3.7.2) for visualization of the relationships of interacting genes [31], and interactions with a confidence score > 0.4 were considered significant.
Association of DEGs shared between thyroid and endocrine diseases and cancer
Associations between DEGs and related diseases were analyzed by using Comparative Toxicogenomic Database (CTD). We assessed DEGs in endocrine diseases and cancers to evaluate relationships between gene products, to produce extensive networks and to predict novel associations [32].
HT and PTC patient specimens
This study enrolled five surgically confirmed PTC patients from November 2019 to December 2019; all specimens included HT tissues. We divided the specimens into 3 groups: HT, PTC, and corresponding PTC-adjacent normal tissues, which were used as the normal control. The study design was approved by the Ethical Review Board of Ruijin Hospital, Shanghai Jiao Tong University School of Medicine. All patients signed informed consent.
Quantitative real-time reverse transcription PCR (qRT-PCR)
RNA was extracted from tissues using TRIzol (Sangon Biotech, Shanghai, China). All RNAs were first reverse-transcribed to cDNA using PrimeScript™ RT Master Mix (TaKaRa Bio Inc., Japan) (37 °C for 15 min, 85 °C for 5 sec, and cooled to 4 °C). RT-PCR of PC and the reference gene β-actin was performed following the protocol of the TB Green® Premix Ex Taq™ II kit (TaKaRa Bio Inc., Japan) and an Applied Biosystems 7500 Real-Time PCR System. The temperature cycling protocol consisted of 30 sec denaturation at 95 °C, followed by 40 cycles of 95 °C for 5 sec and 60 °C for 34 sec; the 40 cycles were followed by 95 °C for 15 sec, 60°C for 1 min, and 95 °C for 15 sec. The primers used in this study are provided in Supplementary Materials Table S2. The gene expression data were normalized to those of β-actin. In this study, cycle threshold (Ct) values below 35 were included. The 2-ΔΔCt method was applied to evaluate gene expression levels.
Results
Identification of DEGs in two GEO datasets
There were 67,302 probes corresponding to 8,575 and 20,461 genes identified in the GSE29315 and GSE6004 datasets, respectively. We confirmed 231 and 210 DEGs from the central and invasive areas of PTC specimens by comparing with control thyroid tissue samples, respectively. A total of 326 DEGs were found in HT compared with thyroid hyperplasia samples.
Functional analysis of HT- and PTC-DEGs
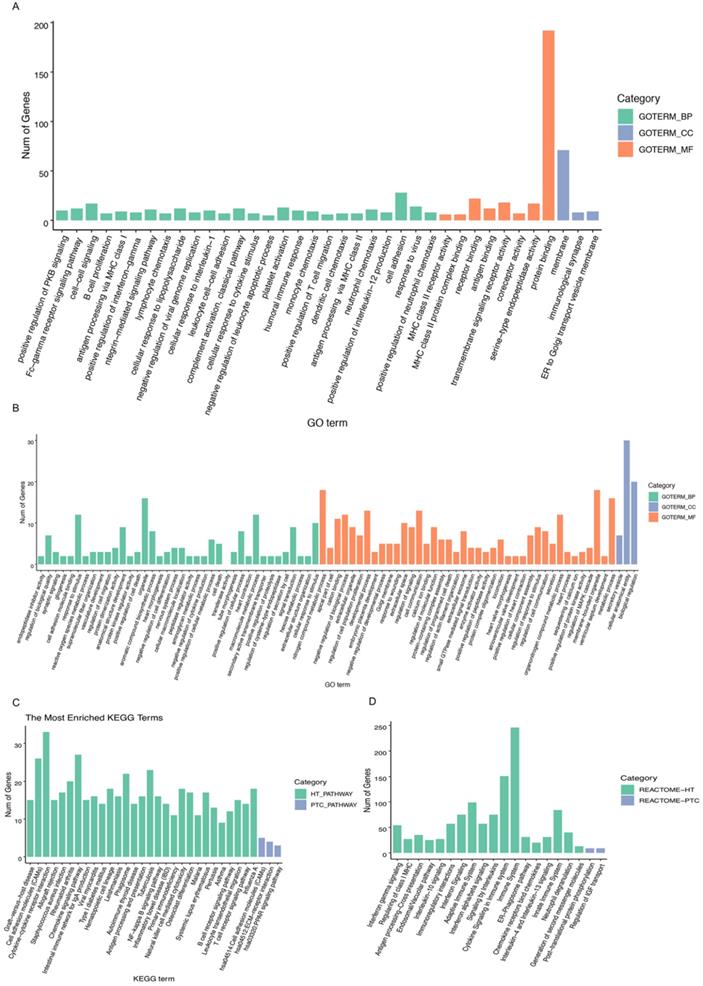
A heatmap of HT-related DEGs related to the immune response and cancer signaling is depicted in Fig. 1. In addition, Fig. 2 shows PTC-DEGs associated with cancer signaling, energy metabolism, and gene regulation. Based on DAVID analysis, the most enriched biological processes of HT-DEGs were the immune response (fold enrichment: 9.11; P value: 1.15E-47), inflammation (fold enrichment: 6.04; P value: 7.97E-21), signaling pathways mediated by chemokines (fold enrichment: 13.51; P value: 1.12E-14), type I interferon signaling (fold enrichment: 14.16; P value: 3.32E-14), and B cell receptor signaling (fold enrichment: 15.79; P value: 3.84E-14). In terms of cellular components, the external side of the plasma membrane (fold enrichment: 9.14; P value: 5.28E-22) and extracellular space (fold enrichment: 2.64; P value: 3.57E-12) were identified. Enriched molecular functions were found to be mainly related to chemokine activity (fold enrichment: 14.97; P value: 3.78E-11), peptide antigen binding (fold enrichment: 18.15; P value: 1.96E-08) and transmembrane signaling receptor activity (fold enrichment: 4.74; P value: 2.65E-07) (Fig. 3A).
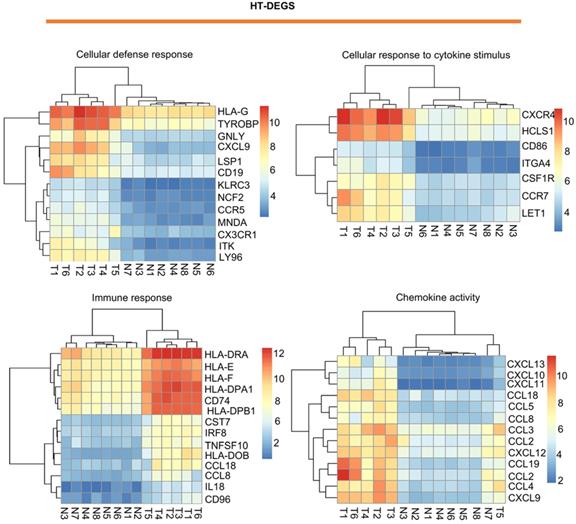
Visualization of HT-related DEGs with a heatmap: DEGs related to the terms cellular defense response, cellular response to cytokine stimulus, immune response, and chemokine activity. T indicates HT tissues, and N indicates thyroid hyperplasia tissues. Red indicates high expression, and blue indicates low expression.
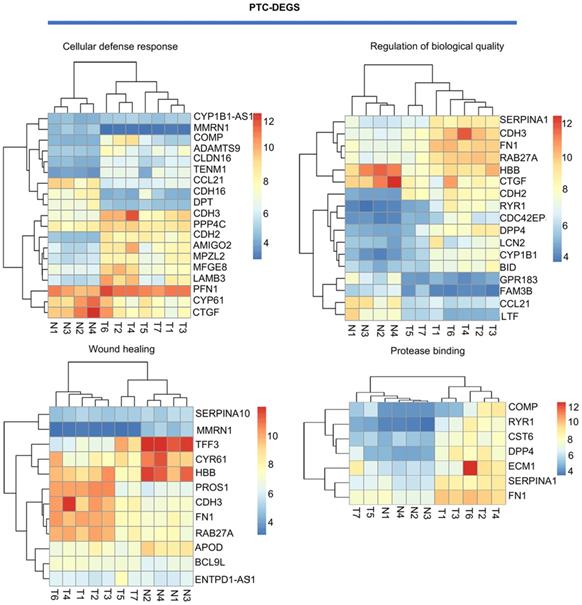
Visualization of PTC-related DEGs with a heatmap: DEGs related to the terms cell adhesion, wound healing, protease binding, and regulation of biological quality. T indicates PTC tissues, and N indicates normal thyroid tissues. Red indicates high expression, and blue indicates low expression.
Biological process and pathway analysis: A, B GO categories related to HT-DEGs and PTC-DEGs. Green indicates biological process, blue indicates cellular component, and orange indicates molecular function. C, D KEGG and Reactome pathway analyses of DEGs shared between HT and PTC. Green indicates HT-related pathways, and blue indicates PTC-related pathways.
GO-terms of co-expressed genes on AmiGO database
| Gene | GO class (direct) | Evidence | Evidence | Reference |
|---|---|---|---|---|
| LTF | ossification | IEA | UniProtKB-KW:KW-0892 | GO_REF:0000037 |
| regulation of cytokine production | IDA | PMID:20345905 | ||
| innate immune response in mucosa | IDA | PMID:12037568 | ||
| DNA binding | IEA | UniProtKB-KW:KW-0238 | GO_REF:0000037 | |
| iron ion binding | IDA | PMID:12037568 | ||
| protein binding | IPI | UniProtKB:P27958 | PMID:12522210 | |
| proteolysis | IEA | UniProtKB-KW:KW-0645 | GO_REF:0000037 | |
| negative regulation of ATPase activity | IMP | PMID:25193851 | ||
| negative regulation of apoptotic process | ISS | UniProtKB:P24627 | GO_REF:0000024 | |
| negative regulation of viral genome replication | IMP | PMID:25193851 | ||
| positive regulation of NF-kappaB transcription factor activity | IDA | PMID:20345905 | ||
| negative regulation of tumor necrosis factor (ligand) superfamily member 11 production | ISS | GO_REF:0000024 | ||
| negative regulation of osteoclast development | ISS | GO_REF:0000024 | ||
| CCL21 | positive regulation of dendritic cell antigen processing and presentation | ISS | UniProtKB:P84444 | GO_REF:0000024 |
| protein binding | IPI | UniProtKB:Q86YL7 | PMID:14978162 | |
| immune response | TAS | PMID:10861057 | ||
| G protein-coupled receptor signaling pathway | IDA | PMID:18308860 | ||
| chemokine activity | ISS | UniProtKB:P84444 | GO_REF:0000024 | |
| positive regulation of glycoprotein biosynthetic process | ISS | UniProtKB:P84444 | GO_REF:0000024 | |
| positive regulation of receptor-mediated endocytosis | ISS | UniProtKB:P84444 | GO_REF:0000024 | |
| cell maturation | ISS | UniProtKB:P84444 | GO_REF:0000024 | |
| cellular response to chemokine | ISS | UniProtKB:P84444 | GO_REF:0000024 | |
| G protein-coupled receptor signaling pathway | IBA | UniProtKB:P13501 | PMID:21873635 | |
| cellular response to interleukin-1 | IBA | UniProtKB:P13501 | PMID:21873635 | |
| cellular response to tumor necrosis factor | IBA | UniProtKB:P13501 | PMID:21873635 | |
| CCR chemokine receptor binding | IBA | UniProtKB:Q9Y258 | PMID:21873635 | |
| lymphocyte chemotaxis | IBA | UniProtKB:Q9Y258 | PMID:21873635 | |
| positive regulation of ERK1 and ERK2 cascade | IBA | UniProtKB:Q99731 | PMID:21873635 | |
| inflammatory response | IBA | UniProtKB:P78423 | PMID:21873635 |
NOTES: ISS sequence similarity evidence used in manual assertion, IEA evidence used in automatic assertion, TAS traceable author statement used in manual assertion, IPI physical interaction evidence used in manual assertion, IBA biological aspect of ancestor evidence used in manual assertion, IDA direct assay evidence used in manual assertion.
For PTC-DEGS, the biological process terms enriched were mainly related to the regulation of cell-cell adhesion (fold enrichment: 4.03; P value: 1.99E-05), the regulation of neuropeptides (fold enrichment: 7.33; P value: 0.001), blood coagulation (fold enrichment: 4.69; P value: 0.003), and gene expression (fold enrichment: 3.77; P value: 0.005). The PTC-DEGs also showed enrichment of the terms extracellular region (fold enrichment: 2.71; P value: 2.54E-07) and proteinaceous extracellular matrix (fold enrichment: 5.91; P value: 5.85E-06) for the cellular component category. With respect to molecular function, the terms protease binding (fold enrichment: 10.78; P value: 8.96E-06), heparin binding (fold enrichment: 7.66; P value: 2.24E-05), and calcium ion binding (fold enrichment: 2.66; P value: 0.002) were identified as enriched (Fig. 3B). Subsequently, the AmiGO database was used to verify GO term enrichment, as indicated in Supplementary Materials Table S1.
The results of KEGG pathway analysis are provided in Fig. 3C, suggesting HT-DEG-related pathways to be mainly associated with graft-versus-host disease (fold enrichment: 16.54; P value: 4.15E-14), cell adhesion molecules (CAMs) (fold enrichment: 6.66; P value: 4.66E-14), cytokine-cytokine receptor interactions (fold enrichment: 4.94; P value: 5.08E-14), the intestinal immune network for IgA production (fold enrichment: 11.61; P value: 1.24E-11), and the NF-κB signaling pathway (fold enrichment: 6.69; P value: 9.52E-09). KEGG terms regulation of cellular adhesion (fold enrichment: 4.75; P value: 0.019) and interaction of extracellular matrix-related receptors (fold enrichment: 6.20; P value: 0.025) were enriched for PTC-DEGs. Function and pathway enrichment analyses via the Reactome database were used to identify additional relationships, which are shown in Fig. 3D.
PPI networks of HT-DEGs and PTC-DEGs
The HT-DEGs and PTC-DEGs were further imported into the online database STRING, respectively. Interacting genes were examined after removing genes without interaction. A total of 184 nodes were included in the PPI network of HT-DEGs and 89 nodes in the PPI network of PTC-DEGs. The PPI network was visualized in Cytoscape software, as illustrated in Fig. 4. Gene scoring identified significant nodes related to HT, including protein tyrosine phosphatase nonreceptor 6 (PTPN6; degree = 31), human leukocyte antigen A (HLA-A; degree = 39), C3a anaphylatoxin chemotactic receptor (C3AR1; degree = 30), tyrosine protein kinase Lck (LCK; degree = 28), and integrin beta-2 (ITGB2; degree = 23) (Fig. 4A). Hub genes fibronectin (FN1; degree = 22), cadherin (CDH2; degree = 13), alpha-1-antitrypsin (SERPINA1; degree = 11), and cysteine-rich 61 (CYR61; degree = 11) were identified in the PTC-DEG PPI network (Fig. 4B).
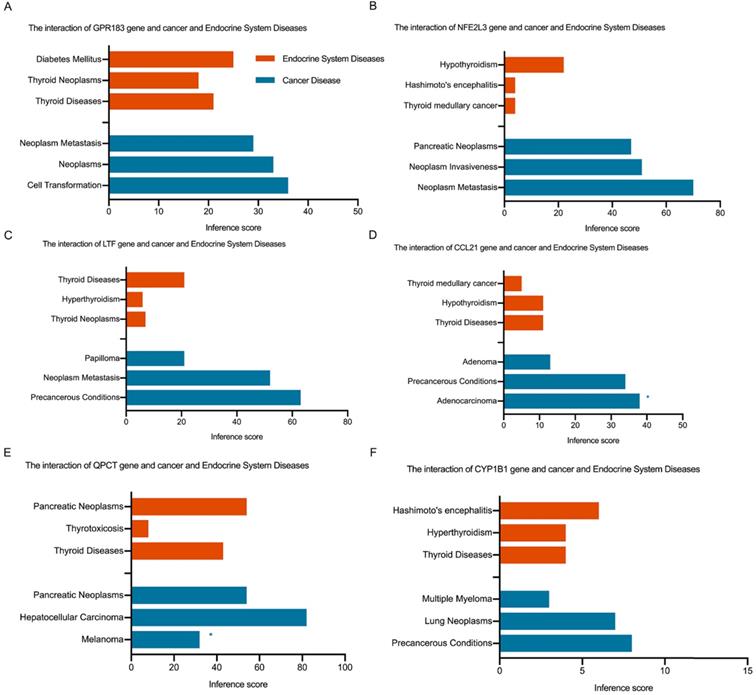
Shared DEG analysis with PPI networks and Venn diagrams: A, B PPI networks of HT- and PTC-related DEGs (threshold > 0.4). Red indicates hub genes. C Shared DEGs related to HT and the center and invasive areas of PTC. Shared genes, including GPR183, NFE2 L3, LTF, CCL21, QPCT, and CYP1B1, are shown.
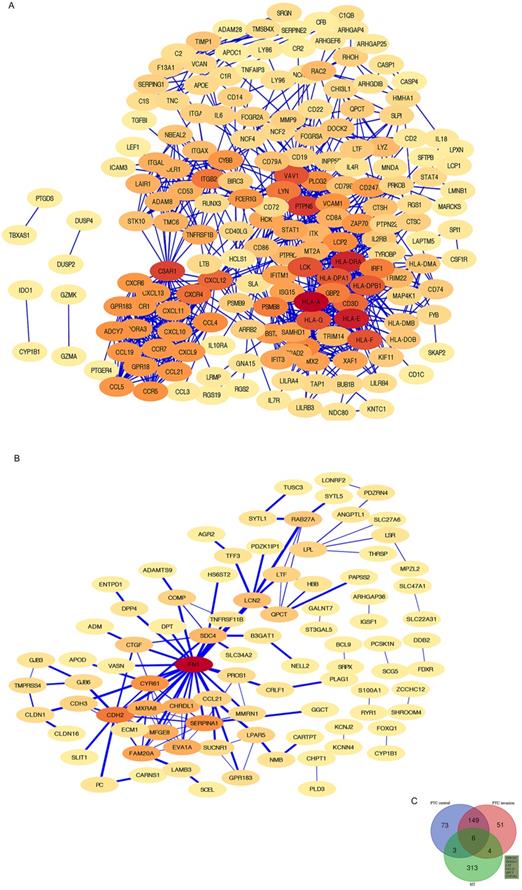
Fig. 4C shows the Venn diagram used to identify shared DEGs between the 2 groups (HT and PTC). Notably, a total of six shared DEGs (G-protein coupled receptor 183 (GPR183, log FC is 2.51 in HT vs -2.29 in PTC), NRF2-related factor 3 (NFE2L3, log FC is 2.00 in HT vs 1.91 in PTC), lactotransferrin (LTF, log FC is 2.59 in HT vs -2.71 in PTC), C-C motif chemokine 21 (CCL21, log FC is 3.65 in HT vs -2.58 in PTC), glutamine-peptide cyclotransferase-like protein (QPCT, log FC is 2.32 in HT vs 2.63 in PTC), and cytochrome P450 1B1 (CYP1B1, log FC is 2.89 in HT vs 2.43 in PTC)) were identified. The CTD database was used to analyze the targets of the shared DEG-associated diseases, and the results are provided in Fig. 5. Overall, the results suggest that DEGs shared between HT and PTC correlate with cancer and thyroid diseases.
Interaction of shared DEGs, endocrine system diseases, and cancer diseases identified via the CTD database. Orange indicates shared DEGs related to endocrine system diseases, and blue indicates shared DEGs related to cancer diseases. * indicates proven evidence in this disease.
Validation of shared DEGs
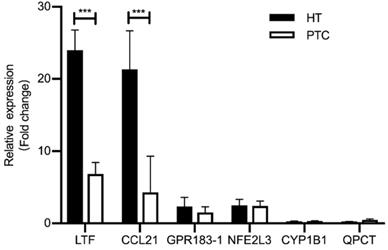
We performed quantitative RT-PCR (qRT-PCR) using clinical samples to further verify the expression of shared DEGs. As illustrated in Fig. 6, compared with the PTC-adjacent normal tissues group, the HT group showed significantly increased mRNA levels of LTF and CCL21 (P < 0.05) and the PTC group showed significantly decreased mRNA levels of LTF and CCL21 (P < 0.05). These results were consistent with the findings of bioinformatics analysis.
Expression of shared DEGs in HT and PTC samples compared with the control (n=5/group), as assessed by RT-PCR. *** P <0.001; * P <0.05.
Discussion
Malignant events in the thyroid may be related to hypothyroidism and immune dysfunction, as chronic inflammation is thought to induce neoplastic transformation [3]. Therefore, it is meaningful to assess associations between autoimmune thyroiditis and PTC; with subsequent development of tumor biomarkers as diagnostic and therapeutic targets. Prior studies have suggested that immune and inflammatory responses are significantly associated with HT and PTC occurrence.
In our study, some hub genes strongly related to the regulation of neoplastic transformation were identified among DEGs in HT. Mehta's group [33] used microarray analysis to detect that HLA class I deficiency frequently occurs in cervical carcinoma. Another study reported that HLA class I may have an important biological role as a mediator connecting immune-mediated recognition and tumors [34]. With the help of HLA class I, cancer cells can escape identification and lysis by cytotoxic T lymphocytes as well as natural killer (NK) cell-mediated cytotoxicity [35, 36]. Tyrosine kinase inhibitors (TKIs), which block tyrosine kinase activation, have been evaluated for the treatment of many kinds of cancer [37]. Human PTC cell lines with rearrangements can be inhibited by pyrazolo[3,4-d] pyrimidine (PP), which is the most prominent inhibitor of LCK [38, 39]. ITGB2 is a type of integrin that binds to intercellular adhesion molecule 1 on stromal cells, promoting cell adhesion to the extracellular matrix [40, 41]. In a case-controlled study of ITGB1 and ITGB2 gene single-nucleotide polymorphisms (SNPs) in PTC patients, it was reported that ITGB2 promoter polymorphisms are closely related to the development of PTC [42]. Accordingly, there may be a connection between genetic mutations and autoimmune inflammatory diseases and cancer.
We employed RT-PCR to validate the importance of shared DEGs in clinical samples and found that mRNA expression levels of LTF and CCL21 were higher in HT tissues but lower in PTC tissues. LTF is an iron-binding protein related to the serum iron transport protein transferrin [43] that promotes B cell migration and maturation and the immune response, and B cells in turn enhances the antibody response by promoting the maturation of T cell precursors [44]. Using indirect immunofluorescence, Afeltra's group identified anti-lactoferrin antibodies in 2 of 11 (18.1%) HT cases [45]. In addition, LTF gene expression is decreased in thyroid cancer patients [46]. These results are consistent with the findings of our study.
Infiltration of lymphocytes into the thyroid gland and the formation of lymph node-like structures are hallmarks of HT [47], and their occurrence correlates with expression of the chemokine CCL21 [47, 48]. CCL21 is a ligand of the chemokine receptor CCR7, activation of which promotes thyroid carcinoma growth [49]. Indeed, CCL21 was significantly associated with lymphocyte infiltration in an RNA sequencing study using clinical samples from patients with T1N0 and T2-3N1 thyroid tumors carrying wildtype BRAF and the V600E mutation [50]. In our study, CCL21 was also more highly expressed in HT tissues than in PTC tissues.
Our study is the first to use bioinformatics analyses to identify and qPCR to verify shared DEGs related to HT and PTC. In addition, to identify connections between genetic mutations and HT and PTC, we analyzed some hub genes among HT-DEGs that are closely related to the regulation of neoplastic transformation. However, the main limitation of this research is that the microarray and qPCR analyses were based on gene and not protein expression; hence, the biomarkers identified in this study can only be utilized as gene markers. More studies should be performed to validate these DEGs in the future.
Supplementary Material
Supplementary figure S1.
Supplementary tables.
Acknowledgements
We thank the members of our laboratory for helpful discussion.
Funding
This work was supported by grants from the National Natural Science Foundation of China (Nos. 81971644, 81801726, 81671720, and 81471688), the Foundation of National Facility for Translational Medicine (Shanghai) (TMSK-2020-116), and the Shanghai Sailing Program (18YF1414300).
Availability of data and materials
Some or all data, models, or code generated or used during the study are available in a repository or online in accordance with funder data retention policies (provided full citations that include URLs or DOIs).
Ethics approval and consent to participate
The project was approved by the Ethical Committee of the Ruijin Hospital of Shanghai Jiaotong University School of Medicine (SN-2019-002).
Patient consent for publication
All patients signed informed consent forms.
Author contributions
Chang Liu and Yu Pan conducted all data analyses and contributed equally to this work. Yifan Zhang and Qinyu Li designed and supervised the project. The manuscript was written by Chang Liu.
Competing Interests
The authors have declared that no competing interest exists.
References
1. Zhang QY, Liu W, Li L, Du WH, Zuo CL, Ye XP. et al. Genetic study in a large cohort supported different pathogenesis of Graves' diseases and Hashimoto's hypothyroidism. J Clin Endocrinol Metab. 2020
2. Caturegli P, De Remigis A, Rose NR. Hashimoto thyroiditis: clinical and diagnostic criteria. Autoimmun Rev. 2014;13:391-7
3. Balkwill F, Mantovani A. Inflammation and cancer: back to Virchow? Lancet. 2001;357:539-45
4. Bizzaro N, Antico A, Villalta D. Autoimmunity and Gastric Cancer. Int J Mol Sci. 2018 19
5. Villagelin DG, Santos RB, Romaldini JH. Is diffuse and peritumoral lymphocyte infiltration in papillary thyroid cancer a marker of good prognosis? J Endocrinol Invest. 2011;34:e403-8
6. Kotani T, Aratake Y, Ohtaki S. [Apoptosis in Hashimoto's thyroiditis]. Rinsho Byori. 1997;45:1038-47
7. Ragusa F, Fallahi P, Elia G, Gonnella D, Paparo SR, Giusti C. et al. Hashimotos' thyroiditis: Epidemiology, pathogenesis, clinic and therapy. Best Pract Res Clin Endocrinol Metab. 2019;33:101367
8. Silva de Morais N, Stuart J, Guan H, Wang Z, Cibas ES, Frates MC. et al. The Impact of Hashimoto Thyroiditis on Thyroid Nodule Cytology and Risk of Thyroid Cancer. J Endocr Soc. 2019;3:791-800
9. Roth MY, Witt RL, Steward DL. Molecular testing for thyroid nodules: Review and current state. Cancer. 2018;124:888-98
10. Eheman C, Henley SJ, Ballard-Barbash R, Jacobs EJ, Schymura MJ, Noone AM. et al. Annual Report to the Nation on the status of cancer, 1975-2008, featuring cancers associated with excess weight and lack of sufficient physical activity. Cancer. 2012;118:2338-66
11. Haugen BR. 2015 American Thyroid Association Management Guidelines for Adult Patients with Thyroid Nodules and Differentiated Thyroid Cancer: What is new and what has changed? Cancer. 2017;123:372-81
12. Leenhardt L, Bernier MO, Boin-Pineau MH, Conte Devolx B, Marechaud R, Niccoli-Sire P. et al. Advances in diagnostic practices affect thyroid cancer incidence in France. Eur J Endocrinol. 2004;150:133-9
13. Ahn HS, Kim HJ, Welch HG. Korea's thyroid-cancer "epidemic"-screening and overdiagnosis. N Engl J Med. 2014;371:1765-7
14. Veiga LH, Neta G, Aschebrook-Kilfoy B, Ron E, Devesa SS. Thyroid cancer incidence patterns in Sao Paulo, Brazil, and the U.S. SEER program, 1997-2008. Thyroid. 2013;23:748-57
15. Ito Y, Nikiforov YE, Schlumberger M, Vigneri R. Increasing incidence of thyroid cancer: controversies explored. Nat Rev Endocrinol. 2013;9:178-84
16. Haymart MR, Repplinger DJ, Leverson GE, Elson DF, Sippel RS, Jaume JC. et al. Higher serum thyroid stimulating hormone level in thyroid nodule patients is associated with greater risks of differentiated thyroid cancer and advanced tumor stage. J Clin Endocrinol Metab. 2008;93:809-14
17. Jin J, Machekano R, McHenry CR. The utility of preoperative serum thyroid-stimulating hormone level for predicting malignant nodular thyroid disease. Am J Surg. 2010;199:294-7 discussion 8
18. Schroeder PR, Haugen BR, Pacini F, Reiners C, Schlumberger M, Sherman SI. et al. A comparison of short-term changes in health-related quality of life in thyroid carcinoma patients undergoing diagnostic evaluation with recombinant human thyrotropin compared with thyroid hormone withdrawal. J Clin Endocrinol Metab. 2006;91:878-84
19. Dow KH, Ferrell BR, Anello C. Quality-of-life changes in patients with thyroid cancer after withdrawal of thyroid hormone therapy. Thyroid. 1997;7:613-9
20. Luster M, Felbinger R, Dietlein M, Reiners C. Thyroid hormone withdrawal in patients with differentiated thyroid carcinoma: a one hundred thirty-patient pilot survey on consequences of hypothyroidism and a pharmacoeconomic comparison to recombinant thyrotropin administration. Thyroid. 2005;15:1147-55
21. Kim KW, Park YJ, Kim EH, Park SY, Park DJ, Ahn SH. et al. Elevated risk of papillary thyroid cancer in Korean patients with Hashimoto's thyroiditis. Head Neck. 2011;33:691-5
22. Haymart MR, Glinberg SL, Liu J, Sippel RS, Jaume JC, Chen H. Higher serum TSH in thyroid cancer patients occurs independent of age and correlates with extrathyroidal extension. Clin Endocrinol (Oxf). 2009;71:434-9
23. Gao L, Ma B, Zhou L, Wang Y, Yang S, Qu N. et al. The impact of presence of Hashimoto's thyroiditis on diagnostic accuracy of ultrasound-guided fine-needle aspiration biopsy in subcentimeter thyroid nodules: A retrospective study from FUSCC. Cancer Med. 2017;6:1014-22
24. Barrett T, Wilhite SE, Ledoux P, Evangelista C, Kim IF, Tomashevsky M. et al. NCBI GEO: archive for functional genomics data sets-update. Nucleic Acids Res. 2013;41:D991-5
25. Chen Z, McGee M, Liu Q, Scheuermann RH. A distribution free summarization method for Affymetrix GeneChip arrays. Bioinformatics. 2007;23:321-7
26. Ashburner M, Ball CA, Blake JA, Botstein D, Butler H, Cherry JM. et al. Gene ontology: tool for the unification of biology. The Gene Ontology Consortium. Nat Genet. 2000;25:25-9
27. Kanehisa M, Goto S. KEGG: kyoto encyclopedia of genes and genomes. Nucleic Acids Res. 2000;28:27-30
28. Huang da W, Sherman BT, Lempicki RA. Systematic and integrative analysis of large gene lists using DAVID bioinformatics resources. Nat Protoc. 2009;4:44-57
29. Jassal B, Matthews L, Viteri G, Gong C, Lorente P, Fabregat A. et al. The reactome pathway knowledgebase. Nucleic Acids Res. 2020;48:D498-D503
30. Carbon S, Ireland A, Mungall CJ, Shu S, Marshall B, Lewis S. et al. AmiGO: online access to ontology and annotation data. Bioinformatics. 2009;25:288-9
31. Reimand J, Isserlin R, Voisin V, Kucera M, Tannus-Lopes C, Rostamianfar A. et al. Pathway enrichment analysis and visualization of omics data using g:Profiler, GSEA, Cytoscape and EnrichmentMap. Nat Protoc. 2019;14:482-517
32. Davis AP, Grondin CJ, Johnson RJ, Sciaky D, King BL, McMorran R. et al. The Comparative Toxicogenomics Database: update 2017. Nucleic Acids Res. 2017;45:D972-D8
33. Mehta AM, Jordanova ES, Kenter GG, Ferrone S, Fleuren GJ. Association of antigen processing machinery and HLA class I defects with clinicopathological outcome in cervical carcinoma. Cancer Immunol Immunother. 2008;57:197-206
34. Christopher MJ, Petti AA, Rettig MP, Miller CA, Chendamarai E, Duncavage EJ. et al. Immune Escape of Relapsed AML Cells after Allogeneic Transplantation. N Engl J Med. 2018;379:2330-41
35. Concha-Benavente F, Srivastava R, Ferrone S, Ferris RL. Immunological and clinical significance of HLA class I antigen processing machinery component defects in malignant cells. Oral Oncol. 2016;58:52-8
36. Chang CC, Ferrone S. NK cell activating ligands on human malignant cells: molecular and functional defects and potential clinical relevance. Semin Cancer Biol. 2006;16:383-92
37. Wells SA Jr, Santoro M. Update: the status of clinical trials with kinase inhibitors in thyroid cancer. J Clin Endocrinol Metab. 2014;99:1543-55
38. Mahajan K, Mahajan NP. ACK1 tyrosine kinase: targeted inhibition to block cancer cell proliferation. Cancer Lett. 2013;338:185-92
39. Ferrari SM, La Motta C, Sartini S, Baldini E, Materazzi G, Politti U. et al. Pyrazolopyrimidine Derivatives as Antineoplastic Agents: with a Special Focus on Thyroid Cancer. Mini Rev Med Chem. 2016;16:86-93
40. Hynes RO. Integrins: bidirectional, allosteric signaling machines. Cell. 2002;110:673-87
41. Carlos TM, Harlan JM. Leukocyte-endothelial adhesion molecules. Blood. 1994;84:2068-101
42. Eun YG, Kim SK, Chung JH, Kwon KH. Association study of integrins beta 1 and beta 2 gene polymorphism and papillary thyroid cancer. Am J Surg. 2013;205:631-5
43. Baker HM, Baker EN. A structural perspective on lactoferrin function. Biochem Cell Biol. 2012;90:320-8
44. Dong H, Yang Y, Gao C, Sun H, Wang H, Hong C. et al. Lactoferrin-containing immunocomplex mediates antitumor effects by resetting tumor-associated macrophages to M1 phenotype. J Immunother Cancer. 2020 8
45. Afeltra A, Paggi A, De Rosa FG, Manfredini P, Addessi MA, Amoroso A. Antineutrophil cytoplasmic antibodies in autoimmune thyroid disorders. Endocr Res. 1998;24:185-94
46. Chen J, Cao H, Lian M, Fang J. Five genes influenced by obesity may contribute to the development of thyroid cancer through the regulation of insulin levels. PeerJ. 2020;8:e9302
47. Takemura S, Braun A, Crowson C, Kurtin PJ, Cofield RH, O'Fallon WM. et al. Lymphoid neogenesis in rheumatoid synovitis. J Immunol. 2001;167:1072-80
48. Cupedo T, Jansen W, Kraal G, Mebius RE. Induction of secondary and tertiary lymphoid structures in the skin. Immunity. 2004;21:655-67
49. Sancho M, Vieira JM, Casalou C, Mesquita M, Pereira T, Cavaco BM. et al. Expression and function of the chemokine receptor CCR7 in thyroid carcinomas. J Endocrinol. 2006;191:229-38
50. Smallridge RC, Chindris AM, Asmann YW, Casler JD, Serie DJ, Reddi HV. et al. RNA sequencing identifies multiple fusion transcripts, differentially expressed genes, and reduced expression of immune function genes in BRAF (V600E) mutant vs BRAF wild-type papillary thyroid carcinoma. J Clin Endocrinol Metab. 2014;99:E338-47
Author contact
![]() Corresponding authors: Yifan Zhang, E-mail: zyf11300com.cn; Qinyu Li, E-mail: drlqylqycom.
Corresponding authors: Yifan Zhang, E-mail: zyf11300com.cn; Qinyu Li, E-mail: drlqylqycom.