Impact Factor ISSN: 1449-1907
- Issue 9; 2026
- Issue 8; 2026
- Issue 7; 2026
- Issue 6; 2026
- Issue 5; 2026
- Volume 23; 2026
- Past Issues
- Editorial Board
- Cover Images
- Index & Coverage
- Cover Suggestion
- Special Issues
Introduction
Methods
Results
Discussion
Abbreviations
Supplementary Material
Acknowledgements
References

 Global reach, higher impact
Int J Med Sci 2021; 18(13):3026-3038. doi:10.7150/ijms.60261 This issue Cite
Research Paper
The underlying molecular mechanism and drugs for treatment in adrenal cortical carcinoma
Chengquan Ma, Jian Xiong, Hao Su, Hongjun Li ![]()
Department of Urology, Peking Union Medical College Hospital, Peking Union Medical College, Chinese Academy of Medical Sciences, Beijing, China.
Received 2021-3-12; Accepted 2021-5-24; Published 2021-6-16
Abstract

Purpose: The study aimed to predict and explore the possible clinical value and mechanism of genetic markers in adrenal cortical carcinoma using a bioinformatics analysis method.
Methods: The RNA-seqs and miRNAs data were downloaded from TCGA database to identify the differentially expressed genes and differentially expressed miRNAs. The hub-genes were screened by building protein-protein interaction sub-networks with 12 topological analysis methods. We conducted the receiver operating characteristic curve to elevate the diagnostic value of hub-genes in distinguishing the death and alive groups. The survival analysis of hub-genes and key miRNAs were conducted using Kaplan-Meier curves. Furthermore, most significant small molecules were identified as therapeutic candidates for adrenal cortical carcinoma by the CMap analysis.
Results: Compared to survival group, we found 475 up-regulated genes and 354 genes and the key pathways leading to the death of different ACC individual patients. Then we used 12 topological analysis methods to found the most possible 22 hub-genes. Among these hub-genes, nine hub-genes (C3, CXCL5, CX3CR1, GRM8, HCAR2, HTR1B, SUCNR1, PTGER3 and SSTR1) could be used to distinguish the death and survival groups for patients. We also revealed that mRNA expressions of 12 genes (C3, CXCL8, CX3CR1, GNAT3, GNGT1, GRM8, HCAR2, HTR1B, HTR1D, PTGER3, SSTR1 and SUCNR1) and four key miRNAs (hsa-mir-330, hsa-mir-489, hsa-mir-508 and hsa-mir-513b) were related to survival. Three most small molecules were identified (H-9, AZ-628 and phensuximide) as potential therapeutic drugs for adrenal cortical carcinoma.
Conclusion: The hub-genes expression was significant useful in adrenal cortical carcinoma, provide new diagnostic, prognosis and therapeutic approaches for adrenal cortical carcinoma. Furthermore, we also explore the possible miRNAs involved in regulation of hub-genes.
Keywords: adrenal cortical carcinoma, biomarkers, prognosis, treatment
Introduction
Adrenal cortical carcinoma (ACC) is a rare malignant tumor that evolves from the adrenal cortex, with an incidence worldwide of 0.7-2.0 cases/million/year [1]. Despite a lot of clinical study, the prognosis is still very poor, with a 5-year survival rate of < 40% [2, 3]. Prognostic factors are not known: there are at least 4 clinicopathological factors: ENSAT stage, resection (R0 vs R1/R2) status, Ki67 proliferation index, hormone hypersecretion [4]. However, due to the small number of ACC cases available for study, the clinicopathological characteristics and prognostic factors of ACC are not very clear yet. Correspondingly, it is true that the only chance of cure is surgery and there is no effective treatment method for most patients to prolong survival [4]. Therefore, it is necessary to look for the occurrence and development mechanism of ACC and therapeutic targets are particularly important.
Compared with other tumors, ACC is highly malignant and is characterized by a high mortality rate within 1-3 years of diagnosis. Around 30-40% of ACC have clear evidence of metastasis in clinical presentation, and the available systematic treatments rarely yield a complete remission [5, 6]. Previous studies have focused on the studies of comparing normal and tumor, and related results suggest that its occurrence and development may be related to the overexpression of IGF-2, TP53 gene mutation and abnormal activation of the Wnt/13-catenin signaling pathway, but it is not related to the lethal aspects of this disease. ACC-specific literature is plenty of demonstrations that the above cited genetic alterations portend a poorer survival. Furthermore, more recent comprehensive genomic analyses of ACC [7-11] have gained significant improvements in our knowledge of this disease. In particular, the ACC-TCGA sub-project which represents the base of the present works [12]. 3 patterns of gene regulation systems are described in cancer (copy number changes, differential microRNA expression and gene CpG methylation status) and we know that methylation has a role in ACC based on the findings of the above research. However, the specific lethal molecular mechanism of this disease is not clear though previous study also conducted many explorations in RNA expression and microRNA expression [13-15]. Therefore, we downloaded RNA-seqs and miRNAs data from TCGA database using a bioinformatics analysis method to explore the possible clinical value and mechanism of genetic markers for ACC: a). identify the differentially expressed genes (DEGs) and differentially expressed miRNAs; b). building protein-protein interaction (PPI) sub-networks; c). conducted the receiver operating characteristic (ROC) curve to elevate the diagnostic value of hub-genes in distinguishing the death and alive groups; d). conducted survival analysis of hub-genes and key miRNAs; e). identified small molecules were as therapeutic candidates for ACC by the CMap analysis.
Methods
Data resources and sample grouping
Series matrix files associations with ACC were downloaded from TCGA. The normalized gene expression data format was FPKM. A total of 78 adults (>18 years) ACC were included in our study, which is divided into 51 alive samples and 27 dead samples according the results of follow up.
Screening for DEGs and different miRNA
The matrix data of mRNA were performed log2 conversion and normalization using limma package of R/ Bioconductor software. The limma package was also utilized to screen and identify the DEGs between dead samples and alive samples. Adjust P values <0.01 and |log2FC| >2 were considered the statistical significance of differential expression. The matrix data of miRNA conducted method to reveal the different miRNAs between dead samples and alive sample, with adjust P value <0.05 and |log2FC| >1 was considered the statistical significance of differential miRNAs. The heat map and volcano map were also plotted for samples and identified DEGs / differential miRNAs with pheatmap package in R software.
GO and KEGG enriched pathway analysis
To explore the underlying pathways and biological processes, we conducted GO and KEGG pathway analyses based on all differentially expressed mRNAs using the Database for Annotation Visualization and Integrated Discovery (DAVID version 6.8; https://david.ncifcrf.gov/).
Establishment of PPI network and identification of hub-genes
A PPI network was established by the STRING (v11.0; https://string-db.org/) [16] and visualized by the Cytoscape 3.6.1. The hub-genes were screened by building PPI sub-networks with 12 topological analysis methods. Then we selected the top 15 genes for every topological analysis methods into the Venn plot method. The “Molecular Complex Detection” (MCODE), a clustering algorithm identifying locally densely connected regions in a large PPI network based on a node-weighting arithmetic, was employed to recognize highly interacted hub-genes clustering.
Prognostic association between OS and the expression of hub-genes
We conducted the receiver operating characteristic (ROC) curve to elevate the diagnostic value of hub-genes in distinguishing the death and survival groups.
Survival analysis of hub-gene
The Gene Expression Profiling Interactive Analysis (GEPIA) database was utilized to assess the impact of hub-genes on the patients' prognosis including overall survival (OS) and disease-free survival (DFS).
Target mRNA prediction miRNA
We used the ENCORI database to predict the possible miRNAs that may regulate the hub-genes. Then choose the result of possible miRNAs was consistent with the differential miRNAs previously detected in the TCGA database. Finally, the most potentially miRNAs participate in the regulation of mRNAs were defined by the correlation analysis between them.
Identification of small molecules
The CMap database (http://www.broadinstitute.org/cmap/) was used to explore potential small molecule drugs for use in patients based on the genes signature of ACC. The overlapping differently expressed genes based on top 5 modules were classified into up-regulated and down-regulated groups. The negative connectivity score (closer to -90) demonstrate greater similarity between the genes.
Survival analysis of miRNA
The UALCAN (http://ualcan.path.uab.edu/analysis.html) database [17] was utilized to assess the impact of key miRNAs that regulates the hub-genes on the patients' prognosis.
Results
Patient characteristics
The study included 51 alive samples and 27 dead samples at a mean age of 45.96±15.21 years and 49.30±15.89 years, respectively (p=0.367). There is no difference between the two groups of gender (p=0.851), lymph node (p=0.69) and metastasis (p=0.09). It is significant difference between the two groups on stage (p=0.033).The ratio of patients with T3/T4 stage was more than T1/T2 stage in dead group (Table 1).
Characteristics of the patients.
| Parameter | Alive (51) | Dead (27) | P |
|---|---|---|---|
| Age (years) | 45.96±15.21 | 49.30±15.89 | 0.367 |
| Gender | 0.851(χ2=0.035) | ||
| Female | 31 | 17 | |
| Male | 20 | 10 | |
| Stage | 0.033(χ2=8.745) | ||
| T1 | 7(13.7%) | 2(7.4%) | |
| T2 | 32(62.8%) | 10(37.1%) | |
| T3 | 5(9.8%) | 4(14.8%) | |
| T4 | 7(13.7%) | 11(40.7%) | |
| Lymph node | 0.69(χ2=8.745) | ||
| N0 | 44(86.3%) | 25(92.6%) | |
| N1 | 7(13.7%) | 2(7.4%) | |
| Metastasis | 0.09(χ2=2.875) | ||
| M0 | 44(86.3%) | 19(70.4%) | |
| M1 | 7(13.7%) | 8(29.6%) |
Identification of DEGs
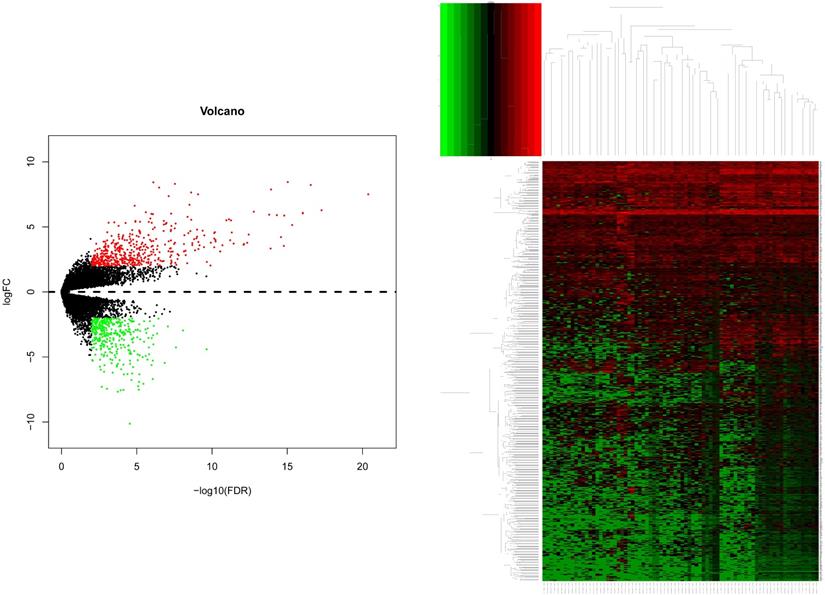
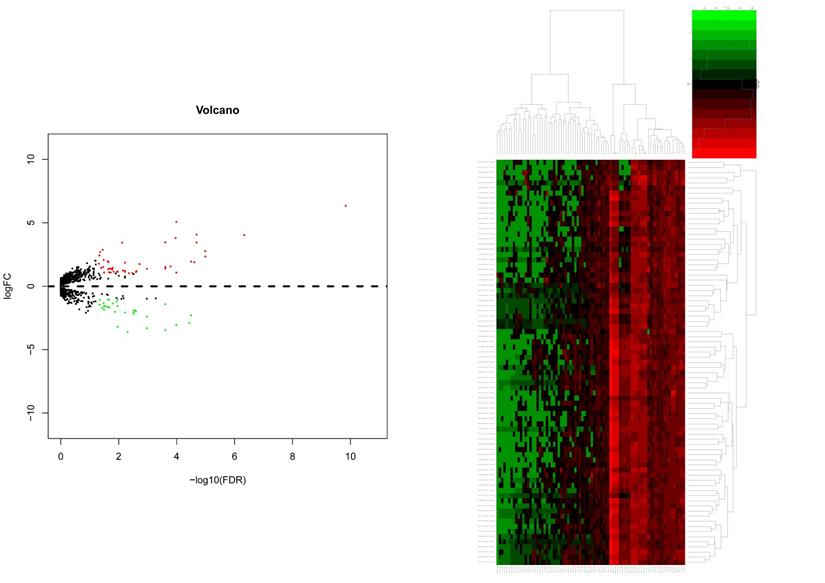
After gene differential expression analysis of microarray data, 475 genes were up-regulated and 354 genes were down-regulated in dead group compared to alive group. The volcano plot and heatmap of the distribution of DEGs is shown in Figure 1.
The volcano plot and heatmap of the distribution of DEGs. Comparison of gene expression profiles with dead samples and alive samples. Adjust P values <0.01 and |log2FC| >2 were considered the statistical significance of differential expression. 475 genes were up-regulated and 354 genes were down-regulated in dead group compared to alive group.
Functional and pathway enrichment analyses
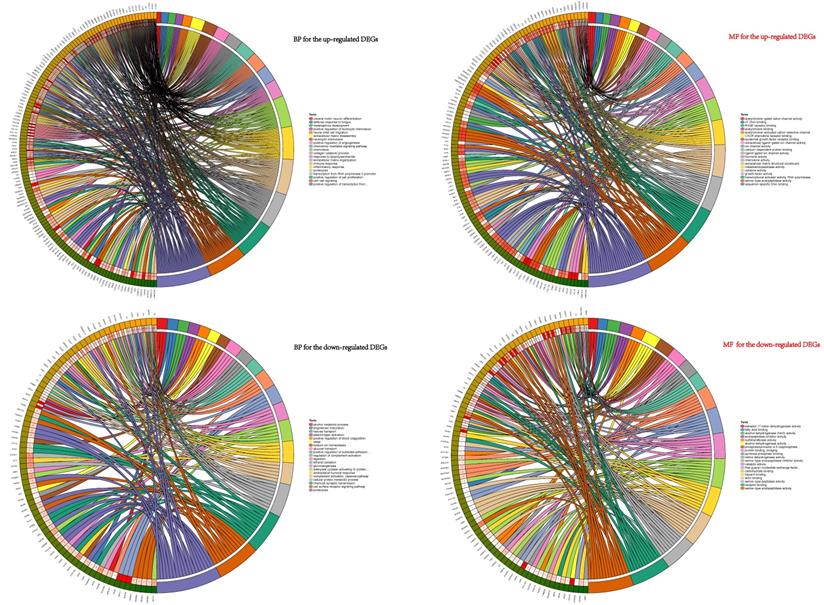
To explore the potential biological functions of the DEGs, GO terms (including BP and MF analyses) and KEGG pathway analysis were performed. GO pathways for BP showed that the up-regulated DEGs were mainly enriched in progress including cell-cell signaling, collagen catabolic process, chemokine-mediated signaling pathway, positive regulation of cell proliferation, inflammatory response, neutrophil chemotaxis, chemotaxis and immune response et al. (Figure 2). The GO analysis results revealed that these down-regulated genes participated in vital biological processes including ethanol oxidation, cellular protein metabolic process, antibacterial humoral response, hexose transport, adenylate cyclase-activating G-protein coupled receptor signaling pathway, alcohol metabolic process, proteolysis, gluconeogenesis, cell surface receptor signaling pathway, and chemical synaptic transmission plasminogen activation et al. (Figure 2). Functional analyses of MF for the up-regulated and down-regulated DEGs were also conducted (Figure 2).
BP and MF analyses of the DEGs. BP showed that the up-regulated DEGs were mainly enriched in progress: cell-cell signaling, collagen catabolic process, chemokine-mediated signaling pathway, positive regulation of cell proliferation, inflammatory response and neutrophil chemotaxis et.al. These down-regulated genes participated in vital biological processes: ethanol oxidation, cellular protein metabolic process, antibacterial humoral response, hexose transport, adenylate cyclase-activating G-protein coupled receptor signaling pathway, alcohol metabolic process, proteolysis, gluconeogenesis, cell surface receptor signaling pathway, and chemical synaptic transmission plasminogen activation et.al. MF for the up-regulated and down-regulated DEGs were also conducted shown in right half of figure 2.
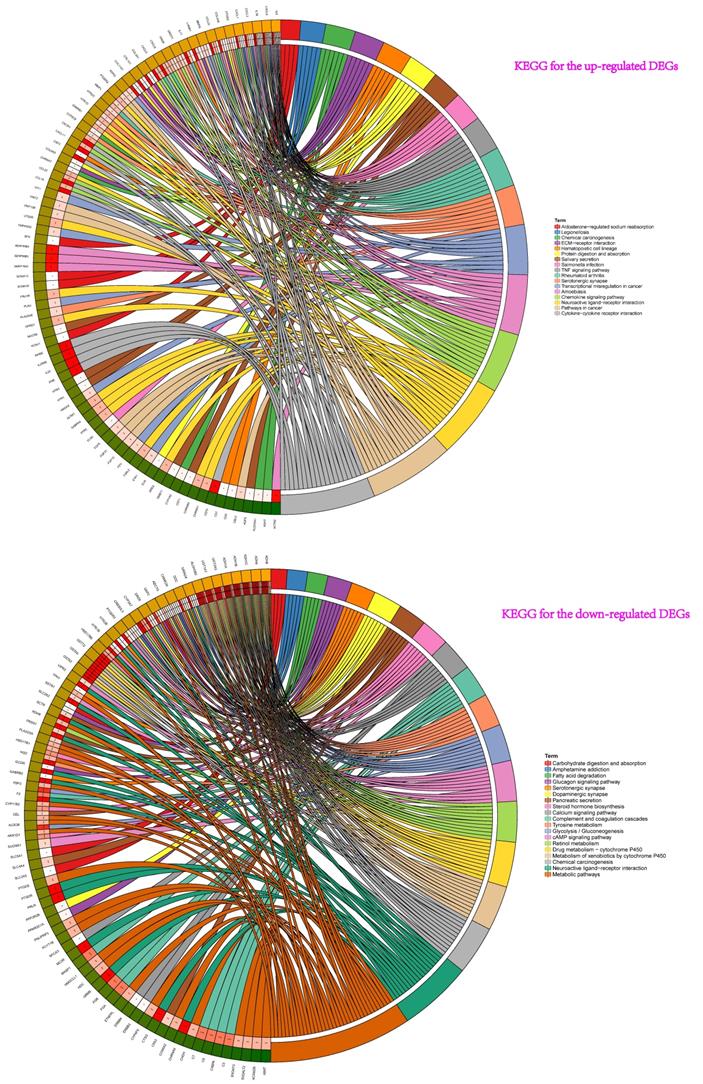
Then, the results of KEGG pathway analysis showed that these up-regulated genes participated in cytokine-cytokine receptor interaction, amoebiasis, chemokine signaling pathway, neuroactive ligand-receptor interaction, rheumatoid arthritis, pathways in cancer, transcriptional misregulation in cancer, serotonergic synapse, TNF signaling pathway, chemical carcinogenesis et al. (Figure 3). For the down-regulated genes, pathway analysis were mainly enriched in chemical carcinogenesis, drug metabolism-cytochrome P450, metabolism of xenobiotics by cytochrome P450, retinol metabolism, tyrosine metabolism, neuroactive ligand-receptor interaction, and glycolysis / gluconeogenesis et al. (Figure 3).
KEGG pathway analyses showed that these up-regulated genes participated in pathway: cytokine-cytokine receptor interaction, amoebiasis, chemokine signaling pathway, neuroactive ligand-receptor interaction, rheumatoid arthritis, pathways in cancer, transcriptional misregulation in cancer, serotonergic synapse, TNF signaling pathway, chemical carcinogenesis et al. For the down-regulated genes of pathway analysis: chemical carcinogenesis, drug metabolism-cytochrome P450, metabolism of xenobiotics by cytochrome P450, retinol metabolism, tyrosine metabolism and neuroactive ligand-receptor interaction et al.
Integration of the PPI network, module analysis and Potential compounds for treatment
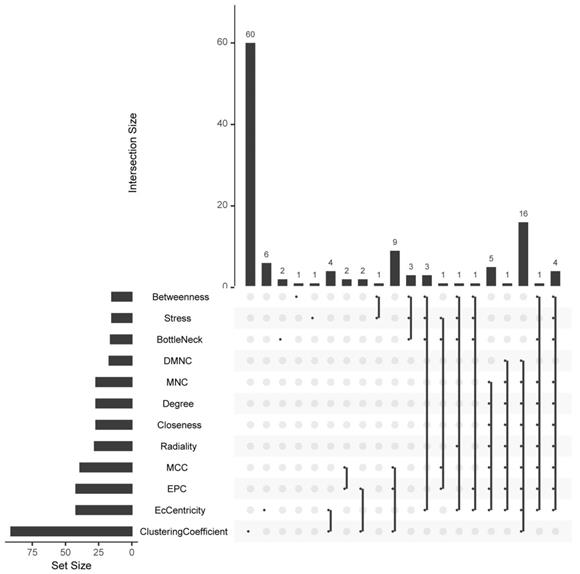
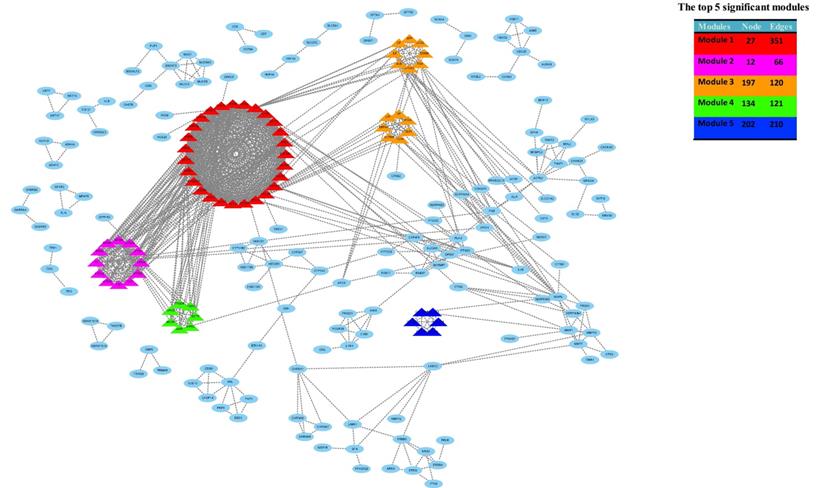
Based on all DEGs, we used the STRING online database to construct PPI networks. The hub-genes were screened by building PPI sub-networks with 12 topological analysis methods. Then we choose the top 15 gene for every topological analysis methods into the Venn plot method, found that 22 hub-genes (C3, CXCL1, CXCL3, CXCL5, CXCL6, CXCL8, CXCL11, CXCR1, CX3CR1, DRD2, FPR2, GNGT1, GNAT3, GRM8, HCAR2, HTR1B, HTR1D, OPRD1, PPY, PTGER3, SSTR1 and SUCNR1) were list in the top, as shown in Figure 4a.
The hub-genes were screened by 12 topological analysis methods. Then choose the top 15 gene for every topological analysis methods into the Venn plot method, found that 22 hub-genes (C3, CXCL1, CXCL3, CXCL5, CXCL6, CXCL8, CXCL11, CXCR1, CX3CR1, DRD2, FPR2, GNGT1, GNAT3, GRM8, HCAR2, HTR1B, HTR1D, OPRD1, PPY, PTGER3, SSTR1 and SUCNR1) were list in the top.
Then, the top five modules (MCODE score > 2) in PPI networks of DEGs were chosen, as shown in Figure 4b. And there are 67 genes in the top five modules including 36 up-regulated and 31 down-regulated genes (supplementary file 1).
The top five modules (MCODE score > 2) in PPI networks of DEGs were chosen, as shown in Figure 4b. And there are 67 genes in the top five modules including 36 up-regulated and 31 down-regulated genes.
To screen out candidate small molecule drugs, CMap database was utilized to analyze consistent differently expressed probesets based on 36 up-regulated and 31 down-regulated genes from the top five modules. CMap predicted the three most significant small molecules (H-9, AZ-628 and phensuximide) as potential therapeutic drugs for ACC. H-9 was the most promising small molecule to reverse the ACC gene expression (Table 2).
The top three compounds identified as treatment options for ACC by CMap analysis.
| Rank | Score | ID | Name | Description |
|---|---|---|---|---|
| 1 | -96.3 | BRD-K70577657 | H-9 | PKA inhibitor |
| 2 | -95.1 | BRD-K05804044 | AZ-628 | RAF inhibitor |
| 3 | -90.94 | BRD-A18043272 | phensuximide | Succinimide antiepileptic |
ACC = adrenocortical carcinoma; CMap=connectivity map.
Diagnostic value of hub-genes
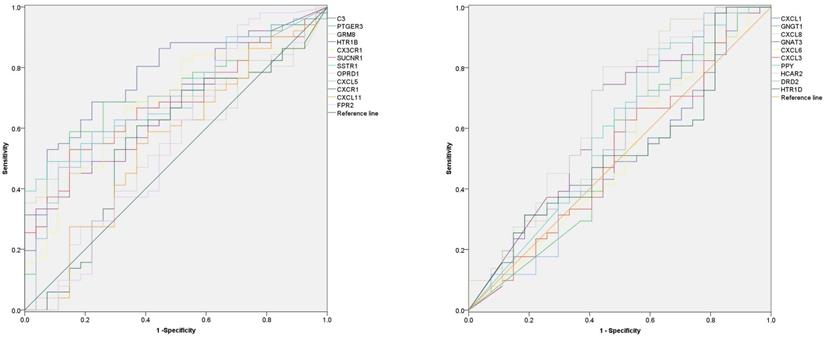
In order to explore the diagnostic value of 22 hub-genes in distinguishing the death and survival groups, the ROC curve found that nine hub-genes (C3, CXCL5, CX3CR1, GRM8, HCAR2, HTR1B, SUCNR1, PTGER3 and SSTR1) could be used to distinguish the death and survival groups for ACC patients (Figure 5 and Table 3).
Receiver Operating Characteristics of the 22 hub-genes.
| Genes | AUC | Down(95%CI) | Up(95%CI) | P |
|---|---|---|---|---|
| C3 | .772 | .667 | .877 | <0.001 |
| PTGER3 | .715 | .600 | .830 | .002 |
| GRM8 | .672 | .555 | .788 | .013 |
| HTR1B | .674 | .553 | .794 | .012 |
| CX3CR1 | .679 | .557 | .801 | .010 |
| SUCNR1 | .679 | .562 | .797 | .009 |
| SSTR1 | .712 | .600 | .824 | .002 |
| OPRD1 | .520 | .385 | .655 | .773 |
| CXCL5 | .688 | .567 | .809 | .007 |
| CXCR1 | .562 | .423 | .701 | .369 |
| CXCL11 | .551 | .412 | .690 | .459 |
| FPR2 | .558 | .411 | .706 | .401 |
| CXCL1 | .510 | .374 | .645 | .887 |
| GNGT1 | .526 | .382 | .669 | .709 |
| CXCL8 | .605 | .465 | .745 | .129 |
| GNAT3 | .629 | .492 | .765 | .063 |
| CXCL6 | .511 | .372 | .651 | .871 |
| CXCL3 | .516 | .375 | .656 | .821 |
| PPY | .590 | .449 | .731 | .195 |
| HCAR2 | .649 | .512 | .786 | .031 |
| DRD2 | .547 | .403 | .691 | .498 |
| HTR1D | .516 | .379 | .652 | .821 |
CI, confidence interval; AUC, area under the curve.
The diagnostic value of 22 hub-genes in distinguishing the death and survival groups, the ROC curve found that nine hub-genes (C3, CXCL5, CX3CR1, GRM8, HCAR2, HTR1B, SUCNR1, PTGER3 and SSTR1) could be used to distinguish the death and survival groups (the p-value for each gene in Table 3).
Prognostic significance of hub-genes
As for 22 hub-genes, the prognostic value of them was analyzed by Kaplan-Meier plotter (supplementary file 2). It showed that low mRNA expression of C3 was related with a worse OS, as well as CX3CR1, GRM8, HTR1B, PTGER3, SUCNR1 and SSTR1. Otherwise, high mRNA expressions of four genes (CXCL8, GNAT3, GNGT1 and HCAR2) were related to a worse OS.
As for DFS, low mRNA expressions of three genes (C3, CX3CR1 and SSTR1) were related with worse DFS and high mRNA expressions of four genes (CXCL8, GNGT1, HCAR2 and HTR1D) were related to worse DFS.
Differential miRNAs expression levels
For miRNAs expression levels, the study included 51 alive samples and 28 dead samples (supplementary file 3). After miRNAs differential expression analysis of microarray data, 47 genes were up-regulated and 33 genes were down-regulated in dead group compared to alive group. The volcano plot and heatmap of the distribution of differentially miRNAs is shown in Figure 6.
The volcano plot and heatmap of the distribution of differentially miRNAs. Adjust P value <0.05 and |log2FC| >1 was considered the statistical significance of differential miRNAs. 47 genes were up-regulated and 33 genes were down-regulated in dead group compared to alive group.
Potential miRNAs involved in regulation of hub-genes
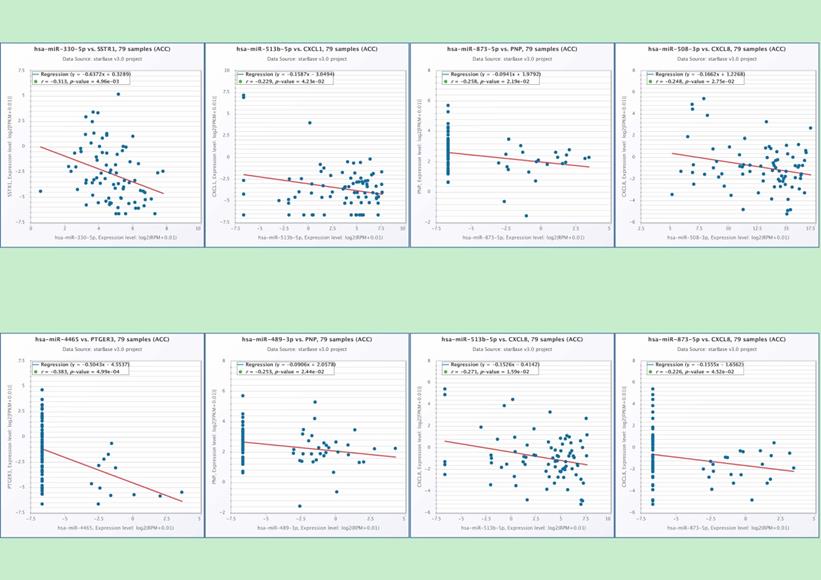
In the end, we identified six miRNAs that may be involved in regulating the hub-genes through conducting the correlation analysis of hub-genes and predicted miRNAs (Table 4). There is a potential regulatory effect between hsa-miR-330 and SSTR1, hsa-miR-513b and CXCL1, hsa-miR-4465 and PTGER3 (Figure 7). The hsa-miR-873 and hsa-miR-489 may participate in the ACC pathway by regulating PNP (Figure 7). CXCL8 may be regulated by three kinds of miRNAs, such as hsa-miR-508, hsa-miR-513b and hsa-miR-873 (Figure 7). It showed that six miRNAs (hsa-mir-330, hsa-mir-489, hsa-mir-508, hsa-mir-513b, hsa-mir-873, and hsa-mir-4465) may be the play a key role in regulating the hub-genes in the pathways.
The process of identified six miRNAs that may be involved in regulating the hub-genes (A-D).
| Hub-genes (15 up-regulate) | A: the possible miRNAs in ENCORI database (number) | B: miRNA were down-regulated in TCGA (33) | C: Take the intersection of A and B jointly owned | D: correlation analysis of hub-genes and C | |
|---|---|---|---|---|---|
| CXCL1 | 83 | hsa-mir-653 hsa-mir-1258 hsa-mir-466 hsa-mir-1247 hsa-mir-362 hsa-mir-4501 hsa-mir-489 hsa-mir-194-1 hsa-mir-605 hsa-mir-513a-2 hsa-mir-513a-1 hsa-mir-194-2 hsa-mir-873 hsa-mir-4423 hsa-mir-6842 hsa-mir-876 hsa-mir-585 | hsa-mir-99a hsa-mir-6788 hsa-mir-150 hsa-mir-514a-3 hsa-mir-514a-1 hsa-mir-514a-2 hsa-mir-125b-2 hsa-mir-510 hsa-mir-125b-1 hsa-mir-507 hsa-mir-592 hsa-mir-513b hsa-mir-6757 hsa-mir-552 hsa-mir-1287 hsa-mir-508 | hsa-mir-873 hsa-mir-489 hsa-mir-362 hsa-mir-513b hsa-mir-653 | hsa-mir-513b |
| CXCL3 | 101 | hsa-mir-873 hsa-mir-489 hsa-mir-362 hsa-mir-150 hsa-mir-653 | NO | ||
| CXCL5 | 100 | hsa-mir-876 hsa-mir-873 hsa-mir-513b | NO | ||
| CXCL6 | 77 | hsa-mir-873 hsa-mir-362 | NO | ||
| CXCL8 | 155 | hsa-mir-876 hsa-mir-873 hsa-mir-362 hsa-mir-508 hsa-mir-513b hsa-mir-653 | hsa-mir-873 hsa-mir-508 hsa-mir-513b | ||
| CXCL11 | 8 | 0 | NO | ||
| CXCR1 | 1 | hsa-mir-873 | NO | ||
| DRD2 | 0 | 0 | NO | ||
| FPR2 | 16 | hsa-mir-362 | NO | ||
| GNGT1 | 2 | 0 | NO | ||
| GNAT3 | 0 | 0 | NO | ||
| HCAR2 | 0 | 0 | NO | ||
| HTR1D | 0 | 0 | NO | ||
| OPRD1 | 0 | 0 | NO | ||
| PPY | 119 | hsa-mir-873 hsa-mir-489 | hsa-mir-873 hsa-mir-489 | ||
| Hub-genes (7 down-regulate) | A: the possible miRNAs in ENCORI database (number) | B: miRNA were down-regulated in TCGA (47) | C: Take the intersection of A and B jointly owned | D: correlation analysis of hub-genes and C | |
| C3 | 22 | hsa-mir-31 hsa-mir-135b hsa-mir-190b hsa-mir-582 hsa-mir-4465 hsa-mir-372 hsa-mir-214 hsa-mir-223 hsa-mir-130b hsa-mir-548az hsa-mir-7114 hsa-mir-4668 hsa-mir-301b hsa-mir-141 hsa-mir-6720 hsa-mir-3170 hsa-mir-215 hsa-mir-887 hsa-mir-330 hsa-mir-301a hsa-mir-18a hsa-mir-1245a hsa-mir-146b hsa-mir-199b | hsa-mir-222 hsa-mir-205 hsa-mir-4746 hsa-mir-221 hsa-mir-3917 hsa-mir-6783 hsa-mir-6772 hsa-mir-4515 hsa-mir-199a-1 hsa-mir-199a-2 hsa-mir-92b hsa-mir-3662 hsa-mir-675 hsa-mir-937 hsa-mir-499a hsa-mir-1226 hsa-mir-124-2 hsa-mir-7106 hsa-mir-549a hsa-mir-3622a hsa-mir-1269b hsa-mir-371a hsa-mir-124-1 | 0 | NO |
| CX3CR1 | 0 | 0 | NO | ||
| GRM8 | 4 | 0 | NO | ||
| HTR1B | 0 | 0 | NO | ||
| PTGER3 | 132 | hsa-mir-371a hsa-mir-214 hsa-mir-675 hsa-mir-4465 hsa-mir-372 hsa-mir-499a hsa-mir-199b | hsa-mir-4465 | ||
| SUCNR1 | 0 | 0 | NO | ||
| SSTR1 | 118 | hsa-mir-371a hsa-mir-330 hsa-mir-146b hsa-mir-582 hsa-mir-214 hsa-mir-499a | hsa-mir-330 | ||
The correlation analysis of hub-genes and predicted miRNAs. There is a clear correlation between hsa-miR-330 and SSTR1 (p=0.005), hsa-miR-513b and CXCL1 (p=0.004), hsa-miR-4465 and PTGER3 (p<0.001), hsa-miR-873 (p=0.02) and PNP, hsa-miR-489 (p=0.02) and PNP, hsa-miR-508 and CXCL8 (p=0.028), hsa-miR-513b and CXCL8 (p=0.016), hsa-miR-873 and CXCL8 (p=0.045).
Prognostic significance of six key miRNAs
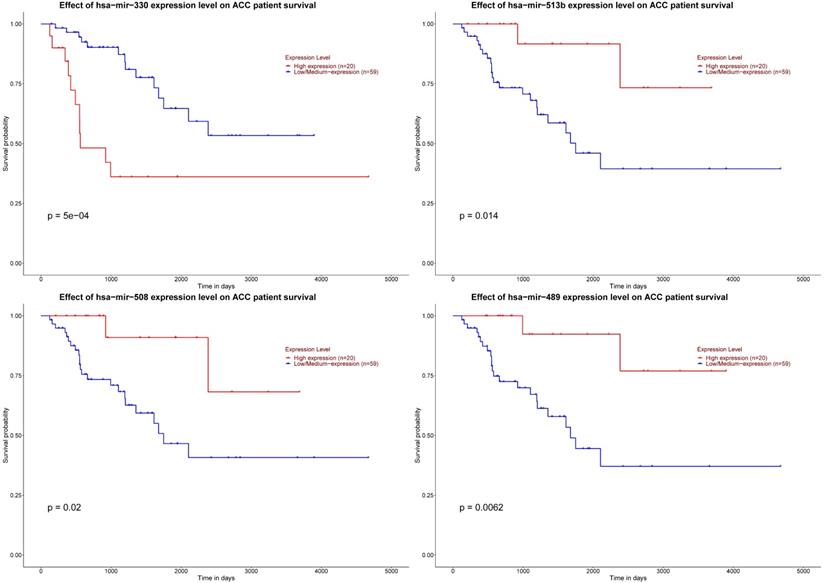
As for six key miRNAs, the prognostic value of these miRNAs was analyzed by Kaplan-Meier plotter. It could be known that low level of hsa-mir-330 was related with worse DFS. Otherwise, elevated levels of three miRNAs (hsa-mir-508, hsa-mir-513b and hsa-mir-489) were related to worse DFS (Figure 8).
Significant prognosis of four key miRNAs. The P value of four miRNAs is as shown in the figure above, all are < 0.05.
Discussion
The prognosis of ACC is generally very poor, but there are significant individual differences in the progress, recurrence and survival of ACC. Some patients with advanced stages can still achieve longer survival. Advances in genetic analysis technology in the form of next-generation sequencing and the development of bioinformatics tools have helped to study the molecular characterization of these tumors and opened up new research avenues to improve the understanding of patients with this disease, which also could be used to discover different diagnoses and prognosis and therapeutic targets. Compared to alive group, we found the potential biological functions and enrichment pathways in dead group based on 475 up-regulated genes and 354 down-regulated genes. These may be the key pathways leading to the death of different ACC individual patients. Then we used 12 topological analysis methods to choose the most possible 22 hub-gene (C3,CXCL1, CXCL3, CXCL5, CXCL6, CXCL8, CXCL11, CXCR1, CX3CR1,DRD2, FPR2, GNGT1, GNAT3, GRM8, HCAR2, HTR1B, HTR1D, PPY, PTGER3, OPRD1, SSTR1 and SUCNR1) in the role of regulation pathways.
For diagnostic and prognosis significance, it is important for clinical management of ACC patients. The development of genomics methods during the last decade has allowed studying gene expression, genetic and epigenetic alterations at the pan-genomic level in numerous cancer types. Such research results can also be applied to identify tumor subgroups with different biological characteristics and different results in ACC. Based on these as a diagnostic or prognostic molecular marker. For diagnostic value, nine hub-genes (C3, CXCL5, CX3CR1, GRM8, HCAR2, HTR1B, SUCNR1, PTGER3 and SSTR1) could be used to distinguish the death and survival groups for ACC patients. Limited prognostic markers were proposed based on transcriptome studies including SF-1 [18], PTTG1 [19], EZH2 [20] and VAV2 [21] et al. We also revealed that mRNA expressions of eleven genes (C3, CXCL8, CX3CR1, GNAT3, GNGT1, GRM8, HCAR2, HTR1B, PTGER3, SSTR1 and SUCNR1) were related to overall survival and expressions of seven genes (C3, CXCL8, CX3CR1, GNGT1, HCAR2, HTR1D and SSTR1) were related to DFS.
Yuan et al. study found that high complement C3 (C3) deposition activates JAK2/STAT3 pathway correlates with in gastric cancer progression and was identified as an independent prognostic factor of poor overall survival [22]. C3 plays a role of diagnostic signature including achieved a predictive error of 12.8% and a Generalized Brier Score of 0.108 lung adenocarcinoma and squamous cell carcinoma [23]. In addition to the C3, for these genes (CXCL8, CX3CR1, GRM8, HTR1B, HTR1D, PTGER3, SSTR1 and SUCNR1) were related to survival in the ACC and it was also could be useful in other cancers [24-31]. GNGT1 and HCAR2 take the lead in be found to have prognostic effects in tumors.
For the treatment of ACC, surgery resection is the only recommended curative methods and complete resection of the primary tumor is predictably associated with a better prognosis and patients in whom there is microscopic or macroscopic involvement of the tumor margins, 5 years survival is as low as 20 and 10%, respectively [32]. However, even in patients with complete resection, recurrence and disease progression is still commonly seen, so that adjuvant therapy is frequently recommended. Medical treatment is recommended in patients with stage iii/iv. The mitotane is a compound which combines antitumor and antisecretory effects in order to reduce steroid production by tumor cells. Partial responses were reported in 13% to 33% of cases with response duration of 2 to 190 months. Experience over the years has shown that mitotane does not significantly affect OS, but it can improve DFS [33]. Thus, more effective drug development is of particular important. We provide 3 most small molecules (H-9, AZ-628 and phensuximide) as potential therapeutic drugs for ACC. The top compound H-9 is referred to as a potential therapeutic target because it is a PKA inhibitor. However PKA activity has been found to inhibit WNT/beta-catenin-dependent tumorigensis in ACC [34]. This is would be an opposite effect, and a possible explanation is that it should be regarded that biological heterogeneity exists in ACC over time. Thus data coming from the primary tumor may not reflect the behaviour of the metastatic tumor [35] that is the most commonly observed tumor setting in the clinical routine.
In recent years, a large number of studies on miRNAs have been conducted worldwide. One miRNA may regulate hundreds of genes at the post-transcriptional level, and one gene can be targeted by multiple miRNAs, leading to the formation of an extremely complex regulatory network [36]. It is currently known that it plays an important role in the occurrence and development of a variety of tumors. The uncontrolled expression of miRNAs has been found to be related to the progression and development of various types of human cancers [37]. Most miRNAs are directly targeted acts on oncogenes or tumor suppressor genes, thereby participating in various human tumors and their malignant phenotypes. In our current research, we identified 6 miRNAs that may be involved in regulating the hub-genes and high levels of 4 miRNAs (hsa-mir-330, hsa-mir-489, hsa-mir-508 and hsa-mir-513b) were related to the DFS. Similarly, these four miRNAs have also been found to play significant roles in the prognosis, progression and regulation of other tumors [38-42].
However, there were still some shortages and limitations in this study. The samples size is too small, only including 51 alive samples and 27 dead samples with ACC and the conclusions need experimental verification to be firmed and reliable.
Abbreviations
C3: complement C3; CXCL1: C-X-C motif chemokine ligand 1; CXCL3: C-X-C motif chemokine ligand 3; CXCL5: C-X-C motif chemokine ligand 5; CXCL6: C-X-C motif chemokine ligand 6; CXCL8: C-X-C motif chemokine ligand 8; CXCL11: C-X-C motif chemokine ligand 11; CXCR1: C-X-C motif chemokine receptor 1; CX3CR1: C-X3-C motif chemokine receptor 1; DRD2: dopamine receptor D2; FPR2: formyl peptide receptor 2; GNGT1: G protein subunit gamma transducing 1; GNAT3: G protein subunit alpha transducin 3; GRM8: glutamate metabotropic receptor 8; HCAR2: hydroxycarboxylic acid receptor 2; HTR1B: 5-hydroxytryptamine receptor 1B; HTR1D: 5-hydroxytryptamine receptor 1D; OPRD1: opioid receptor delta 1; PPY: pancreatic polypeptide; PTGER3: prostaglandin E receptor 3; SSTR1: somatostatin receptor 1; SUCNR1: succinate receptor 1.
Supplementary Material
Supplementary tables.
Acknowledgements
This work is supported by a grant from National Natural Science Foundation of China (Grant No. 81671448 and No. 8187061455) and CAMS Innovation Fund for Medical Sciences (Grant No. 2018-I2M-1-004).
Data availability statement
The data were downloaded from TCGA database. If needed during the review process, we could provide datasets to the editor or editorial staff upon request.
Author Contributions
Chengquan Ma and Hongjun Li designed the study; all authors conducted the literature search and analyzed the data. Chengquan Ma wrote the paper. Hongjun Li was the corresponding author.
Competing Interests
The authors have declared that no competing interest exists.
References
1. Bourdeau I, MacKenzie-Feder J, Lacroix A. Recent advances in adrenocortical carcinoma in adults. Current opinion in endocrinology, diabetes, and obesity. 2013;20:192-7
2. Mihai R. Diagnosis, treatment and outcome of adrenocortical cancer. The British journal of surgery. 2015;102:291-306
3. Kerkhofs TM, Verhoeven RH, Bonjer HJ, van Dijkum EJ, Vriens MR, De Vries J. et al. Surgery for adrenocortical carcinoma in The Netherlands: analysis of the national cancer registry data. European journal of endocrinology / European Federation of Endocrine Societies. 2013;169:83-9
4. Fassnacht M, Dekkers OM, Else T, Baudin E, Berruti A, de Krijger R. et al. European Society of Endocrinology Clinical Practice Guidelines on the management of adrenocortical carcinoma in adults, in collaboration with the European Network for the Study of Adrenal Tumors. European journal of endocrinology / European Federation of Endocrine Societies. 2018;179:G1-G46
5. Ronchi CL, Kroiss M, Sbiera S, Deutschbein T, Fassnacht M. EJE prize 2014: current and evolving treatment options in adrenocortical carcinoma: where do we stand and where do we want to go? European journal of endocrinology / European Federation of Endocrine Societies. 2014;171:R1-R11
6. Glover AR, Ip JC, Zhao JT, Soon PS, Robinson BG, Sidhu SB. Current management options for recurrent adrenocortical carcinoma. OncoTargets and therapy. 2013;6:635-43
7. Assie G, Letouze E, Fassnacht M, Jouinot A, Luscap W, Barreau O. et al. Integrated genomic characterization of adrenocortical carcinoma. Nature genetics. 2014;46:607-12
8. Pittaway JFH, Guasti L. Pathobiology and genetics of adrenocortical carcinoma. Journal of molecular endocrinology. 2019;62:R105-R19
9. Lippert J, Appenzeller S, Liang R, Sbiera S, Kircher S, Altieri B. et al. Targeted Molecular Analysis in Adrenocortical Carcinomas: A Strategy Toward Improved Personalized Prognostication. The Journal of clinical endocrinology and metabolism. 2018;103:4511-23
10. Assie G, Jouinot A, Fassnacht M, Libe R, Garinet S, Jacob L. et al. Value of Molecular Classification for Prognostic Assessment of Adrenocortical Carcinoma. JAMA oncology. 2019
11. Jouinot A, Assie G, Libe R, Fassnacht M, Papathomas T, Barreau O. et al. DNA Methylation Is an Independent Prognostic Marker of Survival in Adrenocortical Cancer. The Journal of clinical endocrinology and metabolism. 2017;102:923-32
12. Zheng S, Cherniack AD, Dewal N, Moffitt RA, Danilova L, Murray BA. et al. Comprehensive Pan-Genomic Characterization of Adrenocortical Carcinoma. Cancer cell. 2016;30:363
13. Xie L, Wang Q, Nan F, Ge L, Dang Y, Sun X. et al. OSacc: Gene Expression-Based Survival Analysis Web Tool For Adrenocortical Carcinoma. Cancer management and research. 2019;11:9145-52
14. Xu F, Zhang P, Yuan M, Yang X, Chong T. Bioinformatic screening and identification of downregulated hub genes in adrenocortical carcinoma. Exp Ther Med. 2020;20:2730-42
15. Zou Y, Jing L. Identification of key modules and prognostic markers in adrenocortical carcinoma by weighted gene co-expression network analysis. Oncology letters. 2019;18:3673-81
16. Szklarczyk D, Morris JH, Cook H, Kuhn M, Wyder S, Simonovic M. et al. The STRING database in 2017: quality-controlled protein-protein association networks, made broadly accessible. Nucleic acids research. 2017;45:D362-D8
17. Chandrashekar DS, Bashel B, Balasubramanya SAH, Creighton CJ, Ponce-Rodriguez I, Chakravarthi B. et al. UALCAN: A Portal for Facilitating Tumor Subgroup Gene Expression and Survival Analyses. Neoplasia. 2017;19:649-58
18. Sbiera S, Schmull S, Assie G, Voelker HU, Kraus L, Beyer M. et al. High diagnostic and prognostic value of steroidogenic factor-1 expression in adrenal tumors. The Journal of clinical endocrinology and metabolism. 2010;95:E161-71
19. Demeure MJ, Coan KE, Grant CS, Komorowski RA, Stephan E, Sinari S. et al. PTTG1 overexpression in adrenocortical cancer is associated with poor survival and represents a potential therapeutic target. Surgery. 2013;154:1405-16 discussion 16
20. Tabbal H, Septier A, Mathieu M, Drelon C, Rodriguez S, Djari C. et al. EZH2 cooperates with E2F1 to stimulate expression of genes involved in adrenocortical carcinoma aggressiveness. British journal of cancer. 2019;121:384-94
21. Sbiera S, Sbiera I, Ruggiero C, Doghman-Bouguerra M, Korpershoek E, de Krijger RR. et al. Assessment of VAV2 Expression Refines Prognostic Prediction in Adrenocortical Carcinoma. The Journal of clinical endocrinology and metabolism. 2017;102:3491-8
22. Yuan K, Ye J, Liu Z, Ren Y, He W, Xu J. et al. Complement C3 overexpression activates JAK2/STAT3 pathway and correlates with gastric cancer progression. Journal of experimental & clinical cancer research: CR. 2020;39:9
23. Wu X, Wang L, Feng F, Tian S. Weighted gene expression profiles identify diagnostic and prognostic genes for lung adenocarcinoma and squamous cell carcinoma. The Journal of international medical research. 2019: 300060519893837.
24. Zeng C, Chen Y. HTR1D, TIMP1, SERPINE1, MMP3 and CNR2 affect the survival of patients with colon adenocarcinoma. Oncology letters. 2019;18:2448-54
25. Wu JY, Huang TW, Hsieh YT, Wang YF, Yen CC, Lee GL. et al. Cancer-Derived Succinate Promotes Macrophage Polarization and Cancer Metastasis via Succinate Receptor. Molecular cell. 2020;77:213-27 e5
26. Misawa K, Mochizuki D, Imai A, Mima M, Misawa Y, Mineta H. Analysis of Site-Specific Methylation of Tumor-Related Genes in Head and Neck Cancer: Potential Utility as Biomarkers for Prognosis. Cancers. 2018 10
27. Heidegger H, Dietlmeier S, Ye Y, Kuhn C, Vattai A, Aberl C. et al. The Prostaglandin EP3 Receptor Is an Independent Negative Prognostic Factor for Cervical Cancer Patients. International journal of molecular sciences. 2017 18
28. Wentzensen N, Bakkum-Gamez JN, Killian JK, Sampson J, Guido R, Glass A. et al. Discovery and validation of methylation markers for endometrial cancer. International journal of cancer Journal international du cancer. 2014;135:1860-8
29. Choi M, Kadara H, Zhang J, Parra ER, Rodriguez-Canales J, Gaffney SG. et al. Mutation profiles in early-stage lung squamous cell carcinoma with clinical follow-up and correlation with markers of immune function. Ann Oncol. 2017;28:83-9
30. Xu X, Wang Y, Chen J, Ma H, Shao Z, Chen H. et al. High expression of CX3CL1/CX3CR1 axis predicts a poor prognosis of pancreatic ductal adenocarcinoma. J Gastrointest Surg. 2012;16:1493-8
31. Liu Q, Li A, Yu S, Qin S, Han N, Pestell RG. et al. DACH1 antagonizes CXCL8 to repress tumorigenesis of lung adenocarcinoma and improve prognosis. Journal of hematology & oncology. 2018;11:53
32. Bilimoria KY, Shen WT, Elaraj D, Bentrem DJ, Winchester DJ, Kebebew E. et al. Adrenocortical carcinoma in the United States: treatment utilization and prognostic factors. Cancer. 2008;113:3130-6
33. Else T, Williams AR, Sabolch A, Jolly S, Miller BS, Hammer GD. Adjuvant therapies and patient and tumor characteristics associated with survival of adult patients with adrenocortical carcinoma. The Journal of clinical endocrinology and metabolism. 2014;99:455-61
34. Drelon C, Berthon A, Sahut-Barnola I, Mathieu M, Dumontet T, Rodriguez S. et al. PKA inhibits WNT signalling in adrenal cortex zonation and prevents malignant tumour development. Nature communications. 2016;7:12751
35. Fojo T, Huff L, Litman T, Im K, Edgerly M, Del Rivero J. et al. Metastatic and recurrent adrenocortical cancer is not defined by its genomic landscape. BMC medical genomics. 2020;13:165
36. Frohlich LF. Micrornas at the Interface between Osteogenesis and Angiogenesis as Targets for Bone Regeneration. Cells. 2019 8
37. Godlewski J, Lenart J, Salinska E. MicroRNA in Brain pathology: Neurodegeneration the Other Side of the Brain Cancer. Non-coding RNA. 2019 5
38. Yan H, Li H, Silva MA, Guan Y, Yang L, Zhu L. et al. LncRNA FLVCR1-AS1 mediates miR-513/YAP1 signaling to promote cell progression, migration, invasion and EMT process in ovarian cancer. Journal of experimental & clinical cancer research: CR. 2019;38:356
39. Wang Z, Wang J, Yang Y, Hao B, Wang R, Li Y. et al. Loss of has-miR-337-3p expression is associated with lymph node metastasis of human gastric cancer. Journal of experimental & clinical cancer research: CR. 2013;32:76
40. Zhao L, Wang W, Xu L, Yi T, Zhao X, Wei Y. et al. Integrative network biology analysis identifies miR-508-3p as the determinant for the mesenchymal identity and a strong prognostic biomarker of ovarian cancer. Oncogene. 2019;38:2305-19
41. Gao S, Liu H, Hou S, Wu L, Yang Z, Shen J. et al. MiR-489 suppresses tumor growth and invasion by targeting HDAC7 in colorectal cancer. Clinical & translational oncology: official publication of the Federation of Spanish Oncology Societies and of the National Cancer Institute of Mexico. 2018;20:703-12
42. Wei CH, Wu G, Cai Q, Gao XC, Tong F, Zhou R. et al. MicroRNA-330-3p promotes cell invasion and metastasis in non-small cell lung cancer through GRIA3 by activating MAPK/ERK signaling pathway. Journal of hematology & oncology. 2017;10:125
Author contact
![]() Corresponding author: Hongjun Li, Department of Urology, Peking Union Medical College Hospital, Peking Union Medical College, Chinese Academy of Medical Sciences, No 1. Shuaifuyuan , Beijing, China. Tel: +86 10 69156034; Fax: +86 10 69156035; E-mail address: lihongjuncn
Corresponding author: Hongjun Li, Department of Urology, Peking Union Medical College Hospital, Peking Union Medical College, Chinese Academy of Medical Sciences, No 1. Shuaifuyuan , Beijing, China. Tel: +86 10 69156034; Fax: +86 10 69156035; E-mail address: lihongjuncn