Impact Factor ISSN: 1449-1907

 Global reach, higher impact
Int J Med Sci 2021; 18(3):695-705. doi:10.7150/ijms.52347 This issue Cite
Research Paper
The effects of different types of aquatic exercise training interventions on a high-fructose diet-fed mice
Yi-Ju Hsu1, Mon-Chien Lee1, Chi-Chang Huang1, ![]() , Chun-Sheng Ho2,3,
, Chun-Sheng Ho2,3, ![]()
1. Graduate Institute of Sports Science, National Taiwan Sport University, Taoyuan 333325, Taiwan
2. Department of Physical Therapy, College of Medical and Health Science, Asia University, Taichung 41354, Taiwan
3. Division of Physical Medicine and Rehabilitation, Lo-Hsu Medical Foundation, Inc., Lotung Poh-Ai Hospital, Yilan 26546, Taiwan
Received 2020-8-24; Accepted 2020-11-25; Published 2021-1-1
Abstract
Gradual weight gain in modern people and a lowering onset age of metabolic disease are highly correlated with the intake of sugary drinks and sweets. Long-term excessive fructose consumption can lead to hyperglycemia, hyperlipidemia and accumulation of visceral fat. Abdominal obesity is more severe in females than in males. In this study, we used a high-fructose-diet-induced model of obesity in female mice. We investigated the effects of aquatic exercise training on body weight and body composition. After 1 week of acclimatization, female ICR mice were randomly divided into two groups: a normal group (n=8) fed standard diet (control), and a high-fructose diet (HFD) group (n=24) fed a HFD. After 4 weeks of induction followed by 4 weeks of aquatic exercise training, the 24 obese mice were divided into 3 groups (n=8 per group): HFD with sedentary control (HFD), HFD with aquatic strength exercise training (HFD+SE), and HFD with aquatic aerobic exercise training (HFD+AE). We conducted serum biochemical profile analysis, weighed the white adipose tissue, and performed organ histopathology. After 4 weeks of induction and 4 weeks of aquatic exercise training, there was no significant difference in body weight among the HFD, HFD+SE and HFD+AE groups. Serum triglyceride (TG), AST, ALT, and uric acid level were significantly lower in the HFD+SE and HFD+AE groups than in the HFD group. The weight of the perirenal fat pad was significantly lower in the HFD+AE group than in the HFD group. Hepatic TG and total cholesterol (TC) were significantly lower in the HFD+AE group than in the other groups. Long-term intake of a high-fructose diet can lead to obesity and increase the risk of metabolic disease. Based on our findings, we speculate that aquatic exercise training can effectively promote health and fitness. However, aquatic aerobic exercise training appears to have greater benefits than aquatic strength exercise training.
Keywords: high-fructose diet, aquatic exercise training, aerobic exercise, body fat
Introduction
Since modern people often eat out or eat too much, and the food is high in sugar and calories, many people gain weight day by day, and the age of onset of some diseases is falling. According to statistics from the World Health Organization (WHO), in 2008, it was estimated that 50 billion people were obese, and that number is increasing [1]. The above phenomenon is associated with the excessive intake of sugar-sweetened beverages and sweets. It has been found in epidemiological research that the consumption of fructose in the diet, either sucrose or high-fructose syrup, is associated with metabolic-related complications, including obesity [2], cardiovascular disease [3], Type II diabetes mellitus [4], and non-alcohol fatty liver disease [5]. Among the factors causing obesity, the primary ones are improper dietary behaviors and a lack of physical activity. Most people believe that obesity and metabolic diseases due to diet are caused by excessive fat intake, but they often ignore the fact that the calories from refined sugar are also actually one of the major causes of obesity. There is now strong evidence that intake of added fructose, contributes to the rising obesity and diabetes rates [6]. Fructose is different from glucose in metabolism. Whereas glucose can be directly used as an energy source by human cells, fructose must be transported to the liver, kidney and intestinal tract and converted into glucose, lactic acids and fatty acids before being utilized by body tissues [7]. Fructose may bypass the important rate-limiting step of glycolysis and enter the intermediate step of glycolysis in the metabolic process, leading to the production of excessive fatty acids [8]. This production in turn leads to the accumulation of free fatty acids in the liver [9, 10]. Furthermore, fructose is also insensitive to the stimulations of energy regulation hormones (including growth hormones, insulin and leptin), decreases metabolism and energy consumption, and increases appetite [11, 12]. These special metabolic pathways easily cause an energy imbalance in the body and thus lead to metabolic disorders.
It has been found in both human clinical trials [11, 13] and animal experiments [14, 15] that excessive fructose intake is associated with different pathological-related symptoms, including weight gain, increased visceral fat, glucose intolerance, insulin resistance, hypertriglyceridemia and dyslipidemia. Many studies have confirmed the numerous health benefits of aquatic aerobic exercise training, including reducing visceral fat, increasing insulin sensitivity, and alleviating obesity and metabolic diseases caused by obesity. It is a very effective way to lose weight by improving the balance of hormones and metabolism in the body [16]. However, strength exercise training in exercise therapy for weight loss in patients with metabolic diseases and obesity is also part of the exercise prescription. Fat oxidation can be promoted and lipid metabolism can be enhanced by aquatic strength exercise training, thereby reducing body fat and increasing muscle mass [17]. It can effectively increase body mass, prevent diseases, and improve the quality of life [18]. In this study, female mice were used to simulate human females consuming a high-fructose diet, and obesity was thus induced, to investigate whether body weight and body fat can be controlled by aerobic or aquatic strength exercise training and the effects of such training on dyslipidemia.
Methods
Animals and treatment
Female ICR mice (8 weeks old) grown under specific pathogen-free conditions were purchased from BioLASCO (Yi-Lan, Taiwan). All mice were provided a standard laboratory diet (No. 5001; PMI Nutrition International, Brentwood, MO, USA) and distilled water ad libitum and were housed under a 12-hr light/dark cycle at room temperature (22 °C ± 1 °C) and 50%-60% humidity. The Institutional Animal Care and Use Committee (IACUC) of National Taiwan Sport University (NTSU) inspected all animal experiments, and this study conformed to the guidelines of protocol IACUC-10527 approved by the IACUC ethics committee.
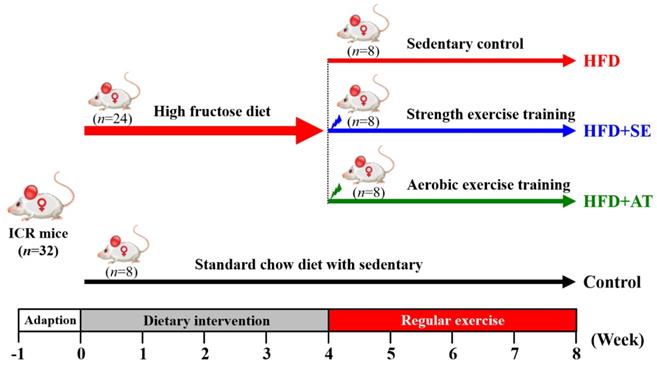
The experimental design is depicted in Fig. 1. After 1 week of acclimatization, 32 mice were divided randomly into two groups. The normal group (n=8) was fed a standard chow diet (control), and the experimental group (n=24) received a high-fructose diet (HFD). The 24 experimental mice were divided into three groups (n=8/each group): (1) HFD with sedentary control (HFD), (2) HFD with aquatic strength exercise training (HFD+SE) and (3) HFD with aquatic aerobic exercise training (HFD+AE). Food intake and water consumption were recorded daily, and all animals were weighed weekly.
Experimental design.
Diet composition
The mice in the control group were fed a standard chow diet comprising 4.07 kcal/g. The calorie percentages were 28.5% protein, 13.5% fat and 58.0% carbohydrate. The mice in the high-fructose diet group were fed a high-fructose diet (HFD) comprising 4.22 kcal/g, 8% lard (wt/wt), 44% high fructose syrup (wt/wt), and 48% standard chow diet (wt/wt). The calorie percentages were 10.7% protein, 11.6% fat and 77.6% carbohydrate.
Exercise training protocol
In the aquatic strength exercise training, progressive weight-bearing muscle strength training was used [19], with five training sessions per week. In the first week, the mice swam for 3 minutes and rested for 1 minute for six times in total, and the weight load was gradually increased from 3% to 8% of body weight. In the second week, the mice swam for 2 minutes and rested for 1 minute, and the weight load was increased by 3% of body weight every two days. For every increase of 6%, the number of times was doubled, and the swimming time decreased by 0.5 minutes. This pattern was repeated for the second to fourth weeks. An 86-liter bucket was used, the water temperature was 30 ± 1°C, and the water level was adjusted according to the length of each mouse. Eight experimental mice were put in a bucket, as described in a previous experiment [20].
In aquatic aerobic exercise training, the aquatic weight-free swimming training mode was used. The mice in the aquatic aerobic exercise training group received exercise training of 30 minutes per day, and the length was gradually increased by 3 minutes to 60 minutes per day. This swimming training mode without any weight was performed five times per week. According to the literature, the exercise intensity is between 40-60% VO2 max, so this mode is medium-intensity long-term exercise training [21].
Clinical biochemical profiles
At the end of the experimental period, the mice were euthanized by 95% CO2 asphyxiation and blood was collected immediately. Serum was separated by centrifugation, and an autoanalyzer (Hitachi 7060) was used to measure the levels of the clinical biochemical variables: aspartate aminotransferase (AST), alanine aminotransferase (ALT), high-density lipoprotein cholesterol (HDL-C), low-density lipoprotein cholesterol (LDL-C), total protein (TP), blood urea nitrogen (BUN), creatinine, uric acid (UA), total cholesterol (TC), triacylglycerol (TG) and albumin.
Hepatic lipid profiles
Hepatic lipids were extracted according to the method of Folch [22]. In brief, extracted buffer A (chloroform : methanol = 2:1, v/v) was added to liver tissues, and the tissues were centrifuged at 3500 ×g and 4 °C for 10 minutes. After removal of the supernatants, the sample was remixed appropriately with extracted buffer B (chloroform : methanol : water = 3:48:47, v/v) and then centrifuged again. Finally, soluble lipids in the subnatant layer was used for further analysis. Hepatic triacylglycerol (TG) and total cholesterol (TC) concentrations were determined using diagnostic kits (Randox Laboratories, Antrim, UK). The liver extraction was mixed well with 100 times reagent buffer for 10 minutes and the absorbance value was measured under OD 500 nm.
Histology of tissues
The liver, muscle (gastrocnemius and soleus muscles in the back part of the lower legs), heart, lung, kidney, uterine fat pads (UFP), retroperitoneal fat pad (RFP), and perirenal fat pad (PFP) from each group were photographed with a Cyber-Shot (DSC-HX30V, Sony, Tokyo). The tissues were dissected, weighed and snap-frozen in liquid nitrogen before being stored at -80°C. Another set of liver tissues was removed intact and fixed in 10% neutral buffered formalin for 24 hours before being processed for histopathologic analysis. Tissues were embedded in paraffin and cut into 4-μm thick slices for morphological and pathological evaluation, stained with hematoxylin and eosin (H&E), and finally examined by use of a light microscope equipped with a CCD camera (BX-51, Olympus, Tokyo).
Statistical analysis
Data are expressed as mean ± SEM. Statistical differences were analyzed by one-way ANOVA with SAS 9.0 (SAS Inst., Cary, NC, USA). P < 0.05 was considered statistically significant.
Results
Effect of aquatic exercise training on body weight
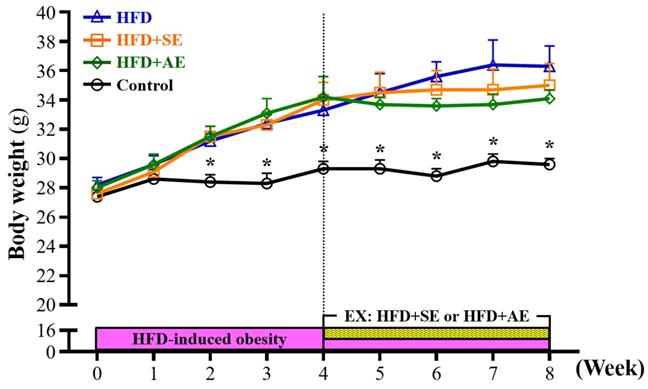
The weekly weight changes of the animals in each group during the experiment are shown in Figure 2. Prior to the experiment, the mice were randomly divided into four groups: Control, HFD, HFD+SE, and HFD+AE. After the mice received a high-fructose diet, the body weights of the mice in the HFD, HFD+SE and HFD+AE groups were 10% (P = 0.0036), 11% (P = 0.0018) and 11% (P = 0.0017) higher than that in the control group respectively, and there were significant differences at the second week. The body weights of the mice in the HFD, HFD+SE and HFD+AE groups were 14% (P = 0.0015), 14% (P = 0.0016) and 17% (P = 0.0003) higher than that in the control group respectively, and there were significant differences at the third week. The body weights of the mice in the HFD, HFD+SE and HFD+AE groups were 14% (P = 0.0417), 16% (P = 0.0049) and 17% (P = 0.004) higher than that in the control group respectively, and there were significant differences at the fourth week.
Aerobic or aquatic strength exercise training prevented high-fructose-diet-induced obesity in mice on a growth curve. Data shown are the mean ± SEM (n=8 mice per group). One-way ANOVA was used for analysis. * P < 0.05 compared with HFD group within each group.
Effect of aquatic exercise training on water consumption and energy intake
The average daily food water consumption amounts in each group are shown in Figure 3A and 3B. In Figure 3A, during the first four weeks of high-fructose diet induction, the average daily water consumption amounts of each animal in the Control, HFD, HFD+SE and HFD+AE groups were 7.14 ± 0.20, 3.11 ± 0.12, 2.96 ± 0.11 and 3.77 ± 0.20 mL respectively, and the daily water intakes of the animals in the HFD, HFD+SE and HFD+AE groups were significantly lower than that in the Control group by 56.4% (P < 0.0001), 58.5% (P < 0.0001) and 47.1% (P < 0.0001). During the last four weeks of aerobic or aquatic strength exercise training, as shown in Figure 3B, the average daily water consumption amounts of each animal in the Control, HFD, HFD+SE and HFD+AE groups were 7.14 ± 0.41, 3.74 ± 0.15, 2.99 ± 0.13 and 2.98 ± 0.14 (mL) respectively, and the daily water intakes of the animals in the HFD, HFD+SE and HFD+AE groups were significantly lower than that in the Control group by 47.7% (P < 0.0001), 58.2% (P < 0.0001) and 58.2% (P < 0.0001).
Aerobic or aquatic strength exercise training prevented high-fat-diet- induced obesity in mice on (A) water consumption and (B) energy intake. Mice (6 weeks old) were fed a HFD for up to 8 weeks combined with 4 weeks of aerobic or aquatic strength exercise training. Data shown are the mean ± SEM (n=8 mice per group). One-way ANOVA was used for analysis. * P < 0.05 compared with HFD group within each group.
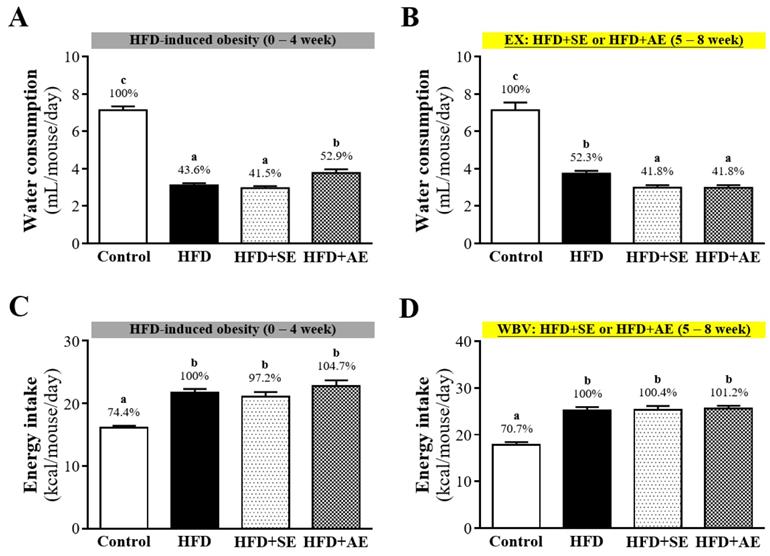
The recorded data of the average daily calorie intakes of the animals in each group are shown in Figure 3C and 3D. In Figure 3C, during the first four weeks of the high-fructose diet, the average daily calorie intakes of each animal in the Control, HFD, HFD+SE and HFD+AE groups were 16.13 ± 0.30, 21.69 ± 0.61, 26.35 ± 0.9 and 28.39 ± 1.21 kcal respectively, and the daily calorie intake of the animals in the Control group was the lowest. As shown in Figure 3D, during second four weeks, with aquatic aerobic or aquatic strength exercise training, the average daily calorie intakes of each animal in the Control, HFD, HFD+SE and HFD+AE groups were 17.86 ± 0.54, 25.25 ± 0.67, 29.53 ± 0.92 and 21.50 ± 0.54 kcal respectively, and the daily calorie intake of the animals in the Control group was the lowest.
Effect of aquatic exercise training on body fat
After the experimental mice were sacrificed, three sites were the primary collection sites of white adipose tissue: the uterine fat pad (UFP), the perirenal fat pad (PFP), and mesenteric fat (MF). As shown in Figure 4, the UFP, PFP and MF weights were significantly higher in the HFD group than in the Control group. As shown in Figures 4A, 4C and 4E, UFP, MF and PFP weights were higher in the HFD group than in the Control group by 79.5% (P < 0.0001), 33.1% (P = 0.0163) and 81% (P < 0.0001) respectively. In the HFD+SE and HFD groups, there were no significant differences in UFP, PFP and MF weights (P = 0.319, 0.2295, 0.2371). As shown in Figures 4C and 4E, comparing the HFD+AE and HFD groups, the weights of MF and PFP were significantly lower in the former group than in the latter group by 22.9% (P = 0.088) and 32.6% (P = 0.0309) respectively. There was no significant difference in the weight of UFP.
Effect of 4 weeks of aerobic or aquatic strength exercise training on tissue weights of (A) uterine fat pad (UFP), (B) mesenteric fat, (C) perirenal fat pad and (PFP) and (D) total body fat in HFD-fed mice. The relative weight (%) of (E) uterine fat pad (UFP), (F) mesenteric fat, (G) perirenal fat pad and (PFP) and (H) total body fat weight. Data are mean ± SEM (n=8 mice per group). Different letters (a, b, c) indicate significant difference at P < 0.05.
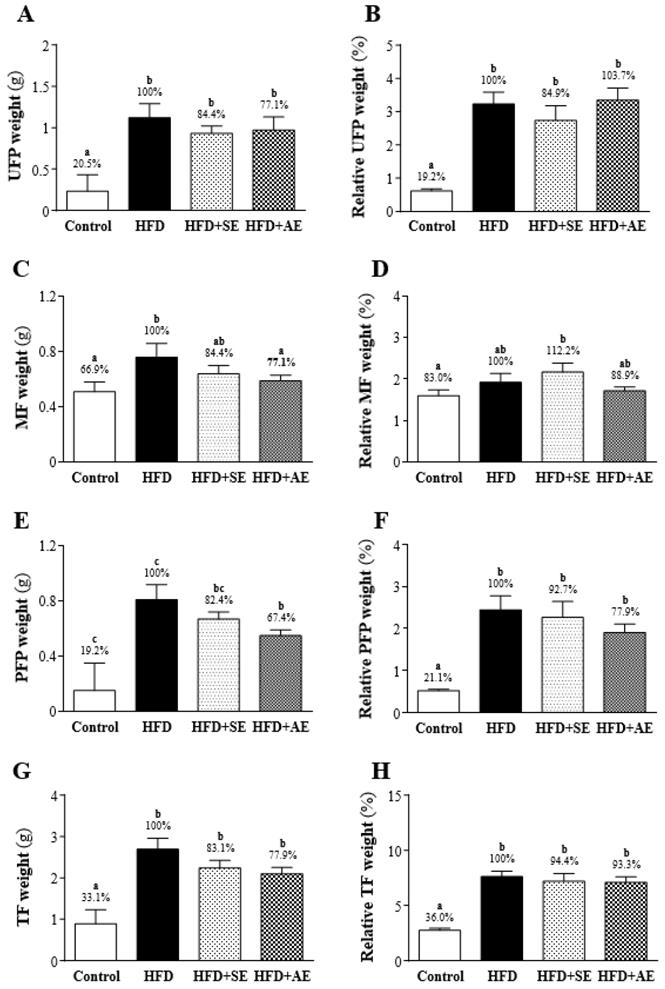
As shown in Figure 4G, the total body fat (TF; UFP+PFP+MF) weights were significantly higher in the HFD, HFD+SE, and HFD+AE groups than in the Control group by 66.9% (P < 0.0001), 50% (P = 0.0001) and 44.8% (P = 0.0005) respectively. There was no significant difference among the HFD+SE, HFD+AE and HFD groups.
As shown in Figures 4B, 4D and 4F, regarding the relative weights of each fat, UFP and PFP were significantly higher in the HFD group than in the Control group, but there was no significant difference in MF. The ratios of the relative weights of UFP, MF and PFP to the Control and the HFD groups were 80.8% (P < 0.0001), 17% (P = 0.1867) and 78.9% (P < 0.0001) respectively. There was no significant difference in UFP, PFP or MF (P = 0.3145, 0.6466, 0.3347) between the HFD and HFD+SE groups. Comparing the HFD group with the HFD+AE group, there was no significant difference in UFP, PFP or MF (P = 0.8013, 0.1705, 0.3791).
As shown in Figure 4H, the relative TF weights were significantly higher in the HFD, HFD+SE and HFD+AE groups than in the Control group by 64% (P < 0.0001), 58.4% (P <0.0001), and 56.3% (P < 0.0001) respectively. However, there was no significant difference between the HFD+SE, HFD+AE, and the HFD groups.
Effect of aquatic exercise training on biochemical assessments
The contents of the blood biochemical parameters are shown in Table 1. AST and ALT were significantly higher in the HFD group than in the control group by 2 folds (P < 0.001) and 2.71 folds (P = 0.0018). AST and ALT were significantly lower in the HFD+SE and HFD+AE groups than in the HFD group.
Biochemical analysis at the end of the experiment.
| Parameters | Control | HFD | HFD+SE | HFD+AE |
|---|---|---|---|---|
| AST (U/dL) | 117 ± 14 a | 235 ± 29 b | 143 ± 13 a | 147 ± 9 a |
| ALT (U/dL) | 47 ± 5 a | 128 ± 32 b | 51 ± 5 a | 52 ± 5 a |
| HDL-C (mg/dL) | 43 ± 3 a | 86 ± 4 c | 75 ± 3 b | 75 ± 4 b |
| LDL-C (mg/dL) | 4.9 ± 0.3 a | 11.8 ± 1.3 b | 10.3 ± 1.0 b | 10.2 ± 0.5 b |
| TC (mg/dL) | 80 ± 4 a | 159 ± 7 b | 151 ± 4 b | 149 ± 8 b |
| TG (mg/dL) | 93 ± 3 a | 143 ± 14 b | 99 ± 5 a | 97 ± 6 a |
| TP (g/dL) | 5.0 ± 0.1 a | 4.9 ± 0.1 a | 5.1 ± 0.0 b | 5.2 ± 0.1 b |
| BUN (mg/dL) | 23.4 ± 1.37 b | 13.7 ± 0.5 a | 14.1 ± 0.7 a | 14.0 ± 0.8 a |
| Creatinine (mg/dL) | 0.23 ± 0.02 b | 0.19 ± 0.01 a | 0.18 ± 0.01 a | 0.18 ± 0.01 a |
| UA (mg/dL) | 2.86 ± 0.41 b | 2.95 ± 1.07 b | 1.86 ± 0.13 a | 1.89 ± 0.21 a |
| Albumin (g/dL) | 3.44 ± 0.06 a | 3.24 ± 0.03 b | 3.43 ± 0.03 a | 3.49 ± 0.03 a |
Data shown are the mean ± EM (n=8 mice per group). One-way ANOVA and Duncan's test were used for analysis. Different letters indicate significant difference at P < 0.05. AST, aspartate aminotransferase; ALT, alanine aminotransferase; TP, total protein; BUN, blood urea nitrogen; UA, uric acid; TC, total cholesterol; TG, triacylglycerol.
The blood TG content was significantly higher in the HFD group than in the Control group by 1.54 folds (P < 0.001), but the blood TG contents in the HFD+SE and HFD+AE groups were not significantly different from that in the Control group. In the high-fructose diet groups, blood TG contents were significantly lower in the HFD+SE and HFD+AE groups than in the HFD group (P < 0.05). The blood TC contents were significantly higher in the HFD, HFD+SE and HFD+AE groups than in the control group by 1.99 folds (P < 0.001), 1.89 folds (P < 0.001) and 1.86 folds (P < 0.001). There was no significant difference between the high-fructose diet groups. The blood HDL-C contents were significantly higher in the HFD, HFD+SE and HFD+AE groups than in the control group by 2 folds, 1.74 folds, and 1.74 folds (P < 0.001). The blood LDL-C contents were significantly higher in the HFD, HFD+SE and HFD+AE groups than in the control group by 2.41 folds, 2.1 folds and 2.08 folds (P < 0.001), and there was no significant difference between the high-fructose diet groups.
The blood urea nitrogen (BUN) contents were lower in the HFD, HFD+SE and HFD+AE groups than in the control group by 59% (P < 0.001), 60% (P < 0.001), and 60% (P < 0.001). The creatinine (CREA) contents were lower in the HFD, HFD+SE and HFD+AE groups than in the control group by 83% (P = 0.0483), 78% (P = 0.0271), and 78% (P < 0.0092). The blood total protein (TP) contents did not differ significantly among the four groups. The blood albumin contents were significantly lower in the HFD group than in the control group by 94% (P = 0.0009). The blood uric acid (UA) contents were respectively lower in the HFD+SE and HFD+AE groups than in the control and HFD groups by 65% (P = 0.006) and 63% (P = 0.0031) and by 63% (P = 0.0072) and 64% (P = 0.0038).
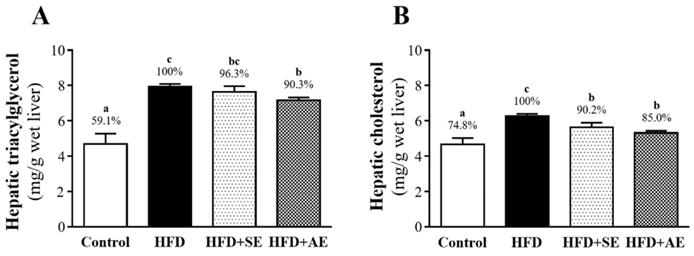
Effect of aquatic exercise training on liver TG and TC
As shown in Figure 5A, hepatic TG was significantly higher in the HED group than in the control (40.9%, P < 0.0001) and HFD+AE (9.7%, P = 0.0304) groups, and there was no significant difference between the HED and HFD+SE groups. Hepatic TC was significantly higher in the HFD group than in the control, HFD+SE and HFD+AE groups, by 25.2% (P < 0.0001), 9.8% (P = 0.0218) and 15.0% (P = 0.009), respectively (Figure 5B).
Aerobic or aquatic strength exercise training for mice: (A) liver, (B) skeletal muscle, (C) heart, (D) lung, (E) UFP, (F) kidney. In the fasted state, all the animals were sacrificed and tissue was removed for pathological analysis of tissue sections. Specimens were photographed by light microscopy. (Olympus BX51) (H&E staining, magnification: × 200, Scale bar, 40 μm).
Effect of aquatic exercise training on histology
Fig. 6A presents H&E staining of the liver showing the sizes of the liver tissue cells in each group. Normal liver lobes have correct cell arrangement and no oil droplet accumulation (i.e., microvesicular fat). However, as compared to the Control group, the distribution proportion and size of lipid droplets in the HFD group were significantly greater, and as compared to the high fructose group, the distribution proportions and sizes of lipid droplets in the HFD+SE and HFD+AE groups were significantly smaller. Therefore, a decrease in the accumulation of microvesicular droplets and thus fatty liver resulted from the training of both exercise modes.
Aerobic or aquatic strength exercise training for mice: (A) liver, (B) skeletal muscle, (C) heart, (D) lung, (E) UFP, (F) kidney. In the fasted state, all the animals were sacrificed and tissue was removed for pathological analysis of tissue sections. Specimens were photographed by light microscopy (Olympus BX51) (H&E staining, magnification: × 200, Scale bar, 40 μm).
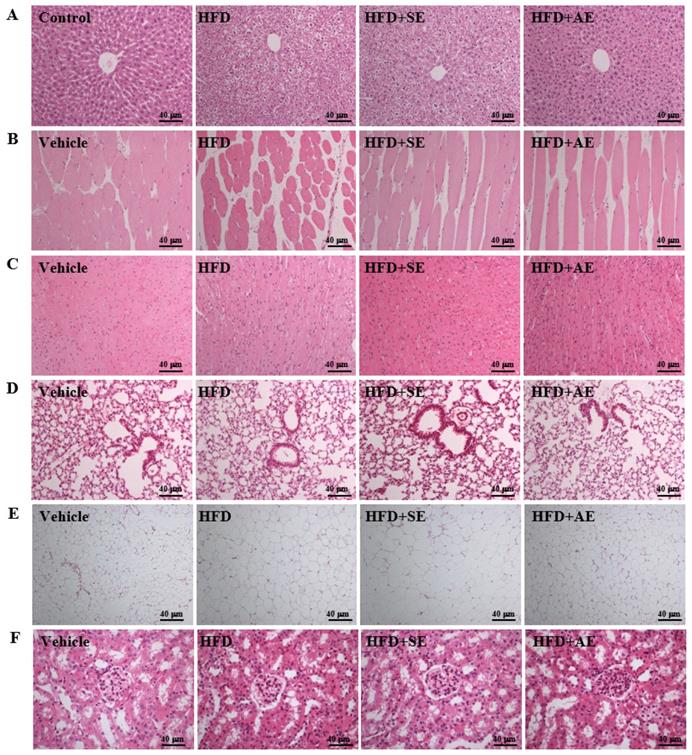
Figure 6B presents H&E staining of the gastrocnemius muscle showing that the cell size, muscle texture and arrangement of the gastrocnemius muscle were not abnormal in each group. Therefore, this experimental mode had no effect on the muscle tissues.
Figure 6C presents H&E staining of the heart showing that the cell sizes and arrangements of the cardiomyocytes were not abnormal in each group. Therefore, this experimental mode had no effect on the heart tissues.
Figure 6D presents H&E staining of the lung showing that the cell sizes and arrangements of the lung cells were not abnormal in each group. Therefore, this experimental mode had no effect on the lung tissues.
Figure 6E presents H&E staining of the UFP. In normal uterine tissues such as the Control group, the fat cells are tightly arranged and there is no vacuolar hypertrophy. However, as compared to those of the Control group, the size and proportion of adipose cells in the HFD group were significantly more hypertrophic. The vacuole proportion and cell size were smaller in the HFD+AE group than in the high fructose group, and there was no significant difference between the HFD and HFD+SE groups. These results indicate that aquatic aerobic exercise training can enhance the beta-oxidation of adipose tissues, thereby decreasing the fat proportion.
Figure 6F presents H&E staining of the kidney showing the renal cells. The arrangements and sizes of the renal glomerulus were not abnormal in the four groups. Therefore, this experimental mode had no effect on the kidney and functional diseases.
Discussion
The results of this experiment showed that in ICR mice fed a high-fructose diet, the body weight significantly increased. The results confirm that consuming a high-fructose diet for four weeks can indeed cause obesity in mice. In the second week, the body weights of the three fructose diet groups (HFD, HFD+SE, HFD+AE) had all significantly increased as compared to the control group. After the four weeks of aquatic exercise training, the body weights of the HFD+SE and HFD+AE groups were 4.48% and 6.23% lower than that of the HFD group, respectively. There was a downward trend but no significant difference. When the mice received a high-fructose diet, their daily calorie intake was significantly higher than that in the control group. Studies have indicated that the intake of fructose can promote appetite and enhance dietary behaviors [23]. The intake of fructose can inhibit growth hormones and reduce the concentration of leptin. The imbalance of these hormones can affect the regulation of appetite and lead to insufficient satiety, thereby increasing food intake [24]. In the high-fructose diet groups, the daily calorie intake of the four-week aquatic aerobic exercise training (HFD+AE group) was significantly lower than that of the HFD group. It has been found by animal researchers that fructose intake is associated with leptin resistance and the occurrence of obesity [25, 26]. A study by Astrup et al. found that after ten weeks of receiving a diet with 28% sucrose or artificial sweetener having equivalent calories, the group fed sucrose showed a significant increase in daily calorie intake, body weight and fat content [27]. In terms of daily water consumption, it was obvious that the water intake of the ICR mice fed a high-fructose diet was lower than that of the control group, whether they were involved in aquatic exercise or not. It is presumed that due to the increase in daily food intake, the experimental mice were fully satiated, and thus the daily water intake decreased.
In terms of the adipose tissue content, after the eight weeks of fructose diet, the UFP, MF, PFP and TF weights were all significantly higher in the HFD group than in the control group, confirming once again that a high-fructose diet can indeed increase the occurrence of obesity. In terms of blood analysis, in the experimental group fed a high-fructose diet, the contents of TC, TG, LDL-C and HDL-C in the blood significantly increased. The literature has indicated that a large intake of fructose (including calorie-free beverages) can increase the risks of obesity [3], abdominal obesity [28], visceral fat [29], and dyslipidemia [30]. Fructose can effectively induce the formation of endogenous fat in the liver and may increase the concentrations of triglyceride-rich lipoprotein (TRL-TG) and blood triglycerides after a meal [31]. Previous studies have indicated that aquatic aerobic exercise training has an effect on reducing triglycerides, and that the visceral and abdominal adipose tissues of overweight and obese people also can be reduced [32, 33]. The same results were found in this study. After aquatic aerobic exercise training, PFP was significantly lower in the HFD+AE group than in the HFD group, and the blood triglyceride content was also lower. The results of UFP tissue sections in the HFD+AE group showed that the proportions of vacuoles and cell sizes were smaller than those in the HFD group. A study by Egli et al. reported that, in a comparison of healthy subjects fed a high-fructose diet and doing 30-minute aquatic aerobic exercise training per day and those fed a high-fructose diet but no exercise, the concentrations of TG, TRL-TG and apoB48 in the blood were lower in the former, and the lipid oxidation and concentration of non-esterified fatty acids in the blood increased in the exercise group [34]. Matos et al. demonstrated that aerobic exercise reduces the pro-inflammatory proteins levels and protein-tyrosine phosphatase 1B (PTP-1B) activity, thereby reducing the insulin resistance state [35, 36]. Therefore, aerobic exercise increases insulin sensitivity and glucose uptake in skeletal muscle [37]. On the other hand, exercise has been demonstrated to provide an agonist action of insulin in the skeletal muscle, extends to other key tissues such as the liver and adipose tissue [38, 39].
The results of this study show that a high-fructose diet can significantly increase the contents of liver damage indices, including AST and ALT, and the liver tissue sections showed that the distribution and size of lipid droplets in the livers of the HFD group were both significantly greater than those in the control group. These results indicate that, after the eight weeks of consuming a high-fructose diet, fat accumulation in the liver (i.e., fatty liver) developed in the mice, leading to liver dysfunction. Studies have indicated that fructose is the primary cause of excessive fat accumulation in the liver [40, 41]. A high sugar diet (i.e., sucrose or high fructose corn syrup) can increase the risk of not only NAFLD [5] but also NASH [42].
The uric acid content in the blood was significantly reduced in the HFD+SE and HFD+AE groups. A previous study indicated that exercise is also one of the important factors that affect uric acid [43]. Although doing vigorous aquatic aerobic exercise training for half an hour to three hours will increase the current uric acid content in the blood, a natural consequence of physical fatigue resulting from excessive exercise, long-term regular exercise can enhance physical fitness and reduce the uric acid content in the blood [44]. Relevant studies have indicated that people with a higher frequency of activity have a lower incidence of hyperuricemia than do those with lower levels of activity or sedentary lifestyles [45]. In a meta-analysis study of the correlation between physical activity and hyperuricemia, low-intensity and moderate-intensity physical activity were found to reduce the uric acid content by 12%, and high-intensity physical activity was found to reduce the uric acid content by 29% [46].
The long-term intake of a high fructose diet can cause obesity and increase the risk of metabolic diseases. In addition, the results of this study indicate that a long-term, continuous, non-improved diet cannot easily reduce the TC and LDL-C contents in the blood, even if exercise habits are increased. However, it seems that aerobic or aquatic strength exercise training has the potential to lower the risk of metabolic diseases. This study has found that body weight, as well as the TG, AST, ALT and uric acid contents of the PFP and in the blood, can be effectively reduced by aquatic exercise training. Further studies are needed to explore maintain of this program and follow up the period to validate the long-term of its benefits for health.
Conclusions
After eight weeks of a high-fructose diet, the body weight, lipid content in the blood, and white adipose tissue content in the bodies (i.e., UFP, PFP, and MF) of the female mice were increased, as well as the distribution proportions and sizes of lipid droplets in the liver tissue and hypertrophy of adipose cells in the UFP tissue. However, there was a downward trend in weight, and the TG, AST, ALT and uric acid contents in the blood were reduced by the four weeks of aquatic strength and aerobic exercise training, as were the distributions and sizes of lipid droplets in the liver. The fat accumulation in the liver was also reduced, thereby decreasing the incidence of fatty liver. Furthermore, the sizes and vacuole proportions of the adipose tissues of the UFP can be significantly decreased by aquatic aerobic exercise training (HFD+AE group). Therefore, it seems that doing aquatic aerobic exercise training is more likely to reduce the occurrence of metabolic diseases than is doing aquatic strength exercise training. Additional studies on aquatic exercise training interventions for obesity women are recommended in the future.
Acknowledgements
This work was supported by projects from the Lo-Hsu Medical Foundation Hospital (grant No. 10606), and MOST 109-2327-B-002-005. The authors thank Chien-Chao Chiu for conducting the histological examination. The authors are grateful to the graduate students at the Sport Nutrition Laboratory, National Taiwan Sport University, for their technical assistance in conducting the animal experiments.
Author Contributions
Yi-Ju Hsu and Mon-Chien Lee designed the experiments and carried out the laboratory experiments. Yi-Ju Hsu, Chun-Sheng Ho and Chi-Chang Huang contributed reagents, materials and analysis platforms. Yi-Ju Hsu and Chun-Sheng Ho analyzed the data. Yi-Ju Hsu and Chi-Chang Huang interpreted the results, prepared the figures, and wrote and revised the manuscript.
Competing Interests
The authors have declared that no competing interest exists.
References
1. Chen HL, Tung YT, Tsai CL, Lai CW, Lai ZL, Tsai HC, Chen CM. Kefir improves fatty liver syndrome by inhibiting the lipogenesis pathway in leptin-deficient ob/ob knockout mice. Int J Obes (Lond). 2014;38(9):1172-1179
2. Mozaffarian D, Hao T, Rimm EB, Willett WC, Hu FB. Changes in diet and lifestyle and long-term weight gain in women and men. N Engl J Med. 2011;364(25):2392-2404
3. Yang Q, Zhang Z, Gregg EW, Flanders WD, Merritt R, Hu FB. Added sugar intake and cardiovascular diseases mortality among US adults. JAMA Internal Medicine. 2014;174(4):516-524
4. Basu S, Yoffe P, Hills N, Lustig RH. The relationship of sugar to population-level diabetes prevalence: an econometric analysis of repeated cross-sectional data. PLoS One. 2013;8(2):e57873
5. Ouyang X, Cirillo P, Sautin Y, McCall S, Bruchette JL, Diehl AM, Abdelmalek MF. Fructose consumption as a risk factor for non-alcoholic fatty liver disease. J Hepatol. 2008;48(6):993-999
6. Danaei G, Finucane MM, Lu Y, Singh GM, Cowan MJ, Paciorek CJ, Lin JK, Farzadfar F, Khang YH, Stevens GA, Rao M, Ali MK, Riley LM, Robinson CA, Ezzati M; Global Burden of Metabolic Risk Factors of Chronic Diseases Collaborating Group (Blood Glucose). National, regional, and global trends in fasting plasma glucose and diabetes prevalence since 1980: systematic analysis of health examination surveys and epidemiological studies with 370 country-years and 2·7 million participants. Lancet. 2011;378(9785):31-40
7. Jang C, Hui S, Lu W, Cowan AJ, Morscher RJ, Lee G, Liu W, Tesz GJ, Birnbaum MJ, Rabinowitz JD. The Small Intestine Converts Dietary Fructose into Glucose and Organic Acids. Cell Metab. 2018;27(2):351-361
8. Hannou SA, Haslam DE, McKeown NM, Herman MA. Fructose metabolism and metabolic disease. J Clin Invest. 2018;128(2):545-555
9. Basciano H, Federico L, Adeli K. Fructose, insulin resistance, and metabolic dyslipidemia. Nutr Metab (Lond). 2005;2(1):5
10. Nseir W, Nassar F, Assy N. Soft drinks consumption and nonalcoholic fatty liver disease. World J Gastroenterol. 2010;16(21):2579-2588
11. Tappy L, Le KA. Metabolic effects of fructose and the worldwide increase in obesity. Physiol Rev. 2010;90(1):23-46
12. Lowette K, Roosen L, Tack J. Effects of high-fructose diets on central appetite signaling and cognitive function. Front Nutr. 2014;2:5-5
13. Stanhope KL, Schwarz JM, Keim N L. et al. Consuming fructose-sweetened, not glucose-sweetened, beverages increases visceral adiposity and lipids and decreases insulin sensitivity in overweight/obese humans. The Journal of Clinical Investigation. 2009;119(5):1322-1334
14. Bagul PK, Middela H, Matapally S, Padiya R, Bastia T, Madhusudana K, Reddy BR, Chakravarty S & Banerjee SK. Attenuation of insulin resistance, metabolic syndrome and hepatic oxidative stress by resveratrol in fructose-fed rats. Pharmacological Research. 2012;66(3):260-268
15. Panchal SK, Poudyal H & Brown L. Quercetin ameliorates cardiovascular, hepatic, and metabolic changes in diet-induced metabolic syndrome in rats. Journal of Nutrition. 2012;142:1026-1032
16. Swain DP, Franklin BA. Comparison of cardioprotective benefits of vigorous versus moderate intensity aquatic aerobic exercise training. Am J Cardiol. 2006;97(1):141-147
17. Donnelly JE, Blair SN, Jakicic JM, Manore MM, Rankin JW, Smith BK. American College of Sports Medicine Position Stand. Appropriate physical activity intervention strategies for weight loss and prevention of weight regain for adults. Med Sci Sports Exerc. 2009;41(2):459-471
18. Botezelli JD, Coope A, Ghezzi AC, Cambri LT, Moura LP, Scariot PP, Pauli JR. Strength Training Prevents Hyperinsulinemia, Insulin Resistance, and Inflammation Independent of Weight Loss in Fructose-Fed Animals. Sci Rep. 2016;6:31106
19. Chen YM, Lin CL, Wei L, Hsu YJ, Chen KN, Huang CC, Kao CH. Sake Protein Supplementation Affects Exercise Performance and Biochemical Profiles in Power-Exercise-Trained Mice. Nutrients. 2016;8(2):106
20. Wei L, Wen YT, Lee MC, Ho HM, Huang CC, Hsu YJ. Effects of isolated soy protein and strength exercise training on exercise performance and biochemical profile in postpartum mice. Metabolism. 2019;94:18-27
21. Schultz A, Mendonca LS, Aguila MB, Mandarim-de-Lacerda CA. Swimming training beneficial effects in a mice model of nonalcoholic fatty liver disease. Exp Toxicol Pathol. 2012;64(4):273-282
22. Folch J, Lees M, Stanley GS. A simple method for the isolation and purification of total lipides from animal tissues. J Biol Chem. 1957;226(1):497-509
23. Luo S, Monterosso JR, Sarpelleh K, Page KA. Differential effects of fructose versus glucose on brain and appetitive responses to food cues and decisions for food rewards. Proc Natl Acad Sci USA. 2015;112(20):6509-14
24. Livesey G, Taylor R. Fructose consumption and consequences for glycation, plasma triacylglycerol, and body weight: meta-analyses and meta-regression models of intervention studies. Am J Clin Nutr. 2008;88(5):1419-37
25. Shapiro A, Mu W, Roncal C, Cheng KY, Johnson RJ, Scarpace PJ. Fructose-induced leptin resistance exacerbates weight gain in response to subsequent high-fat feeding. Am J Physiol Regul Integr Comp Physiol. 2008;295(5):R1370-5
26. Huang BW, Chiang MT, Yao HT, Chiang W. The effect of high-fat and high-fructose diets on glucose tolerance and plasma lipid and leptin levels in rats. Diabetes Obes Metab. 2004;6(2):120-6
27. Astrup A, Raben A, Vasilaras TH, Moller AC. Sucrose in soft drinks is fattening: a randomized 10 week study in overweight subjects. American Journal of Clinical Nutrition. 2002;75(2):405S
28. Bremer AA, Auinger P, Byrd RS. Relationship between insulin resistance-associated metabolic parameters and anthropometric measurements with sugar-sweetened beverage intake and physical activity levels in US adolescents: findings from the 1999-2004 National Health and Nutrition Examination Survey. Arch Pediatr Adolesc Med. 2009;163(4):328-35
29. Goran MI, Dumke K, Bouret SG, Kayser B, Walker RW, Blumberg B. The obesogenic effect of high fructose exposure during early development. Nat Rev Endocrinol. 2013;9(8):494-500
30. Teff KL, Grudziak J, Townsend RR, Dunn TN, Grant RW, Adams SH, Keim NL, Cummings BP, Stanhope KL, Havel PJ. Endocrine and metabolic effects of consuming fructose- and glucose-sweetened beverages with meals in obese men and women: influence of insulin resistance on plasma triglyceride responses. J Clin Endocrinol Metab. 2009;94(5):1562-9
31. Chong MF, Fielding BA, Frayn KN. Mechanisms for the acute effect of fructose on postprandial lipemia. Am J Clin Nutr. 2007;85(6):1511-20
32. Durstine JL, Grandjean PW, Davis PG, Ferguson MA, Alderson NL, DuBose KD. Blood lipid and lipoprotein adaptations to exercise: a quantitative analysis. Sports Med. 2001;31(15):1033-62
33. Kelley GA, Kelley KS, Roberts S, Haskell W. Comparison of aquatic aerobic exercise training, diet or both on lipids and lipoproteins in adults: a meta-analysis of randomized controlled trials. Clin Nutr. 2012;31(2):156-67
34. Egli L, Lecoultre V, Theytaz F, Campos V, Hodson L, Schneiter P, Mittendorfer B, Patterson BW, Fielding BA, Gerber PA, Giusti V, Berneis K, Tappy L. Exercise prevents fructose-induced hypertriglyceridemia in healthy young subjects. Diabetes. 2013;62(7):2259-65
35. Pauli JR, Ropelle ER, Cintra DE, De Souza CT, da Silva AS, Moraes JC, Prada PO, de Almeida Leme JA, Luciano E, Velloso LA, Carvalheira JB, Saad MJ. Acute exercise reverses aged-induced impairments in insulin signaling in rodent skeletal muscle. Mech Ageing Dev. 2010;131(5):323-9
36. Oliveira NR, Marques SO, Luciano TF, Pauli JR, Moura LP, Caperuto E, Pieri BL, Engelmann J, Scaini G, Streck EL, Lira FS, Pinho RA, Ropelle ER, Silva AS, De Souza CT. Treadmill training increases SIRT-1 and PGC-1 α protein levels and AMPK phosphorylation in quadriceps of middle-aged rats in an intensity-dependent manner. Mediators Inflamm. 2014;2014:987017
37. Pereira RM, Botezelli JD, da Cruz Rodrigues KC, Mekary RA, Cintra DE, Pauli JR, da Silva ASR, Ropelle ER, de Moura LP. Fructose Consumption in the Development of Obesity and the Effects of Different Protocols of Physical Exercise on the Hepatic Metabolism. Nutrients. 2017;9(4):405
38. da Luz G, Frederico MJ, da Silva S, Vitto MF, Cesconetto PA, de Pinho RA, Pauli JR, Silva AS, Cintra DE, Ropelle ER, De Souza CT. Endurance exercise training ameliorates insulin resistance and reticulum stress in adipose and hepatic tissue in obese rats. Eur J Appl Physiol. 2011;111(9):2015-23
39. de Moura LP, Souza Pauli LS, Cintra DE, de Souza CT, da Silva ASR, Marinho R, de Melo MAR, Ropelle ER, Pauli JR. Acute exercise decreases PTP-1B protein level and improves insulin signaling in the liver of old rats. Immun Ageing. 2013;10(1):8
40. Eiffert KC, McDonald RB, Stern JS. High sucrose diet and exercise: effects on insulin-receptor function of 12- and 24-mo-old Sprague-Dawley rats. J Nutr. 1991;121(7):1081-9
41. Nagai Y, Yonemitsu S, Erion DM. et al. The role of peroxisome proliferator-activated receptor gamma coactivator-1 beta in the pathogenesis of fructose-induced insulin resistance. Cell Metab. 2009;9(3):252-264
42. OʼSullivan TA, Oddy WH, Bremner AP, Sherriff JL, Ayonrinde OT, Olynyk JK, Beilin LJ, Mori TA, Adams LA. Lower fructose intake may help protect against development of nonalcoholic fatty liver in adolescents with obesity. J Pediatr Gastroenterol Nutr. 2014;58(5):624-31
43. Green HJ, Fraser IG. Differential effects of exercise intensity on serum uric acid concentration. Med Sci Sports Exerc. 1988;20(1):55-9
44. Francis K, Hamrick ME. Exercise and uric Acid: implication in cardiovascular disease. J Orthop Sports Phys Ther. 1984;6(1):34-9
45. Park DY, Kim YS, Ryu SH, Jin YS. The association between sedentary behavior, physical activity and hyperuricemia. Vasc Health Risk Manag. 2019;15:291-299
46. Yuan H, Yu C, Li X, Sun L, Zhu X, Zhao C, Zhang Z, Yang Z. Serum Uric Acid Levels and Risk of Metabolic Syndrome: A Dose-Response Meta-Analysis of Prospective Studies. J Clin Endocrinol Metab. 2015;100(11):4198-207
Author contact
![]() Corresponding authors: Chi-Chang Huang, Graduate Institute of Sports Science, National Taiwan Sport University, Taoyuan 333325, Taiwan. E-mail: john5523edu.tw or d301090007com; Chun-Sheng Ho, Division of Physical Medicine and Rehabilitation, Lo-Hsu Medical Foundation, Inc., Lotung Poh-Ai Hospital, Yilan 26546, Taiwan. E-mail: 1061302edu.tw or cochonhocom.
Corresponding authors: Chi-Chang Huang, Graduate Institute of Sports Science, National Taiwan Sport University, Taoyuan 333325, Taiwan. E-mail: john5523edu.tw or d301090007com; Chun-Sheng Ho, Division of Physical Medicine and Rehabilitation, Lo-Hsu Medical Foundation, Inc., Lotung Poh-Ai Hospital, Yilan 26546, Taiwan. E-mail: 1061302edu.tw or cochonhocom.