Impact Factor ISSN: 1449-1907
- Issue 9; 2026
- Issue 8; 2026
- Issue 7; 2026
- Issue 6; 2026
- Issue 5; 2026
- Volume 23; 2026
- Past Issues
- Editorial Board
- Cover Images
- Index & Coverage
- Cover Suggestion
- Special Issues
Introduction
Patients and methods
Results
Discussion
Supplementary Material
Acknowledgements
References

 Global reach, higher impact
Int J Med Sci 2020; 17(15):2276-2284. doi:10.7150/ijms.46530 This issue Cite
Research Paper
Postoperative BMI Loss at One Year Correlated with Poor Outcomes in Chinese Gastric Cancer Patients
Nan Wang1#, Jinling Jiang1#, Wenqi Xi1, Junwei Wu1, Chenfei Zhou1, Min Shi1, Chao Wang1, Zhenggang Zhu1,2, Jing Liu1 ![]() , Jun Zhang1
, Jun Zhang1
1. Department of Oncology, Ruijin Hospital, Shanghai Jiao Tong University School of Medicine, No. 197 Ruijin er Road, Shanghai, 200025, China.
2. Shanghai Institute of Digestive Surgery, Ruijin Hospital, Shanghai Jiao Tong University School of Medicine, No. 197 Ruijin er Road, Shanghai, 200025, China.
# These authors contributed equally to this manuscript and should be considered co-first authors
Received 2020-3-31; Accepted 2020-8-16; Published 2020-8-25
Abstract
Purpose: The present study focused on the long-term prognostic value of dynamic body mass index (BMI) change in gastric cancer patients who underwent gastrectomy.
Methods: Clinical data from a total of 576 gastric cancer patients who underwent radical gastrectomy were collected. Univariate and multivariate analyses were performed to demonstrate the association between dynamic BMI variables (BMI before surgery, 1 month, 6 months or 12 months after surgery) and prognosis (DFS and OS). The correlation between BMI loss after surgery and survival outcomes was also evaluated.
Results: Post-operative BMI, especially BMI at one year after surgery (p<0.001), was an independent risk factor of recurrence and mortality, wherein patients with high-BMI (≥23) showed significantly better outcomes than patients with normal-BMI (18.5-23) (DFS, HR:0.49; 95% CI:0.31-0.78; OS, HR:0.30; 95% CI: 0.15-0.59). On the contrary, low-BMI (<18.5) patients presented with worse outcomes (DFS, HR: 1.34; 95% CI: 1.00-1.80; OS, HR: 1.68; 95% CI: 1.20-2.34). In addition, compared with moderate BMI loss (≤10%), severe postoperative BMI loss (>10%) at one year was independently associated with substantially worse prognosis for DFS (HR: 1.54; 95% CI: 1.15-2.08) and OS (HR: 1.45; 95% CI: 1.02-2.06). Subgroup analysis indicated that gender (p=0.03), extent of resection (p<0.001), tumor site (p=0.001) and perineural invasion (p=0.007) were associated with postoperative BMI loss at one year. The prognostic value of postoperative BMI loss at one year was consistent among most clinicopathological subgroups, except for tumor site (interaction p=0.025 for OS).
Conclusion: In Chinese gastric cancer patients who underwent gastrectomy, higher postoperative BMI (≥ 23) was significantly associated with longer survival time, whereas severe BMI loss (>10%) at one year after surgery was associated with worse outcomes. Thus, body weight maintenance after treatment is important, and dynamic monitoring of body weight and nutritional status should be emphasized in clinical practice.
Keywords: gastric cancer, body mass index, weight loss, prognosis
Introduction
Gastric cancer (GC) is a heavy disease burden in China, accounting for about 45% of stomach cancer-related deaths worldwide[1], and with a 5-year relative survival rate of 35.9% from 2010 to 2014[2]. Since gastric cancer is a highly heterogeneous disease, an improved understanding of risk factors associated with survival outcomes is quite important.
It has been reported that excess body weight accounted for approximately 3.9% of all cancers (544,300 cases)[3]. Obesity is an established risk factor for at least 17 different types of cancers, and portends less favorable outcomes in several cancers [4-6]. However, higher body mass index (BMI) is also associated with improved outcomes in some cancers, such as metastatic melanoma, colorectal cancer, and kidney cancer, etc.[7-9], a phenomenon called the “obesity paradox” which is in contrast to the traditional belief that higher BMI is associated with an increased risk of death in the general population.
In GC, it has been reported that increased BMI was positively correlated with the risk of cardia carcinoma[3, 10], however, the relationship between BMI and the risk of GC in other parts of the stomach is still unclear [11, 12]. Some studies showed that obesity was associated with diffuse-type adenocarcinoma and presented an increased risk of precancerous conditions in females, potentially due to chronic inflammation in adipose tissue[13]. In addition, the association between BMI and outcomes of GC patients is controversial. Most patients who underwent gastrectomy and chemotherapy suffer body weight loss due to decreased food intake and medication-induced adverse effects[14]. Several retrospective cohort studies showed that the survival outcomes of overweight GC patients were superior to those of underweight GC patients[15, 16], but some studies showed opposite results[17]. Most of the BMI data were measured at diagnosis, few studies have established the relationship between BMI dynamic changes upon therapy and long-term survival in GC patients, particularly in the Chinese population.
In the present study, we aimed to evaluate the relationship between BMI variation at four different time points (before surgery, 1 month, 6 months or 12 months after surgery) and survival outcomes of GC patients.
Patients and methods
Study design and cohort populations
This retrospective cohort study was conducted using data from Hospital Information System of Shanghai Ruijin Hospital from February 2010 to October 2017. We collected clinical data from patients with pStage I-III gastric adenocarcinoma who underwent curative gastrectomy (R0 resection) with standard lymphadenectomy (D2 dissection according to Japanese GC Treatment Guideline Version 5) and consecutive adjuvant chemotherapy. Patients with distant metastasis at diagnosis of GC, undergoing neoadjuvant chemotherapy or radiotherapy, not received or not completed adjuvant chemotherapy after operation, undergoing R1 or R2 resection, or patients who died from surgery complications were excluded. Patients with missing preoperative or one-month postoperative BMI data, or missing survival data (n=16) were also excluded. Finally, a total of 576 cases were included in the cohort of Pre BMI (measured 3-5 days before surgery) and Post_1m BMI (measured 4 weeks ±1 week after surgery). A total of 548 cases were included in the cohort of Post_6m BMI (measured 6 months±2 weeks after surgery), 443 cases in the cohort of Post_12m BMI (measured 12 months±2 weeks after surgery). Among them, 19 patients died within one year after surgery, 28 cases of Post_6m BMI data and 86 cases of Post_12m BMI data were missing.
Definition of variables and Data collection
Clinical variables and Outcome assessment
Information was available for all patients on gender, age at diagnosis (≤60; >60), extent of resection (total gastrectomy; subtotal gastrectomy), tumor site (cardia/fundus; body/angulus; antrum/pylorus), pathological tumor type (adenocarcinoma including papillary or tubular adenocarcinoma; mucinous adenocarcinoma or signet-ring cell carcinoma), differentiation degree of tumor (G1/G2; G3), tumor size (maximum diameter of tumor≤2 cm; >2 cm and ≤5 cm; >5 cm), pTNM stage according to the American Joint Committee on Cancer 8th edition, lymphovascular/perineural invasion (yes; no), adjuvant chemotherapy (mono-chemotherapy; combinational chemotherapy). After surgery, follow-up consisted of blood tests, physical examinations and imaging examinations (chest, abdomen and pelvic CT or MRI scan with contrast) every 3 months in the first year, every 6 months in the second year, then annually from 3 to 5 years; Endoscopy was performed annually. Data on overall survival (OS) was obtained from telephone interviews or Shanghai Center for Disease Control and Prevention. OS was calculated from the date of operation until the date of death from any cause. Disease free survival (DFS) was calculated from operation to first observation of disease recurrence through clinical and imaging examinations or death due to any cause. The survival and recurrence status of the patients was last updated in October 2018.
Body mass index
Height and weight of patients were measured by trained nurses at each medical visit. BMI was computed in kilograms per height in meter squared. Post_1m/ Post_6m/ Post_12m BMI loss (%) was defined as (Pre-BMI minus Post_1m/ Post_6m/ Post_12m BMI) divided by Pre-BMI.
Due to the large difference in BMI between eastern and western patients, we categorized BMI using Asian-specific criteria[18]as follows: underweight, BMI <18.5; normal weight, BMI 18.5 to <23.0; overweight, BMI 23.0 to <25.0; and obese, BMI ≥25.0. Because there were only 25 (5.6%) cases with BMI > 25.0 in the cohort of Post_12m BMI, we incorporated them into the group of BMI ≥ 23.0. So the patients in our cohorts were assigned into low-BMI group (<18.5), normal-BMI group (18.5 to<23.0) and high-BMI group (≥23.0).
Optimal cutoff values for BMI loss variables were calculated by maximally selected rank statistics[19]using the 'maxstat' package in R Programming Language. For DFS and OS at three time points, they were 11%, 11%, 10%, 7%, 13% and 15%, respectively. BMI loss of 10% is considered clinical meaningful for use, so we chose 10% as the universal cutoff value to classify BMI loss into two categories: ≤10% (moderate loss) and >10% (severe loss).
Statistical analysis
Socio-demographic and clinicopathologic data were summarized using descriptive statistics. Survival curves for DFS and OS across BMI categories were generated using the Kaplan-Meier method with log-rank tests. To evaluate the effect of BMI and other variables on prognosis, univariate and multivariate analyses were performed using Cox's proportional hazards model. The variables with a p-value of 0.05 or less in univariate analysis were pooled in the multivariate analysis. Chi-square test or Fisher's exact test was used to test the association between categorical variables. Subgroup analyses were done using Cox's proportional hazards model, and the interaction test was also conducted. Patients who did not reach a specific endpoint were censored at time of last follow-up. All statistical procedures were performed using SPSS version 24.0 and R language version 3.6.1. A p-value of less than 0.05 was considered to be statistically significant.
Results
Patients' baseline and BMI characteristics
Of the 576 GC patients, 274 (47.6%) relapsed and 210 (36.5%) died, with a median follow-up of 49.2 months (range: 9.8-109.9). The median age at diagnosis of GC was 59 years old (range: 19~85). The baseline characteristics are depicted in Table 1. The distributions of BMI at four time points and three BMI change variables are shown in Table 2. Median Pre-BMI was 22.9 kg/m2 (range: 14.9~33.7). Median Post_1m BMI was 20.8 kg/m2 (range: 13.2~30.1). Median Post_1m BMI loss was 9.1% (range: -32.7%~32.0%), in which 233 (40.5%) patients had severe BMI loss. Median Post_6m BMI was 20.2 kg/m2 (range: 13.7~32.1). Median Post_6m BMI loss was 12.0% (range: -20.0%~41.6%), and 325 (59.3%) patients had severe BMI loss. Median Post_12m BMI was 20.2 kg/m2 (range: 13.6~29.4). Median Post_12m BMI loss was 11.9% (range: -22.6%~44.6%), and 256 (57.8%) patients had severe BMI loss.
Baseline characteristics and univariate analysis of DFS and OS (N=576)
| Patients characteristics | N (%) | DFS | OS | ||
|---|---|---|---|---|---|
| HR (95%CI) | p value | HR (95%CI) | p value | ||
| Gender | 0.319 | 0.198 | |||
| Male | 400(69.4) | 1 | 1 | ||
| female | 176(30.6) | 0.88(0.68-1.14) | 0.82(0.61-1.11) | ||
| Age at diagnosis yr. | 0.063 | 0.023 | |||
| ≤ 60 | 321(55.7) | 1 | 1 | ||
| > 60 | 255(44.3) | 1.25(0.99-1.59) | 1.37(1.04-1.80) | ||
| Extent of resection | <0.001 | <0.001 | |||
| Total gastrectomy | 204(35.4) | 1 | 1 | ||
| Subtotal gastrectomy | 372(64.6) | 0.60(0.48-0.77) | 0.52(0.40-0.69) | ||
| Tumor site | 0.538 | 0.762 | |||
| Cardia/fundus | 99(17.2) | 1 | 1 | ||
| Body/angulus | 203(35.2) | 1.05(0.74-1.47) | 0.99(0.66-1.48) | ||
| Antrum/pylorus | 274(47.6) | 0.90(0.65-1.26) | 0.89(0.61-1.32) | ||
| Pathological tumor type | 0.811 | 0.408 | |||
| Adenocarcinoma a | 502(87.2) | 1 | 1 | ||
| Mucinous adenocarcinoma or signet-ring cell carcinoma | 74(12.8) | 0.96(0.67-1.37) | 1.18(0.80-1.73) | ||
| Differentiation degree | 0.115 | 0.033 | |||
| G1/G2 | 207(35.9) | 1 | 1 | ||
| G3 | 369(64.1) | 1.22(0.95-1.57) | 1.37(1.02-1.84) | ||
| Tumor size(cm)b | <0.001 | <0.001 | |||
| ≤2 | 89(15.5) | 1 | 1 | ||
| >2 and ≤5 | 342(59.4) | 2.09(1.36-3.20) | 2.37(1.41-3.99) | ||
| >5 | 145(25.2) | 2.74(1.74-4.31) | 3.36(1.95-5.81) | ||
| pT stage | <0.001 | <0.001 | |||
| T1-3 | 187(32.5) | 1 | 1 | ||
| T4 | 389(67.5) | 1.86(1.40-2.47) | 2.40(1.70-3.39) | ||
| pN stage | <0.001 | <0.001 | |||
| N0-2 | 335(58.2) | 1 | 1 | ||
| N3 | 241(41.8) | 2.88(2.26-3.67) | 3.13(2.36-4.13) | ||
| pTNM stage | <0.001 | <0.001 | |||
| I-II | 177(30.7) | 1 | 1 | ||
| III | 399(69.3) | 2.25(1.67-3.02) | 3.12(2.14-4.54) | ||
| Lymphovascular invasion | <0.001 | <0.001 | |||
| Yes | 213(37) | 1 | 1 | ||
| No | 363(63) | 0.53(0.42-0.68) | 0.54(0.41-0.71) | ||
| Perineural invasion | <0.001 | <0.001 | |||
| Yes | 255(44.3) | 1 | 1 | ||
| No | 321(55.7) | 0.55(0.43-0.69) | 0.52(0.40-0.69) | ||
| Adjuvant chemotherapy | 0.520 | 0.477 | |||
| Mono-chemotherapy | 67(11.6) | 1 | 1 | ||
| Combinational chemotherapy | 509(88.4) | 0.89(0.62-1.28) | 0.86(0.57-1.30) | ||
a including papillary or tubular adenocarcinoma; b maximum diameter of tumor
DFS: disease free survival; OS: overall survival; HR: hazard ratio; 95% CI: 95% confidence interval; BMI: body mass index
Univariate analysis of BMI variables for DFS and OS
| BMI variables | N (%) | DFS | OS | ||
|---|---|---|---|---|---|
| HR (95%CI) | p value | HR (95%CI) | p value | ||
| Pre BMI (kg/m2) | N=576 | 0.128 | 0.023 | ||
| <18.5 | 35(6.1) | 1.13(0.71-1.80) | 1.12(0.66-1.90) | ||
| 18.5 to <23.0 | 258(44.8) | 1 | 1 | ||
| ≥23 | 283(49.1) | 0.78(0.63 -1.02) | 0.70(0.52-0.92) | ||
| Post_1m BMI (kg/m2) | N=576 | <0.001 | <0.001 | ||
| <18.5 | 114(19.8) | 1.25(0.94-1.66) | 1.29(0.94-1.78) | ||
| 18.5 to <23.0 | 334(58) | 1 | 1 | ||
| ≥23 | 128(22.2) | 0.49(0.35-0.71) | 0.42(0.27-0.66) | ||
| Post_1m BMI loss (%) | N=576 | 0.003 | 0.053 | ||
| ≤10% | 343(59.5) | 1 | 1 | ||
| >10% | 233(40.5) | 1.43(1.13-1.81) | 1.33(1.00-1.74) | ||
| Post_6m BMI (kg/m2) | N=548 | <0.001 | <0.001 | ||
| <18.5 | 160(29.2) | 1.18(0.91-1.54) | 1.24(0.92-1.67) | ||
| 18.5 to <23.0 | 294(53.6) | 1 | 1 | ||
| ≥23 | 94(17.2) | 0.46(0.29-0.70) | 0.38(0.22-0.65) | ||
| Post_6m BMI loss (%) | N=548 | 0.013 | 0.108 | ||
| ≤10% | 223(40.7) | 1 | 1 | ||
| >10% | 325(59.3) | 1.38(1.07-1.77) | 1.27(0.95-1.69) | ||
| Post_12m BMI (kg/m2) | N=443 | <0.001 | <0.001 | ||
| <18.5 | 130(29.3) | 1.75(1.32-2.32) | 2.09(1.52-2.88) | ||
| 18.5 to <23.0 | 238(53.7) | 1 | 1 | ||
| ≥23 | 75(16.9) | 0.57(0.35-0.88) | 0.36 (0.18-0.69) | ||
| Post_12m BMI loss (%) | N=443 | <0.001 | <0.001 | ||
| ≤10% | 187(42.2) | 1 | 1 | ||
| >10% | 256(57.8) | 1.79(1.35-2.38) | 1.94(1.39-2.70) | ||
Pre BMI: measured before surgery; Post_1m BMI: measured 4 weeks ±1 week after surgery; Post_6m BMI: measured 6 months±2 weeks after surgery; Post_12m BMI: measured 12 months±2 weeks after surgery; DFS: disease free survival; OS: overall survival; HR: hazard ratio; 95% CI: 95% confidence interval; BMI: body mass index
Correlation between BMI variables and DFS & OS
In univariate analysis, extent of resection, tumor size, pT-stage, pN-stage, pTNM-stage, lymphovascular/perineural invasion and all BMI variables except Pre-BMI were associated with DFS. Age at diagnosis, extent of resection, differentiation degree, tumor size, pT-stage, pN-stage, pTNM-Stage, lymphovascular/perineural invasion and all BMI variables except Post_1m/Post_6m BMI loss were associated with OS. Especially for Post_12m BMI, compared with normal-BMI group (≥18.5 and <23), low-BMI group (BMI <18.5) showed significantly worse outcomes (DFS, HR: 1.75; 95% CI: 1.32-2.32; OS, HR: 2.09; 95% CI: 1.52-2.88), and high-BMI (≥23) showed significantly better outcomes (DFS, HR: 0.57; 95% CI: 0.35-0.88; OS, HR: 0.36; 95% CI: 0.18-0.69). Relative to moderate Post_12m BMI loss (≤10%), severe Post_12m BMI loss (>10%) showed worse survival outcomes (DFS, HR: 1.79; 95% CI: 1.35-2.38; OS, HR: 1.94, 95% CI: 1.39-2.70) (Table 2).
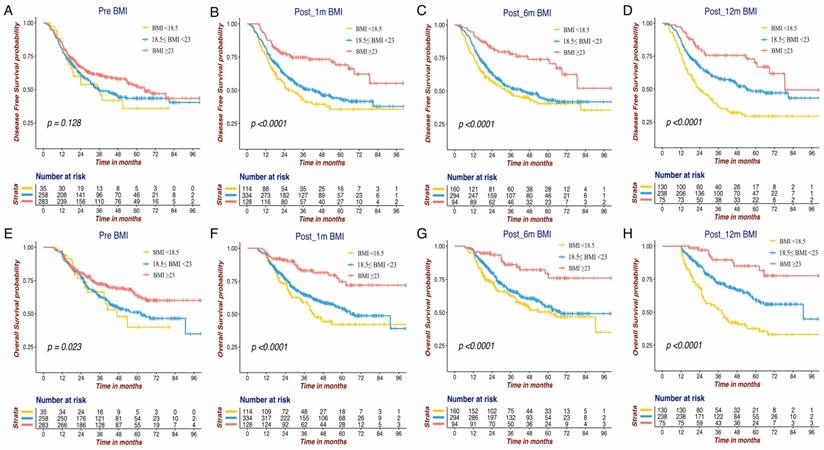
The Kaplan-Meier survival curves of DFS and OS for the BMI variables are presented in Figure 1 and Figure 2. BMI at four time points were all significantly associated with OS. Except for Pre-BMI (p=0.128), the other three BMI variables were significantly associated with DFS. As shown in Figures 1 and 2, the gap between three BMI group curves became more significant over time. BMI loss variables were all significantly associated with DFS, whereas only Post_12m BMI loss was correlated with OS (p=0.0001). Median DFS/OS, 1-year/3-year DFS rate and 3-year/5-year OS rate in different BMI cohorts are listed in Table S1. Briefly, the 3-year DFS and 5-year OS in patients with high-BMI were significantly higher than those with low-BMI, particularly for Post_12m BMI (73.9% vs. 35.9%, 81.6% vs. 35.6%). The outcomes of patients with moderate Post_12m BMI loss were much better than those with severe BMI loss (64.6% vs.45.8%, 65.4% vs.48.5%).
The Kaplan-Meier survival curves of DFS and OS for BMI variables at four different time points in GC patients. DFS of Pre BMI (A), Post_1m BMI (B), Post_6m BMI (C) and Post_12m BMI (D); OS of Pre BMI (E), Post_1m BMI (F), Post_6m BMI (G) and Post_12m BMI (H). DFS: disease free survival; OS: overall survival; BMI: body mass index; GC: gastric cancer.
The Kaplan-Meier survival curves of DFS and OS for three BMI change variables in GC patients. DFS of Post_1m BMI loss (A), Post_6m BMI loss (B) and Post_12m BMI loss (C); OS of Post_1m BMI loss (D), Post_6m BMI loss (E) and Post_12m BMI loss (F). DFS: disease free survival; OS: overall survival; BMI: body mass index; GC: gastric cancer.
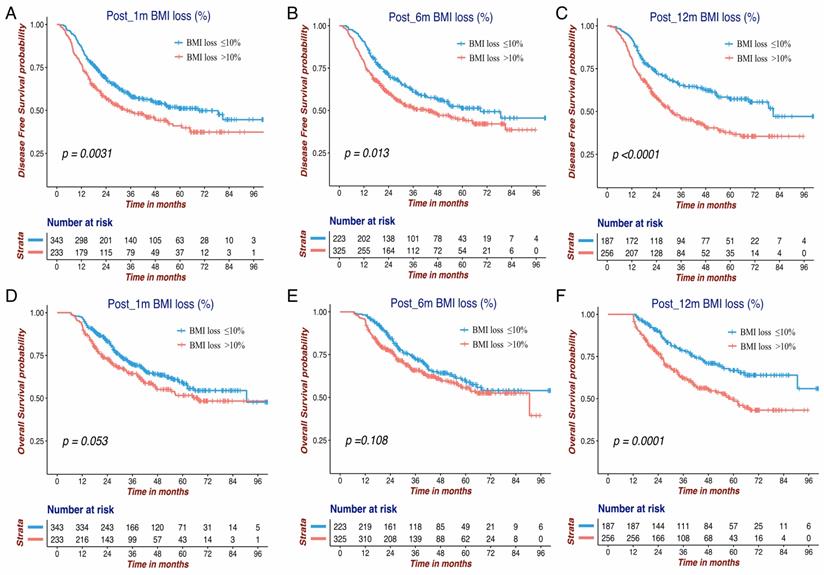
Table 3 shows the multivariate analysis of DFS and OS in the Post_12m cohort, and the analyses of the other three cohorts are shown in Table S2. In the Post_12m cohort, low-BMI patients (HR:1.34; 95%CI:1.00-1.80), high-BMI patients (HR:0.49; 95% CI:0.31-0.78), severe Post_12m BMI loss (HR:1.54; 95% CI:1.15-2.08), pT-stage (T4, HR:1.47; 95%CI:1.03-2.08), pN-stage (N3, HR:2.23; 95%CI:1.65-3.01), and perineural invasion (No, HR:0.67; 95%CI, 0.50-0.89) were independent prognostic factors for DFS. Similarly, Post_12m low-BMI (HR:1.68; 95%CI:1.20-2.34), post_12m high-BMI (HR:0.30; 95%CI:0.15-0.59), severe Post_12m BMI loss (HR:1.45; 95%CI:1.02-2.06), pT-stage(T4, HR:1.85; 95%CI: 1.20-2.85), pN-stage (N3, HR:2.52; 95%CI: 1.78-3.56), perineural invasion (No, HR:0.68; 95%CI: 0.48-0.95) and age at diagnosis(>60, HR:1.47; 95%CI: 1.07-2.01) were independent prognostic factors for OS. Post_12m BMI loss was an independent poor risk factor for both DFS and OS, while Post_1m and Post_6m BMI loss showed no significant correlations with outcomes.
Multivariate analysis of DFS and OS in the cohort of Post_12m BMI
| Variables | DFS | OS | ||
|---|---|---|---|---|
| HR (95%CI) | p value | HR (95%CI) | p value | |
| Post_12m BMI (kg/m2) | <0.001 | <0.001 | ||
| < 18.5 | 1.34(1.00-1.80) | 1.68(1.20-2.34) | ||
| 18.5 to <23.0 | 1 | 1 | ||
| ≥ 23 | 0.49(0.31-0.78) | 0.30(0.15-0.59) | ||
| Post_12m BMI loss (%) | 0.004 | 0.039 | ||
| ≤ 10% | 1 | 1 | ||
| > 10% | 1.54(1.15-2.08) | 1.45(1.02-2.06) | ||
| pT stage | 0.032 | 0.005 | ||
| T1-3 | 1 | 1 | ||
| T4 | 1.47(1.03-2.08) | 1.85(1.20-2.85) | ||
| pN stage | <0.001 | <0.001 | ||
| N0-2 | 1 | 1 | ||
| N3 | 2.23(1.65-3.01) | 2.52(1.78-3.56) | ||
| Differentiation degree | NI | 0.644 | ||
| G1/G2 | 1 | |||
| G3 | 0.92(0.66-1.30) | |||
| Lymphovascular invasion | 0.201 | 0.625 | ||
| Yes | 1 | 1 | ||
| No | 0.83(0.62-1.11) | 0.92(0.65-1.30) | ||
| Perineural invasion | 0.006 | 0.024 | ||
| Yes | 1 | 1 | ||
| No | 0.67(0.50-0.89) | 0.68(0.48-0.95) | ||
| Age at diagnosis yr. | NI | 0.016 | ||
| ≤ 60 | 1 | |||
| > 60 | 1.47(1.07-2.01) | |||
Post_12m BMI: measured 12 months±2 weeks after surgery; Pre BMI: measured before surgery; DFS: disease free survival; OS: overall survival; HR: hazard ratio; 95% CI: 95% confidence interval; BMI: body mass index; NI: not include
Association between clinical characteristics and BMI variables
As shown in Table 4, Pre BMI, Post_12m BMI and Post_12m BMI loss significantly differed between male and female patients. Post_12m BMI was associated with extent of resection (p=0.024), tumor site (p=0.036) and pN stage (p=0.021). Extent of resection (p<0.001), tumor site (p=0.001) and perineural invasion(p=0.007) were also associated with Post_12m BMI loss.
Association between clinical characteristics and Pre BMI, Post_12m BMI, Post_12m BMI loss
| Clinical characteristics | Pre BMI(n=576) | p value | Post_12m BMI(n=443) | p value | Post_12m BMI loss (n=443) | p value | |||||
|---|---|---|---|---|---|---|---|---|---|---|---|
| <18.5 | 18.5 to <23.0 | ≥23 | <18.5 | 18.5 to <23.0 | ≥23 | ≤10% | >10% | ||||
| Gender | <0.001 | <0.001 | 0.030 | ||||||||
| Male | 17(4.3%) | 163(40.8%) | 220(55%) | 69(22.5%) | 181(59%) | 57(18.6%) | 140(45.6%) | 167(54.4%) | |||
| female | 18(10.2%) | 95(54%) | 63(35.8%) | 61(44.9%) | 57(41.9%) | 18(13.2%) | 47(34.6%) | 89(65.4%) | |||
| Age at diagnosis yr. | 0.280 | 0.811 | 0.768 | ||||||||
| ≤ 60 | 23(7.2%) | 148(46.1%) | 150(46.7%) | 75(29.2%) | 136(52.9%) | 46(17.9%) | 110(42.8%) | 147(57.2%) | |||
| > 60 | 12(4.7%) | 110(43.1%) | 133(52.2%) | 55(29.6%) | 102(54.8%) | 29(15.6%) | 77(41.4%) | 109(58.6%) | |||
| Extent of resection | 0.067 | 0.024 | <0.001 | ||||||||
| Total gastrectomy | 16(7.8%) | 79(38.7%) | 109(53.4%) | 55(36.4%) | 78(51.7%) | 18(11.9%) | 46(30.5%) | 105(69.5%) | |||
| Subtotal gastrectomy | 19(5.1%) | 179(48.1%) | 174(46.8%) | 75(25.7%) | 160(54.8%) | 57(19.5%) | 141(48.3%) | 151(51.7%) | |||
| Tumor site | 0.412 | 0.036 | 0.001 | ||||||||
| Cardia/fundus | 7(7.1%) | 39(39.4%) | 53(53.5%) | 25(34.7%) | 41(56.9%) | 6(8.3%) | 18(25%) | 54(75%) | |||
| Body/angulus | 16(7.9%) | 91(44.8%) | 96(47.3%) | 50(32.3%) | 84(54.2%) | 21(13.5%) | 63(40.6%) | 92(59.4%) | |||
| Antrum/pylorus | 12(4.4%) | 128(46.7%) | 134(48.9%) | 55(25.5%) | 113(52.3%) | 48(22.2%) | 106(49.1%) | 110(50.9%) | |||
| Pathological tumor type | 0.727 | 0.882 | 0.185 | ||||||||
| Adenocarcinoma a | 32(6.4%) | 222(44.2%) | 248(49.4%) | 112(29.3%) | 204(53.4%) | 66(17.3%) | 166(43.5%) | 216(56.5%) | |||
| Mucinous adenocarcinoma or signet-ring cell carcinoma | 3(4.1%) | 36(48.6%) | 35(47.3%) | 18(29.5%) | 34(55.7%) | 9(14.8%) | 21(34.4%) | 40(65.6%) | |||
| Differentiation degree | 0.818 | 0.065 | 0.313 | ||||||||
| G1/G2 | 14(6.8%) | 90(43.5%) | 103(49.8%) | 38(24.7%) | 82(53.2%) | 34(22.1%) | 70(45.5%) | 84(54.5%) | |||
| G3 | 21(5.7%) | 168(45.5%) | 180(48.8%) | 92(31.8%) | 156(54%) | 41(14.2%) | 117(40.5%) | 172(59.5%) | |||
| Tumor size(cm) b | 0.444 | 0.986 | 0.877 | ||||||||
| ≤2 | 6(6.7%) | 42(47.2%) | 41(46.1%) | 21(30.4%) | 35(50.7%) | 13(18.8%) | 29(42%) | 40(58%) | |||
| >2 and ≤5 | 17(5%) | 159(46.5%) | 166(48.5%) | 78(29.2%) | 145(54.3%) | 44(16.5%) | 115(43.1%) | 152(56.9%) | |||
| >5 | 12(8.3%) | 57(39.3%) | 76(52.4%) | 31(29%) | 58(54.2%) | 18(16.8%) | 43(40.2%) | 64(59.8%) | |||
| pT stage | 0.542 | 0.168 | 0.454 | ||||||||
| T1-3 | 13(7%) | 88(47.1%) | 86(46%) | 37(25.9%) | 86(60.1%) | 20(14%) | 64(44.8%) | 79(55.2%) | |||
| T4 | 22(5.7%) | 170(43.7%) | 197(50.6%) | 93(31%) | 152(50.7%) | 55(18.3%) | 123(41.3%) | 177(59%) | |||
| pN stage | 0.550 | 0.021 | 0.778 | ||||||||
| N0-2 | 20(6%) | 144(43%) | 171(51%) | 67(25.4%) | 156(59.1%) | 41(15.5%) | 110(41.7%) | 154(58.3%) | |||
| N3 | 15(6.2%) | 114(47.3%) | 112(46.5%) | 63(35.2%) | 82(45.8%) | 34(19%) | 77(43.0%) | 102(57.0%) | |||
| pTNM stage | 0.660 | 0.163 | 0.587 | ||||||||
| I-II | 10(5.6%) | 75(42.4%) | 92(52%) | 35(24.5%) | 86(60.1%) | 22(15.4%) | 63(44.1%) | 80(55.9%) | |||
| III | 25(6.3%) | 183(45.9%) | 191(47.9%) | 95(31.7%) | 152(50.7%) | 53(17.7%) | 124(41.3%) | 176(58.7%) | |||
| Lymphovascular invasion | 0.878 | 0.846 | 0.134 | ||||||||
| Yes | 14(6.6%) | 93(43.7%) | 106(49.8%) | 48(31%) | 82(52.9%) | 25(16.1%) | 58(37.4%) | 97(62.6%) | |||
| No | 21(5.8%) | 165(45.5%) | 177(48.8%) | 82(28.5%) | 156(54.2%) | 50(17.4%) | 129(44.8%) | 159(55.2%) | |||
| Perineural invasion | 0.900 | 0.440 | 0.007 | ||||||||
| Yes | 15(5.9%) | 112(43.9%) | 128(50.2%) | 63(32.5%) | 100(51.5%) | 31(16%) | 68(35.1%) | 126(64.9%) | |||
| No | 20(6.2%) | 146(45.5%) | 155(48.3%) | 67(26.9%) | 138(55.4%) | 44(17.7%) | 119(47.8%) | 130(52.2%) | |||
| Adjuvant Chemotherapy | 0.659 | 0.767 | 0.737 | ||||||||
| Mono-chemotherapy | 5(7.5%) | 27(40.3%) | 35(52.2%) | 13(26%) | 27(54%) | 10(20%) | 20(40%) | 30(60%) | |||
| Combinational chemotherapy | 30(5.9%) | 231(45.4%) | 248(48.7%) | 117(29.8%) | 211(53.7%) | 65(16.5%) | 167(42.5%) | 226(57.5%) | |||
a including papillary or tubular adenocarcinoma; b maximum diameter of tumor
Pre BMI: measured before surgery; Post_12m BMI: measured 12 months±2 weeks after surgery; BMI: body mass index
Prognostic value of Post_12m BMI loss in clinicopathological subgroups
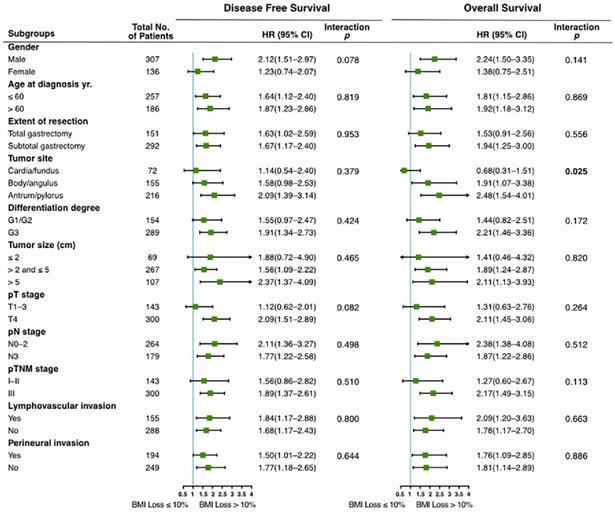
Subgroup analyses were performed to investigate the consistency of the prognostic value of Post_12m BMI loss in patients with different clinicopathological characteristics. As shown in Figure 3, severe BMI loss was associated with worse prognosis than moderate loss in the majority of subgroups. There was no interaction between Post_12m BMI loss and any of clinicopathological factors, except for tumor site (interaction p=0.025 for OS). The effect of Post_12m BMI loss on OS in patients with gastric fundus/cardia carcinoma is uncertain and needs to be further explored.
Prognostic value of Post_12m BMI loss in clinicopathological subgroups (severe loss (>10%) vs. moderate loss (≤10%)). BMI: body mass index; HR: hazard ratio; 95% CI: 95% confidence interval.
Discussion
The results of the present study indicated that post-operative BMI variables were independent risks of GC recurrence and mortality. Compared with a relatively stable BMI, severe Post_12m BMI loss (>10%) was independently associated with worse prognosis for DFS and OS, while BMI loss within six months after surgery showed no significant association with survival. The prognostic value of Post_12m BMI loss was consistent among the majority of clinicopathological subgroups. These data indicate that short-term weight loss after surgery may not affect survival, but long-term maintenance of body weight is more significant. We also found that the time point of 12 months after surgery is more valuable for body weight evaluation, which avoids the influence of surgery or adjuvant chemotherapy on BMI and represents patients' stable long-term nutritional status.
Studies on BMI and GC survival differ in terms of BMI assessment, adjustment, inclusion and exclusion criteria. Some studies indicated that overweight and obesity at diagnosis were adverse prognostic characteristics as too much abdominal fat led to unsuccessful and incomplete lymph node dissection [20-22]. In addition, a higher BMI was associated with longer duration of operation and increasing risk of postoperative complications [23]. The presence of comorbid diseases associated with being overweight may also predict poor survival. Chen et al. [15] reported that GC patients with high-BMI exhibited a significantly prolonged OS compared with underweight patients, which was consistent with our research. The author explained that tumor stage was an important factor, since the percentage of advanced cancers was doubled in low-BMI patients compared to high-BMI patients [15]. In our study, all enrolled patients underwent gastrectomy (R0 resection) with standard lymphadenectomy (D2), and patients who died from surgical complications were excluded. BMI distribution between stages was well balanced. Furthermore, we found that severe BMI loss (>10%) at one year after surgery was an independent risk factor for both OS and DFS, which was similar to previous reports that postoperative severe BMI loss (>4.5) (HR, 1.79; 95% CI, 1.29-2.50) was associated with higher mortality[16], and body weight loss ≥15% at 1 month after gastrectomy might lead to poor survival[24]. Compared to previous research that was limited to either one certain time point after gastrectomy or an uncertain wide time range, our study focused on 4 precise time points (pre, post_1m, post_6m, post_12m) and emphasized the importance of BMI dynamic monitoring. We also pointed out the most important time point was 12 months after surgery. These results were rarely mentioned in previous studies.
There are several potential interpretations for our results. First, due to characteristics of GC and Chinese physique, few patients were excessively obese, which could reduce some confounding factors like operation difficulty. Second, patients with higher BMI had decreased treatment-related toxicity and increased response to anti-cancer therapy [25, 26]. Meyerhardt's study showed that overweight patients had a lower rate of Grade 3-4 leukopenia and any toxicity ≥Grade 3, and could tolerate actual weight-based doses of chemotherapy [26], while underweight patients often displayed higher rate of withdrawal or reduction of chemotherapy [27]. Furthermore, overweight or obesity and a stable BMI status might function as protective factors from malnutrition, cancer cachexia, or altered immune functions, which greatly influence the prognosis of cancer patients [28, 29]. Wang et al. demonstrated that obesity increased T cell aging which resulted in higher PD-1 expression and dysfunction driven by leptin signaling [30], which provided an explanation for a recent report that obese patients with melanoma showed improved outcomes with immunotherapy [7].
A novel aspect of our study included the assessment of longitudinal BMI and dynamic BMI changes at four different time points, which has rarely been investigated before, particularly in the Chinese population. We demonstrated that one year after surgery is the most valuable time point for BMI evaluation. As an easily available clinical parameter, BMI before and after surgery could add additional prognostic information for GC patients.
Our analysis still has some limitations. As a single-center retrospective study, it is difficult to avoid confounding factors and bias. Besides, though BMI is a widely used parameter for obesity, it is an imperfect surrogate of adiposity and may misclassify body composition. Li et al reported that visceral and subcutaneous fat might be new independent predictive factors of survival in locally advanced gastric carcinoma patients [31]. Finally, our research only indicates a correlation between postoperative BMI and prognosis, but cannot prove there is a causal relationship between them.
In conclusion, our data suggest that in GC patients, higher BMI (>23) is associated with improved survival, whereas remarkable BMI loss (>10%) is significantly correlated with worse prognosis, particularly at one year after surgery. Monitoring body weight loss as a prognostic factor after treatment should be emphasized during follow up. Since our study is retrospective and exploratory, the results need to be further validated in a multi-center prospective study.
Supplementary Material
Supplementary tables.
Acknowledgements
The study was supported by National Science Foundation of China (81672327, 81502013, 81802319 and 81602411), Program of Shanghai Academic/Technology Research Leader (17XD1402600), Program for Outstanding Medical Academic Leader and Shanghai Municipal Education Commission—Gaofeng Clinical Medicine Grant Support (20161410), Development Grant for Clinical Trial (SHDC12017X06) and Doctoral Innovation Fund Projects from Shanghai Jiaotong University School of Medicine (BXJ201915).
Competing Interests
The authors have declared that no competing interest exists.
References
1. Allemani C, Matsuda T, Di Carlo V. et al. Global surveillance of trends in cancer survival 2000-14 (CONCORD-3): analysis of individual records for 37 513 025 patients diagnosed with one of 18 cancers from 322 population-based registries in 71 countries. Lancet. 2018;391:1023-75
2. Yang L, Zheng R, Wang N. et al. Incidence and mortality of stomach cancer in China, 2014. Chin J Cancer Res. 2018;30:291-8
3. Sung H, Siegel RL, Torre LA. et al. Global patterns in excess body weight and the associated cancer burden. CA Cancer J Clin. 2019;69:88-112
4. Jiralerspong S, Goodwin PJ. Obesity and Breast Cancer Prognosis: Evidence, Challenges, and Opportunities. J Clin Oncol. 2016;34:4203-16
5. Chan DS, Vieira AR, Aune D. et al. Body mass index and survival in women with breast cancer-systematic literature review and meta-analysis of 82 follow-up studies. Ann Oncol. 2014;25:1901-14
6. Fedele P, Orlando L, Schiavone P. et al. BMI variation increases recurrence risk in women with early-stage breast cancer. Future Oncol. 2014;10:2459-68
7. McQuade JL, Daniel CR, Hess KR. et al. Association of body-mass index and outcomes in patients with metastatic melanoma treated with targeted therapy, immunotherapy, or chemotherapy: a retrospective, multicohort analysis. The Lancet Oncology. 2018;19:310-22
8. Kroenke CH, Neugebauer R, Meyerhardt J. et al. Analysis of Body Mass Index and Mortality in Patients With Colorectal Cancer Using Causal Diagrams. JAMA Oncol. 2016;2:1137-45
9. Hakimi AA, Furberg H, Zabor EC. et al. An epidemiologic and genomic investigation into the obesity paradox in renal cell carcinoma. J Natl Cancer Inst. 2013;105:1862-70
10. Turati F, Tramacere I, La Vecchia C. et al. A meta-analysis of body mass index and esophageal and gastric cardia adenocarcinoma. Ann Oncol. 2013;24:609-17
11. Lin XJ, Wang CP, Liu XD. et al. Body mass index and risk of gastric cancer: a meta-analysis. Jpn J Clin Oncol. 2014;44:783-91
12. Chen Y, Liu L, Wang X. et al. Body mass index and risk of gastric cancer: a meta-analysis of a population with more than ten million from 24 prospective studies. Cancer Epidemiol Biomarkers Prev. 2013;22:1395-408
13. Park YM, Kim JH, Baik SJ. et al. Clinical risk assessment for gastric cancer in asymptomatic population after a health check-up: An individualized consideration of the risk factors. Medicine (Baltimore). 2016;95:e5351
14. Kim KH, Park DJ, Park YS. et al. Actual 5-Year Nutritional Outcomes of Patients with Gastric Cancer. J Gastric Cancer. 2017;17:99-109
15. Chen HN, Chen XZ, Zhang WH. et al. The Impact of Body Mass Index on the Surgical Outcomes of Patients With Gastric Cancer: A 10-Year, Single-Institution Cohort Study. Medicine (Baltimore). 2015;94:e1769
16. Park YS, Park DJ, Lee Y. et al. Prognostic Roles of Perioperative Body Mass Index and Weight Loss in the Long-Term Survival of Gastric Cancer Patients. Cancer Epidemiol Biomarkers Prev. 2018;27:955-62
17. Kambara Y, Yuasa N, Takeuchi E. et al. Overweight or Obesity is an Unfavorable Long-Term Prognostic Factor for Patients who Underwent Gastrectomy for Stage II/III Gastric Cancer. World J Surg. 2019;43:1766-76
18. Park SK, Ryoo JH, Oh CM. et al. Effect of Overweight and Obesity (Defined by Asian-Specific Cutoff Criteria) on Left Ventricular Diastolic Function and Structure in a General Korean Population. Circ J. 2016;80:2489-95
19. Hothorn T, Lausen B. On the exact distribution of maximally selected rank statistics. Computational Statistics & Data Analysis. 2003;43:121-37
20. Shimada S, Sawada N, Ishiyama Y. et al. Impact of obesity on short- and long-term outcomes of laparoscopy assisted distal gastrectomy for gastric cancer. Surg Endosc. 2018;32:358-66
21. Brown JC, Meyerhardt JA. Obesity and Energy Balance in GI Cancer. J Clin Oncol. 2016;34:4217-24
22. Dhar DK, Kubota H, Tachibana M. et al. Body mass index determines the success of lymph node dissection and predicts the outcome of gastric carcinoma patients. Oncology. 2000;59:18-23
23. Ojima T, Iwahashi M, Nakamori M. et al. Influence of overweight on patients with gastric cancer after undergoing curative gastrectomy: an analysis of 689 consecutive cases managed by a single center. Arch Surg. 2009;144:351-8 discussion 8
24. Aoyama T, Sato T, Maezawa Y. et al. Postoperative weight loss leads to poor survival through poor S-1 efficacy in patients with stage II/III gastric cancer. Int J Clin Oncol. 2017;22:476-83
25. Migita K, Takayama T, Matsumoto S. et al. Impact of being underweight on the long-term outcomes of patients with gastric cancer. Gastric Cancer. 2016;19:735-43
26. Meyerhardt JA, Catalano PJ, Haller DG. et al. Influence of body mass index on outcomes and treatment-related toxicity in patients with colon carcinoma. Cancer. 2003;98:484-95
27. Aoyama T, Yoshikawa T, Shirai J. et al. Body weight loss after surgery is an independent risk factor for continuation of S-1 adjuvant chemotherapy for gastric cancer. Ann Surg Oncol. 2013;20:2000-6
28. Thoresen L, Frykholm G, Lydersen S. et al. Nutritional status, cachexia and survival in patients with advanced colorectal carcinoma. Different assessment criteria for nutritional status provide unequal results. Clin Nutr. 2013;32:65-72
29. Walter V, Jansen L, Hoffmeister M. et al. Prognostic relevance of prediagnostic weight loss and overweight at diagnosis in patients with colorectal cancer. Am J Clin Nutr. 2016;104:1110-20
30. Wang Z, Aguilar EG, Luna JI. et al. Paradoxical effects of obesity on T cell function during tumor progression and PD-1 checkpoint blockade. Nat Med. 2019;25:141-51
31. Li XT, Tang L, Chen Y. et al. Visceral and subcutaneous fat as new independent predictive factors of survival in locally advanced gastric carcinoma patients treated with neo-adjuvant chemotherapy. J Cancer Res Clin Oncol. 2015;141:1237-47
Author contact
![]() Corresponding author: Jing Liu, Department of Oncology, Rui Jin Hospital, Shanghai Jiaotong University School of Medicine, No. 197 Ruijin er Road, Shanghai 200025, P.R.China. E-mail address: lj12255com.cn
Corresponding author: Jing Liu, Department of Oncology, Rui Jin Hospital, Shanghai Jiaotong University School of Medicine, No. 197 Ruijin er Road, Shanghai 200025, P.R.China. E-mail address: lj12255com.cn