Impact Factor ISSN: 1449-1907

 Global reach, higher impact
Int J Med Sci 2020; 17(14):2125-2132. doi:10.7150/ijms.48074 This issue Cite
Research Paper
Fangcang Shelter Hospital in Wuhan: A radiographic report on a cohort of 98 COVID-19 patients
Tingting Guo1,2*, Xiaoming Liu1,2*, Cihao Xu1,2, Jiazheng Wang3, Lian Yang1,2, Heshui Shi1,2, Meng Dai1,2 ![]()
1. Department of Radiology, Union Hospital, Tongji Medical College, Huazhong University of Science and Technology, Wuhan 430022, China.
2. Hubei Province Key Laboratory of Molecular Imaging, Wuhan 430022, China.
3. MSC Clinical & Technical Solutions, Philips Healthcare, Beijing, 100000, China.
*These authors contributed equally to this work.
Received 2020-5-11; Accepted 2020-7-22; Published 2020-7-30
Abstract
Objectives: To present the temporal changes of CT manifestations in COVID-19 patients from a single fangcang shelter hospital and to facilitate the understanding of the disease course.
Materials and Methods: This retrospective study included 98 patients (males: females, 43:55, mean year, 49±12 years) with confirmed COVID-19 at Jianghan fangcang shelter hospital admitted between Feb 05, 2020, and Feb 09, 2020, who had initial chest CTs at our hospital. Radiographic features and CT scores were analyzed.
Results: A total of 267 CT scans of 98 patients were evaluated. Our study showed a high median total CT score of 7 within the first week from symptom onset, peaked in the 2nd week at 10, followed by persistently high levels of CT score with 9.5, 7 and 7 for the week 3, 4, and >4, respectively, and a prolonged median disease course (30 days, the median interval between the onset of initial symptoms and discharge). Ground-glass opacity (GGO) (58%, 41/71) was the earliest and most frequent finding in week 1. Consolidation (26%, 14/53) and mixed pattern (40%, 21/53) were predominant patterns in 2nd week. GGO and reticular were the main patterns of later phase CT scans in patients with relatively advanced diseases who had longer illness duration (≥4 weeks). Among the 94 CT abnormalities obtained within 3 days from the twice RT-PCR test turned negative, the mixed pattern was mainly presented in patients with disease duration of 2-3 weeks, for GGO and reticular were common during the whole course.
Conclusion: Discharged patients from fangcang shelter hospital demonstrated a high extent of lung abnormalities on CT within the first week from symptom onset, peaked at 2nd week, followed by persistence of high levels and a prolonged median disease course. GGO was the predominant pattern in week 1, consolidation and mixed pattern in 2nd week, whereas GGO and reticular patterns in later stages (≥4 weeks).
Keywords: Coronavirus disease 2019 (COVID-19), CT, ground-glass opacity (GGO)
Introduction
Since the outbreak of coronavirus disease 2019 (COVID-19) in Wuhan in December 2019, it has spread worldwide and infected more than 3 855 788 people by 9 May 2020 [1]. With the high rate of human transmission and a mortality rate of 2.9% in Hubei province compared to that of 0.4% outside of the region [2], the disease has been recognized as a pandemic by the WHO on Mar 11, 2020 [3].
In Wuhan, 16 fangcang shelter hospitals have been built-up to hospitalize, treat and monitor the patients with confirmed COVID-19, such that the limited medical resources could distribute for mild-type, common-type, severe-type, and fatal severe-type patients. By March 10, more than 12,000 patients [4] had been treated uniformly according to the standard protocols [5], and all the fangcang shelter hospitals in Wuhan had been closed due to the recent relief of the epidemics.
Previous studies have revealed the typical radiological imaging features of COVID-19 [6-12]. However, it remains understudied how the chest CT manifestations evolve in the patients of fangcang shelter hospitals, who were hospitalized according to uniform criteria [5] and who went through more regular examinations and uniform treatments [5]. In the meanwhile, as will be introduced below, the medical intervention in the fangcang shelter hospitals could be potentially practiced in a self-isolation environment such as at home. Therefore, the purpose of this study was to determine the temporal patterns of CT manifestations in COVID-19 patients from a single fangcang shelter hospital and to facilitate the understanding of the disease course.
Methods
The Jianghan fangcang shelter hospital in this study was operated by our hospital. This retrospective study was approved by the Ethics of Committees of our hospital. Only the anonymous data was collected, and informed consent for this retrospective study was waived.
Admission to, treatment at, and discharge from the Fangcang Shelter Hospitals
The admission criteria for fangcang shelter hospitals were[13]: 1) patients with confirmed COVID-19; 2) Clinical classifications were mild-type (clinical symptoms without CT abnormity) or common-type (clinical symptoms with CT abnormity); 3) no respiratory, cardio, or mental diseases, no other basic diseases; 4) 16-65 years old with self-care ability; 5) negative test results of influenza virus assays.
The treatment protocol and discharge criteria followed 'The 6th Edition of Pneumonia diagnosis and treatment plan for new coronavirus infection' formulated by National Health Commission of the People's Republic of China [5].
For treatment: 1) Oseltamivir: 75 mg/tablet, 2 tablets each time, 2 times a day, less than 10 days; 2) Abidor [14]: 200 mg for adults, 3 times a day, less than 10 days; 3) Moxifloxacin: 0.4 g for adults, once a day, less than 7 days; 4) LianHua QingWen Formular: 1.4 g each time, three times a day, less than 10 days.
For discharge: 1) afebrile for more than 3 days; 2) respiratory symptoms markedly improved; 3) improvement in the radiological abnormalities on chest CT (Reduction in density and range of lesions); 4) two successive negative PCR tests with at least 24 h interval.
Patients
We retrospectively reviewed the clinical records of patients for Jianghan fangcang shelter hospital who were admitted between February 05, 2020, and February 09, 2020, and the initial symptoms and symptom onset time were recorded. The inclusion criteria were: 1) patients had initial chest CT at our hospital (hence the integrity of the clinical and imaging records) were included in the study; 2) patients had been discharged from Jianghan fangcang shelter hospital by the censored date (March 09, 2020).
CT image acquisition
To minimize motion artifacts, patients were instructed on breath-holding in the supine position. All chest CT scans were performed within a single inspiratory phase on two commercial multi-detector CT scanners (uCT550, Shanghai, China, Shanghai United Imaging Healthcare; Aquilion16-slice, Toshiba Medical Systems, Tochigi, Japan). For CT acquisition, the tube voltage was fixed at 120 kVp, the pitch of 1.075, scanning interval of 0.55 mm, rotation time of 0.6s, and collimator width of 22 mm. Low-dose scanning mode with an automatic tube current of 40 mAs and dose level at 1 was performed to reduce the radiation risk of the patients. CT images were reconstructed with a matrix size of 512 × 512 (thickness of 1.5 mm and increment of 1.5 mm) in transverse slice orientation. The images were acquired for lung (window width, 1,000-1,500 HU; window level, -700 HU) and mediastinal (window width, 350 HU; window level, 35-40 HU) settings.
CT Image Interpretation
Image analysis was reviewed by three radiologists (H. S, L. Y, and M. D who had 30, 22 and 10 years of experience in thoracic radiology, respectively), using the institutional digital database system (Vue PACS, version 11.3.5.8902, Carestream Health, Canada). Decisions were reached by consensus when there was a disagreement between the three radiologists.
Depending on the time between symptoms onset and the CT scan, all the CT scans were divided into 5 groups: Group 1 (scans obtained the first week from symptom onset), Group 2 (2nd week), Group 3 (3rd week), Group 4 (4th week), and Group 5 (>week 4).
Predominantly CT pattern, including ground-glass opacity (GGO), consolidation pattern, reticular pattern, and the mixed pattern (the combination of GGO, consolidation, and reticulation) [6, 8, 9, 15]. Distribution of abnormal opacities was recorded mainly as three types: subpleural (involving mainly the peripheral one-third of the lung), random (without predilection for subpleural or central regions), and diffuse (continuous involvement without respect to lung segments) [6]. Additionally, the presence of pleura effusion, mediastinal lymphadenopathy (axil diameter >1.0 cm) was also noted.
A total score of 0-25 was obtained as the summation of 5 lobes (score 0-5 for each lobe: score 0, no involvement; score 1, <5% involvement; score 2, 6%-25% involvement; score 3, 26%-49% involvement; score 4, 50%-75% involvement; score 5, >75% involvement) [16].
Statistical analysis
The median values of total CT scores were plotted against time since symptom onset. The temporal changes in CT abnormity patterns and the distribution of lung abnormalities were analyzed. Manne-Whitney U test was used for the difference between the median values of CT lung quantification in different groups, and the Chi-square test was applied to compare the frequency of CT patterns in different groups. A P-value of < 0.05 was considered statistically significant. Statistical analysis was performed by using statistical software (SPSS version 18, IBM, New York, USA).
Results
Patients
Between February 05, 2020, and February 09, 2020, a total of 125 patients for Jianghan fangcang shelter hospital who performed the initial CT scans in our hospital were conducted. Another 27 patients were excluded because they were transferred to designated hospitals due to failure to meet discharge criteria. The remaining 98 patients (43 males and 55 females) with confirmed COVID-19 were included in this study, all of whom had been discharged by the censored date. The mean age of the patients was 49 ± 12 years old (range 15-67 years). The most common symptoms at the onset of illness were fever (82%) and cough (52%). Most fever patients had either low-grade (38%, 37.4-38 °C) or moderate fever (32%, 38.1-39.0 °C). All patients were discharged with a median hospitalized period of 18 (interquartile range: 14-22) days, range 9-33 days. Median time from symptom onset to discharge was 30 (interquartile range: 26-36) days, range 15-49 days. The demographic characteristics, initial symptoms, and clinical records were summarized in Table 1.
Characteristics of the patient cohort
| All patients (n=98) | |
|---|---|
| Age (y) | 49 ± 12 (15-67) |
| Gender | |
| Male | 43 (44%) |
| Female | 55 (56%) |
| Initial symptoms | |
| Cough | 51 (52%) |
| Fever | 80(82%) |
| Low grade fever (37.4 - 38.0 °C) | 37 (38%) |
| Moderate grade fever (38.1 - 39.0 °C) | 31(32%) |
| High grade fever (>39.0 °C) | 12 (12%) |
| Fatigue | 35 (36%) |
| Myalgia | 31 (32%) |
| Chest tightness | 47 (48%) |
| Anorexia | 50 (51%) |
| Diarrhoea | 26 (26%) |
| Headache | 7 (7%) |
| The hospitalized period (d) | 18 (14,22) |
| The interval between the onset of initial symptoms and discharge (d) | 30 (26,36) |
Note: Quantitative data were presented as mean ± standard deviation (minimum-maximum), while the counting data were presented as count (percentage of the total). The hospitalized period and the interval between the onset of initial symptoms and discharge were presented as median (25%, 75%).
General CT manifestations
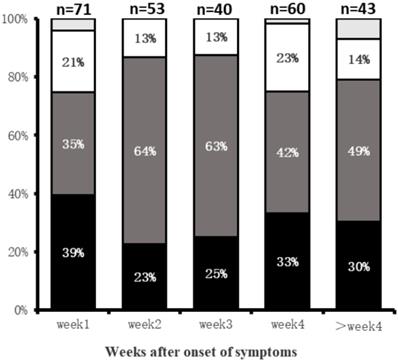
Among the 98 patients, 40 had twice CT scans, 45 had three CT scans, and the other 13 had four CT scans. A total of 267 CT scans was acquired and evaluated. Group 1 (n=71), Group 2 (n=53), Group 3 (n=40), Group 4 (n=60), and Group 5(n=43). For Group 1, the predominant demonstrations were subpleural (39%, 28/71 patients) and diffuse (35%, 25/71) lung abnormalities. Lung abnormalities tended to be most diffuse (64%, 34/53) in Group 2 (Fig. 1). Bilateral lung involvement was commonly observed during the whole course of the disease (lung involvement 76%-90%) with the highest percentage of 90% (36/40 patients) in Group 3 (Table 2).
Distributions of Lung abnormities at various times in weeks after symptoms onset. Categories with a percentage of ≥10% are shown. Black = subpleural; dark gray = diffuse; white = random; light gray = no lesion.
Temporal changes of lung abnormities in CT scans since symptom onset
| Group 1 (n=71) | Group 2 (n=53) | Group 3 (n=40) | Group 4 (n=60) | Group 5 (n=43) | |
|---|---|---|---|---|---|
| Distribution of pulmonary lesions | |||||
| No lesion | 3 (4%) | 0 (0%) | 0 (0%) | 1 (2%) | 3 (7%) |
| subpleural | 28 (39%) | 12 (23%) | 10 (25%) | 20 (33%) | 13 (30%) |
| Random | 15 (21%) | 7 (13%) | 5 (13%) | 14 (23%) | 6 (14%) |
| Diffuse | 25 (35%) | 34 (64%) | 25 (63%) | 25 (42%) | 21 (49%) |
| Involvement of the lesions | |||||
| No lesion | 3 (4%) | 0 (0%) | 0 (0%) | 1 (2%) | 3 (7%) |
| unilateral lung | 14 (20%) | 10 (19%) | 4 (10%) | 9 (15%) | 2 (5%) |
| bilateral lung | 54 (76%) | 43 (81%) | 36 (90%) | 50 (83%) | 38 (88%) |
| Patterns | |||||
| GGO | 41 (58%) | 14 (26%) | 15 (38%) | 27 (45%) | 15 (35%) |
| Consolidation | 16 (23%) | 14 (26%) | 5 (13%) | 1 (2%) | 2 (5%) |
| Reticular | 0 (0%) | 3 (6%) | 11 (28%) | 23 (38%) | 19 (44%) |
| Mixed | 11 (15%) | 21 (40%) | 9 (23%) | 8 (13%) | 4 (9%) |
| Number of involved lobes | 5 (2,5) | 5 (2,5) | 5 (4,5) | 5 (2.25,5) | 4 (3,5) |
| Total Scores | 7 (3,10) | 10 (4,14)# | 9.5 (7,14) | 7 (4,10)# | 7 (4,11) |
Note: The counting data were presented as count (percentage of the total). Total scores were presented as median (25%, 75%). Manne-Whitney U test showed the median total CT scores had significant difference between group 1 (0-7 days) and group 2(8-14 days, P=0.015), group 3 (15-21 days) and group 4 (22-28 days, P=0.006). There was no statistical significant difference between group 2 and group 3(P=0.529), group 4 and group 5 (>28 days, P=0.917).
Temporal changes in CT scores
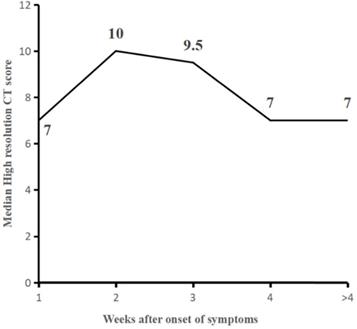
The median values of total CT score were 7 (interquartile range: 3-10) for the first week (Group 1), higher than reported in the literatures (6, 10, 16), which slowly increased to a peak value of 10 (interquartile range: 4-14, p< 0.05, compared to that of within the first week) at the second week (Group 2) and started to decrease substantially afterward. The median values of total CT scores were 9.5 (7, 14), 7 (4, 10), and 7 (4, 11) for the Groups 3, 4, and 5, respectively. Radiological improvement occurs after the third week, with a statistically significant decrease in median scores between Group 3 and Group 4 (p=0.006) (Table 2, Fig. 2).
Line graph showing the median CT scores at various time points in weeks after onset of symptoms. CT scores peaked at 2nd week of illness, with a platform period after that and slow decline substantial scores after the 3rd week. The median score between Group1 and 2, Group 3, and 4 were statistically significant, respectively (P=0.015, P=0.006).
Temporal changes of predominant imaging patterns
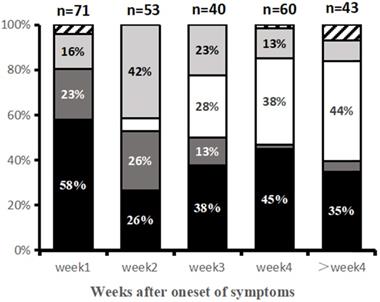
Predominant CT image patterns changed over time as the disease progressed. Within the first week (Group 1) after symptom onset, the GGO pattern was the earliest and most common imaging finding (58%, 41/71 patients). In the second week (Group 2), consolidation and mixed pattern developed to the predominant patterns with demonstration frequencies of 26% (14/53) and 40% (21/53). In the third week of illness (Group 3), imaging patterns became more diverse, including GGO (38%, 15/40 patients), reticular pattern (28%, 11/40), and mixed pattern (23%, 9/40). GGO and reticular patterns were the main imaging patterns in Group 4 (4th week) and Group 5 (>4 weeks) (Table 2, Fig. 3).
Main CT patterns at various time points since symptom onset. Categories with Percentage ≥10% are shown. Black = ground-glass opacities (GGO) pattern; Dark gray = consolidation pattern; light gray = mixed pattern; white = reticular pattern; striped = normal.
Among the 71 CT scans in Group 1 who had their initial CT taken within the 1st week of symptom onset, 8 patients with repeated examinations or no lesions were excluded, hence, 63 patients demonstrated CT abnormalities, including GGO in 38 patients, consolidation in 15 patients, and mix pattern for 10 patients. For the 38 patients with initial GGO, 37 presented varying residual lesions in the final scans, including GGO pattern [17 patients, median CT score: 3 (1, 7)] (Fig. 4), reticular pattern [18 patients, 9 (5, 13)] and mixed pattern [2 patients, 8 (5, 11)]. Noticeably, the median CT score of patients with the final reticular pattern was higher than that of patients with final GGO (p=0.004). Among the 38 patients with initial predominant GGO, 17 had final CT scan at discharge also demonstrated predominant GGO, while the median CT scores had significant differences between the initial [median CT score: 5 (3, 9)] and final CTs [median CT score: 3 (1, 7)] (p=0.033). On the other hand, 18 of the 38 patients had their initial predominant GGO turned to the reticular pattern in the final scans, for whom no significant differences were observed between the initial [median CT score: 8.5 (3.75,10.25)] and the final CT scores [median CT score: 9 (5,13)] (p=0.253). For the 15 patients with initial consolidation, residual lesions in the final scans were GGO in 9 patients [median CT score: 4 (2, 7)] and reticular in 4 patients [median CT score: 7 (3, 9.5)] (Fig. 5). For the 10 patients with initially mixed patterns, residual lesions in the final scans were GGO in 2 patients and reticulation in 7 patients [median CT score: 8 (2, 11)] (Table 3).
Changes between the initial and final CT demonstrations
| Initial CT patterns | GGO (n=38) | Consolidation (n=15) | Mixed (n=10) | ||||||||
|---|---|---|---|---|---|---|---|---|---|---|---|
| Final CT patterns | No lesion | GGO | Reticular | Mixed | No lesion | GGO | Reticular | Mixed | No lesion | GGO | Reticular |
| Number (%) | 1 (2.6%) | 17 (44.7%) | 18 (47.3%) | 2 (5.2%) | 1 (6.6%) | 9 (60%) | 4 (26.6%) | 1 (6.6%) | 1 (10%) | 2 (20%) | 7 (70%) |
| Total scores | 0 (-) | 3 (1,7) | 9 (5,13) | 8 (5,11) | 0 (-) | 4 (2,7) | 7 (3,9.5) | 2 (-) | 0 (-) | 6 (6,6) | 8 (2,11) |
Note: The counting data were presented as count (percentage of the total). Total scores were presented as median (25%, 75%).
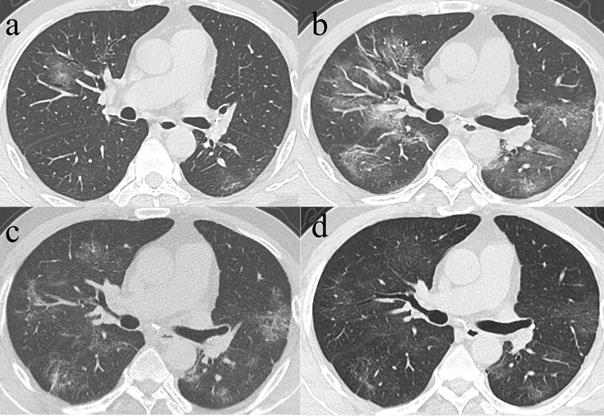
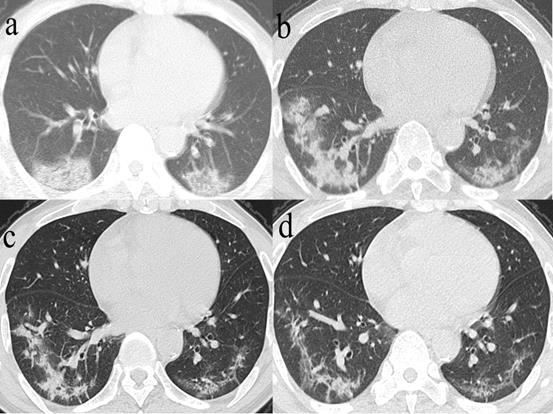
Series CT scans in a 61-year-old man with COVID-19 pneumonia. a. Scan obtained on illness days 2 showed GGO that affected the right middle lobe and left lower lobe. b, Scan obtained on illness days 9 showed an increased extent of GGO with little parenchymal bands. c. Scan obtained on illness days 19 showed absorption of abnormalities, with GGO and little parenchymal bands. d. Scan obtained on illness days 33 showed obvious absorption of abnormalities. Only GGO could be observed. The patient was discharged on illness days 36.
Series CT scans in a 65-year-old man with COVID-19 pneumonia. a. Scan obtained on illness days 4 showed consolidation affected in both lower lobes. b. Scan obtained on illness days 18 showed consolidation with an increased extent. c. Scan obtained on illness days 27 showed a predominantly mixed pattern with bandlike consolidation and parenchymal bands in both lower lobes. d. Scan obtained on illness days 36 showed a predominantly reticular pattern with interlacing line shadows mainly in both lower lobes. The patient was discharged on illness days 39.
94 out of 98 patients had their last CT scans obtained within 3 days from the twice PCR test that turned negative. The last CT scans were obtained more than 3 days from the PCR turning negative for the other 4 patients. Among the last CT scans for these 94 patients, the mixed pattern was mainly presented in patients with a disease duration of 2-3 weeks, for whom GGO and reticular were consistently the most common CT abnormalities during the whole course. Complete lesion absorption was observed for 4 (4/94) patients only. Substantial residual lesions (median CT score ≥5) mainly existed in patients with the disease course of greater than 3 weeks (Table 4).
CT abnormities obtained within 3 days from the twice RT-PCR test that turned negative
| week 1 (n=0) | week 2 (n=9) | week 3 (n=16) | week 4 (n=42) | > week 4 (n=27) | |
|---|---|---|---|---|---|
| No lesion | 0 (0%) | 0 (0%) | 0 (0%) | 1 (2%) | 3 (11%) |
| Patterns | |||||
| GGO | 0 (0%) | 3 (33%) | 6 (38%) | 16 (38%) | 12 (44%) |
| Consolidation | 0 (0%) | 0 (0%) | 0 (0%) | 0 (0%) | 1 (4%) |
| Reticular | 0 (0%) | 3 (33%) | 6 (38%) | 18 (43%) | 10 (37%) |
| Mixed | 0 (0%) | 3 (33%) | 4 (25%) | 7 (17%) | 1 (4%) |
| Total scores | 0 (0%) | 3 (33%) | 8 (3,11) | 8 (4,10) | 5 (3,9) |
Note: The counting data were presented as count (percentage of the total). Total scores were presented as median (25%, 75%).
Four of the 98 patients (4%) developed mild unilateral (3/4 patients) and bilateral (1/4) pleural effusion at 6, 10, 23, and 27 days since symptom onset. Mediastinal lymphadenopathy was not observed in our study.
Discussion
In this study, serial CT scans obtained in the cohort of Jianghan fangcang shelter hospital were analyzed to explore the temporal imaging changes from symptom onset. Lung injury in CT demonstrations developed remarkably after symptom onset and peaked in the second week, followed by a slow decrease of total CT scores. Remarkably, the median CT score in the 1st week from symptom onset was higher than those reported previously for COVID-19 patients [10, 16] and even SARS [6] patients. The peak of the CT score appeared in the 2nd week since symptom onset in our cohort, which was consistent with 6-11 days reported by Pan et al. [16] and Wang et al. [10] with COVID-19 patients and the 2nd week reported by Ooi et al. [6] for SARS patients, and which was, however, controversial to the rapid lung injury as presented for SARS and MERS [6, 17]. The high median CT score in the 1st week from symptom onset in our cohort was accompanied by longer median disease duration of 30 (26,36) days and hospitalized 18 (14,22) days, in contrast to the median disease duration of 25 (10, 56) days and hospitalized period of 18 (5, 43) days reported by Wang et al. [10] and the mean disease duration of 19 ± 4 days and hospitalized period of 17±4 days as reported in Pan et al. [16]. These observations of high initial CT score and longer disease duration might be attributed to the older cohort in our study (49 ± 12 years) as compared to the cohort ages of 40 ± 9 years in Pan et al. [16] and 45 ± 14 years in wang et al. [6, 10]. The patients reported in SARS [6] and MERS [17] studies were 42.5 ± 12.2 years old and 44.2 ± 16.1 years old, respectively, which might have led to a shorter disease course and, hence, the earlier CT score peak when compared to the cases in our cohort. The differences in treatments may be another cause of varying disease course. Oral antiviral agents, complaint management and symptomatic treatment were the main treatments in fangcang shelter hospitals [5], while oxygen treatment/high-flow nasal cannula, mechanical ventilation, glucocorticoids therapy and emergency extracorporeal membrane oxygenation (ECMO) were commonly used for severe patients in designated hospitals [2, 18]. Therefore, the similar peak time, despite the higher initial CT score, when compared to the previous reports might have revealed the progressive nature of the disease at the absence of complicated treatments in the fangcang shelter hospitals, which was also evidenced by the slow decrease and persistent high CT scores after the 2nd week in our study that was suggestive of the slow absorption of the COVID-19 lung lesions. To confirm this speculation, we will review the data from multiple fangcang shelter hospitals for larger sample size and extended monitoring.
In this work, predominant GGO was the commonest and earliest imaging finding within the first week after symptom onset, while consolidation became predominant in the second week. Predominant GGO and consolidation have also been widely reported in previous studies as the common lung abnormalities within the first 2 weeks after symptom onset in COVID-19, SARS or MERS [6, 9-11, 16, 17, 19]. A recent postmortem pathology study [20] for a patient with a 15-day disease course revealed the exudative change in the lung and the absence of severe fibrosis, suggesting diffuse alveolar damage in response to acute lung injury, which was supportive to the observed CT manifestations in the first 2 weeks. The severity and distribution of gray-white patch lesions in the lung in the pathology had explained the predominant GGO in the early stage. The eventual consolidation was considered a result of cellular fibro-myxoid exudates in alveoli [21].
Radiological improvement occurred after the third week. For later stages (≥4 weeks), predominant GGO and reticular pattern became common findings, inconsistency with the CT demonstrations of SARS [6, 22, 23] or ARDS [24]. However, Wang et al. [10] indicated GGO and mixed pattern were the common findings in the later stage of COVID-19 pneumonia, the cause of this difference remaining unclear. Particularly, the reticular pattern experienced a persistent increase since the 2nd week in our study, and the lung involvement of GGO had an obvious decrease in the second week and increased after that. Besides, GGO and reticular were the main patterns of later phase CT scans in patients with relatively advanced diseases who had longer illness duration (≥4 weeks). Elevation of GGO in later stages had also been reported before for both COVID-19 [10] and SARS [6]. Noticeably, patients with predominant reticular pattern in the late stages had significantly higher late-stage CT scores than those with late-stage predominant GGO, implying the appearance of GGO in later stage suggestive of better recovery of the illness [6, 10]. In contrast, substantial residual reticular pattern in later stage might indicate the possible development of fibrosis [25] or secondary organizing pneumonia [26]. Irreversible fibrosis might be too early to label due to uncharted nature history [6]. Our observation raised the necessity of long-term follow-up in chest CT and concomitant functional tests to determine the long-term pulmonary sequelae of COVID-19 [22].
Although all the patients in this cohort matched with the discharge criteria by the end of the study, varying residual lesions were still observed via CT. In light of a recent report of 4 discharged patients with recurrent positive RT-PCR results [27], follow up of these patients is also necessary from the perspective of epidemic prevention.
The current study was mainly limited as no severe patients were included.
In conclusion, our study showed a high median total CT score of 7 within the first week from symptom onset, peaked at 2nd week, followed by persistence of high levels and a prolonged median disease course. GGO was the predominant pattern in week 1, consolidation and mixed pattern in 2nd week, whereas GGO and reticular patterns in later stages (≥4 weeks).
Highlights
- A high median total CT score of 7 within the first week from symptom onset, peaked at 2nd week, followed by persistence of high levels and a prolonged median disease course;
- Ground-glass opacity (GGO) was the earliest and most frequent finding in week 1. Consolidation and mixed pattern were predominant patterns in 2nd week. GGO and reticular were the main patterns in the later stages of the disease;
- Among the 94 patients with CT abnormities obtained within 3 days from the twice RT-PCR test turned negative, GGO and reticular were common during the whole course.
Abbreviations
COVID-19: Coronavirus disease 2019; SARS-CoV-2: Severe acute respiratory syndrome coronavirus 2; SARS: Severe acute respiratory syndrome; MERS: the Middle East respiratory syndrome; GGO: Ground-glass opacity.
Competing Interests
The authors have declared that no competing interest exists. This research did not receive any specific grant from funding agencies in the public, commercial, or not-for-profit sectors.
References
1. World Health Organization. Coronavirus Disease 2019 (COVID-19) Situation Reports-110. https://www.who.int/emergencies/diseases/novel-coronavirus-2019/situation-reports
2. Murthy S, Gomersall CD, Fowler RA. Care for Critically Ill Patients With COVID-19. JAMA. 2020
3. World Health Organization website. WHO Director-General's opening remarks at the media briefing on COVID-19 - 11 March 2020. https://www.who.int/dg/speeches/detail/who-director-general-s-opening-remarks-at-the-media-briefing-on-covid-19--11-march-2020
4. China National Health Commission website. www.nhc.gov.cn/wjw/xwdt/202002/e8a5445c274747f7b4a4e119c175bd1d.shtml
5. National Health Commission of the People's Republic of China. The guidelines for the diagnosis and treatment of 2019-nCoV pneumonia (the 6th edition). http://www.nhc.gov.cn/xcs/zhengcwj/202002/8334a8326dd94d329df351d7da8aefc2.shtml
6. Ooi GC, Khong PL, Muller NL, Yiu WC, Zhou LJ, Ho JC. et al. Severe acute respiratory syndrome: temporal lung changes at thin-section CT in 30 patients. Radiology. 2004;230(3):836-44
7. Zu ZY, Jiang MD, Xu PP, Chen W, Ni QQ, Lu GM. et al. Coronavirus Disease 2019 (COVID-19): A Perspective from China. Radiology. 2020;0(0):200490
8. Ye Z, Zhang Y, Wang Y, Huang Z, Song B. Chest CT manifestations of new coronavirus disease 2019 (COVID-19): a pictorial review. European radiology. 2020
9. Shi H, Han X, Jiang N, Cao Y, Alwalid O, Gu J. et al. Radiological findings from 81 patients with COVID-19 pneumonia in Wuhan, China: a descriptive study. The Lancet Infectious Diseases. 2020
10. Wang Y, Dong C, Hu Y, Li C, Ren Q, Zhang X. et al. Temporal Changes of CT Findings in 90 Patients with COVID-19 Pneumonia: A Longitudinal Study. Radiology. 2020:200843.
11. Song F, Shi N, Shan F, Zhang Z, Shen J, Lu H. et al. Emerging 2019 Novel Coronavirus (2019-nCoV) Pneumonia. Radiology. 2020;295(1):210-17
12. Bernheim A, Mei X, Huang M, Yang Y, Fayad ZA, Zhang N. et al. Chest CT Findings in Coronavirus Disease-19 (COVID-19): Relationship to Duration of Infection. Radiology. 2020;0(0):200463
13. China People website. Management Rules of mobile cabin hospitals. Access on February 6, 2020. http://hb.people.com.cn/BIG5/n2/2020/0206/c192237-33768955-5.html
14. Zhang J, Zhou L, Yang Y, Peng W, Wang W, Chen X. Therapeutic and triage strategies for 2019 novel coronavirus disease in fever clinics. The Lancet Respiratory medicine. 2020;8(3):e11-e12
15. Hansell DM, Bankier AA, MacMahon H, McLoud TC, Muller NL, Remy J. Fleischner Society: glossary of terms for thoracic imaging. Radiology. 2008;246(3):697-722
16. Pan F, Ye T, Sun P, Gui S, Liang B, Li L. et al. Time Course of Lung Changes On Chest CT During Recovery From 2019 Novel Coronavirus (COVID-19) Pneumonia. Radiology. 2020:200370.
17. Das KM, Lee EY, Enani MA, AlJawder SE, Singh R, Bashir S. et al. CT correlation with outcomes in 15 patients with acute Middle East respiratory syndrome coronavirus. AJR American journal of roentgenology. 2015;204(4):736-42
18. MacLaren G, Fisher D, Brodie D. Preparing for the Most Critically Ill Patients With COVID-19: The Potential Role of Extracorporeal Membrane Oxygenation. JAMA. 2020
19. Wong KT, Antonio GE, Hui DS, Lee N, Yuen EH, Wu A. et al. Thin-section CT of severe acute respiratory syndrome: evaluation of 73 patients exposed to or with the disease. Radiology. 2003;228(2):395-400
20. Q L, R W, G Q, Wang Y. Autopsy report in a dead patient with COVID-19. Journal of Forensic Medicine. 2020 36(1)
21. Xu Z, Shi L, Wang Y, Zhang J, Huang L, Zhang C. et al. Pathological findings of COVID-19 associated with acute respiratory distress syndrome. The Lancet Respiratory medicine. 2020
22. Chang YC, Yu CJ, Chang SC, Galvin JR, Liu HM, Hsiao CH. et al. Pulmonary sequelae in convalescent patients after severe acute respiratory syndrome: evaluation with thin-section CT. Radiology. 2005;236(3):1067-75
23. Muller NL, Ooi GC, Khong PL, Zhou LJ, Tsang KW, Nicolaou S. High-resolution CT findings of severe acute respiratory syndrome at presentation and after admission. AJR American journal of roentgenology. 2004;182(1):39-44
24. Desai SR, Wells AU, Rubens MB, Evans TW, Hansell DM. Acute Respiratory Distress Syndrome: CT Abnormalities at Long-term Follow-up. Radiology. 1999;210(1):29-35
25. Remy-Jardin M, Giraud F, Remy J, Copin MC, Gosselin B, Duhamel A. Importance of ground-glass attenuation in chronic diffuse infiltrative lung disease: pathologic-CT correlation. Radiology. 1993;189(3):693-98
26. Ajlan AM, Ahyad RA, Jamjoom LG, Alharthy A, Madani TA. Middle East respiratory syndrome coronavirus (MERS-CoV) infection: chest CT findings. AJR American journal of roentgenology. 2014;203(4):782-7
27. Lan L, Xu D, Ye G, Xia C, Wang S, Li Y. et al. Positive RT-PCR Test Results in Patients Recovered From COVID-19. Jama. 2020
Author contact
![]() Corresponding author: Meng Dai, Department of Radiology, Union Hospital, Tongji Medical College, Huazhong University of Science and Technology, Wuhan, China 430022. E-mail: daimengedu.cn; Tel.:+86-13720165087.
Corresponding author: Meng Dai, Department of Radiology, Union Hospital, Tongji Medical College, Huazhong University of Science and Technology, Wuhan, China 430022. E-mail: daimengedu.cn; Tel.:+86-13720165087.