Impact Factor ISSN: 1449-1907
- Issue 9; 2026
- Issue 8; 2026
- Issue 7; 2026
- Issue 6; 2026
- Issue 5; 2026
- Volume 23; 2026
- Past Issues
- Editorial Board
- Cover Images
- Index & Coverage
- Cover Suggestion
- Special Issues
Introduction
Materials and Methods
Results
Discussion
Supplementary Material
Acknowledgements
References

 Global reach, higher impact
Int J Med Sci 2020; 17(12):1723-1732. doi:10.7150/ijms.46456 This issue Cite
Research Paper
Lipid Metabolism is the common pathologic mechanism between Type 2 Diabetes Mellitus and Parkinson's disease
Xi Zhang1,3, Yu Fan1, Yuping Luo1,2, Lingjing Jin3 ![]() , Siguang Li1,2
, Siguang Li1,2 ![]()
1. Stem Cell Translational Research Center, Tongji Hospital, Tongji University School of Medicine, Shanghai 200065, China.
2. Key Laboratory of Spine and Spinal Cord Injury Repair and Regeneration of Ministry of Education, Orthopedic Department of Tongji Hospital, Tongji University School of Medicine, Shanghai 200065, China.
3. Department of Neurology, Tongji Hospital, Tongji University School of Medicine, Shanghai 200065, China.
Received 2020-3-29; Accepted 2020-6-18; Published 2020-7-6
Abstract
Although increasing evidence has suggested crosstalk between Parkinson's disease (PD) and type 2 diabetes mellitus (T2DM), the common mechanisms between the two diseases remain unclear. The aim of our study was to characterize the interconnection between T2DM and PD by exploring their shared biological pathways and convergent molecules. The intersections among the differentially expressed genes (DEGs) in the T2DM dataset GSE95849 and PD dataset GSE6613 from the Gene Expression Omnibus (GEO) database were identified as the communal DEGs between the two diseases. Then, an enrichment analysis, protein-protein interaction (PPI) network analysis, correlation analysis, and transcription factor-target regulatory network analysis were performed for the communal DEGs. As a result, 113 communal DEGs were found between PD and T2DM. They were enriched in lipid metabolism, including protein modifications that regulate metabolism, lipid synthesis and decomposition, and the biological effects of lipid products. All these pathways and their biological processes play important roles in both diseases. Fifteen hub genes identified from the PPI network could be core molecules. Their function annotations also focused on lipid metabolism. According to the correlation analysis and the regulatory network analysis based on the 15 hub genes, Sp1 transcription factor (SP1) could be a key molecule since it affected other hub genes that participate in the common mechanisms between PD and T2DM. In conclusion, our analyses reveal that changes in lipid metabolism could be a key intersection between PD and T2DM, and that SP1 could be a key molecule regulating these processes. Our findings provide novel points for the association between PD and T2DM.
Keywords: bioinformatical analysis, Parkinson's disease, type 2 diabetes mellitus, biomarker, lipid metabolism
Introduction
Parkinson's disease (PD) is the second most common neurodegenerative disorder, causing irreversible, progressive motor and nonmotor dysfunction. PD is characterized by neuronal loss in the substantia nigra and other brain regions with the presence of intracytoplasmic protein inclusions known as Lewy bodies [1]. Type 2 diabetes mellitus (T2DM) is a prevalent metabolic disorder characterized by obesity and chronic insulin resistance. T2DM comprises about 90% of all diabetic cases [2]. However, the potential relationship between these two refractory diseases remains unclarified.
Recently, several clinical studies with conflicting results have given deeper insight into the association between T2DM and PD [3]. Evidence from a case-control study suggested that diabetic individuals may have a decreased incidence of PD [4]. However, data from a meta-analysis showed no conclusive evidence supporting T2DM as a risk factor for PD [5]. In addition, some studies indicated that the contributing role of T2DM as a risk factor for PD could be associated with certain ethnic groups, including American [6], British [7], Danish [8], and Chinese [9]. Meanwhile, it was reported that T2DM is most likely associated with PD progression [10,11], as evidenced by repeated inpatient care, longer duration of hospitalization [12], a higher United Parkinson's Disease Rating Scale (UPDRS), and more severe Hoehn and Yahr staging [13] in PD patients with T2DM. Notably, the conflicting results may be due to several confounding factors, one of which is the impact of drugs. While PD medications (such as levodopa) induce hyperglycemia and hyperinsulinemia [14], anti-diabetic drugs (such as metformin [15], glitazones [16], and exenatide [17]) could elicit neuroprotection in PD and might lower the risk of acquired PD in populations with diabetes. In a word, the aforementioned findings highlight the detrimental impact that T2DM imposes on PD patients.
Even though T2DM is considered as a risk factor for developing PD, the exact mechanisms that explain the coexistence of these two disorders remains unclear. Recent studies have revealed convergent molecular and biological pathways that link both diseases. Hyperglycemia could be the most fundamental pathway. As previously reported, the majority of PD patients have abnormal glucose tolerance and display hyperglycemia [18], let alone T2DM. As a consequence of hyperglycemia, glycation is exacerbated in T2DM, and the formation of its agents is increased [19]. Accordingly, increased levels of glycation have been reported in the cerebral cortex, amygdala, and substantia nigra of PD patients [20]. Besides, chronic hyperglycemia is often accompanied by insulin signaling disorders that are common in both PD and T2DM patients. In turn, insulin signaling disorders can also alter systemic glucose and lipid metabolism, and impaired lipid metabolism is associated with inflammatory, oxidative stress, mitochondrial dysfunction, and insulin resistance [3]. Moreover, amyloid formation is another shared mechanism. One of the typical pathological features in PD is proteinaceous amyloid fibrils, which are composed mostly of alpha-synuclein, called Lewy pathology [1]. In T2DM, another disease involving amyloid formation, the primary pathological characteristic is islet amyloid polypeptide in pancreatic β-cells [21]. The amyloid formation initiates many processes, including endoplasmic reticulum stress, unfolding protein response, oxidative stress, autophagy, mitochondrial dysfunction, and cell apoptosis [3]. In general, the various processes do not exist independently but rather influence each other. They are reciprocal causations in the two disorders.
Common transcriptional signatures may provide further insight into the shared biological mechanisms in PD and T2DM. In the current study, we compared the expression profiles in T2DM and PD, and analyzed the communal differentially expressed genes (DEGs) in order to identify common pathologic mechanisms and protein‐protein interaction (PPI) nodes.
Materials and Methods
Data preprocessing and identification of DEGs
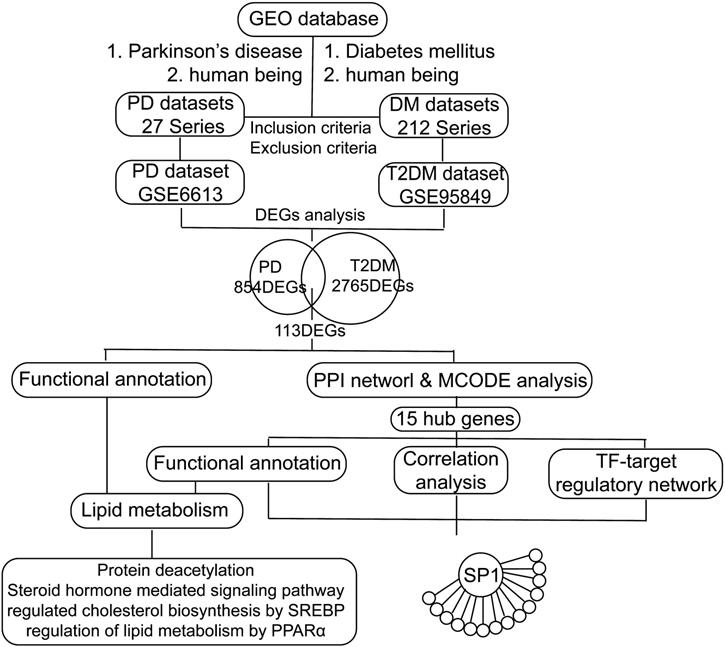
We retrieved transcription profile datasets of PD and T2DM from the NCBI Gene Expression Omnibus (GEO) database [20] based on the keywords "Parkinson's disease and human being" and "Diabetes mellitus and human being". These datasets were screened based on inclusion/exclusion criteria. The inclusion criteria were as follows: 1. Sporadic PD or type 2 diabetes mellitus; 2. Transcriptional RNA expression profiles based on peripheral blood; 3. Datasets that included patients and healthy controls. The exclusion criteria were as follows: Patients had participated in a clinical trial for drugs or other treatments. Finally, the transcription profiles in peripheral blood in PD (GSE6613, including 50 PD patients and 23 controls) and T2DM (GSE95849, including 6 T2DM patients and 6 controls) were obtained (Figure 1). According to the platforms, preprocessing and normalization of raw data (CEL files) were carried out with the affy package (version 1.64.0) [22] and the limma package (version 3.42.2) [23]. After excluding patients with other diseases, the following processes were performed: data format conversion, missing value imputation, background adjustment, quantile normalization, and principal components analysis (PCA) [24]. According to the PCA results, we excluded one sample affecting classification and reserved five T2DM patients and six healthy controls (HCs) in GSE95849. Since all the samples of GSE6613 were jumbled together and could not be classified at all according to the PCA and the clustering results, we randomly selected PD patients and HCs to avoid errors caused by subjective factors. And we decided to randomly selected six PD patients and six HCs, the same as the sample size of GSE95849. Significant expression differences were analyzed using the Bayesian analysis method provided by the limma package [23] with the cut-off value p < 0.05 and │Log2fold change (FC)│ > 1.0. In the following study, the intersection of the 2-dataset DEGs was defined as communal DEGs and visualized by the VennDiagram package (version 1.6.20) [25].
Flow chart of the study. GEO: Gene Expression Omnibus, PD: Parkinson's disease, DM: diabetes mellitus, T2DM: type 2 diabetes mellitus, DEGs: differentially expressed genes, PPI: protein-protein interaction, TF: transcription factor, SREBP: sterol regulatory element binding protein, PPARα: peroxisome proliferator activated receptor alpha, SP1: Sp1 transcription factor.
Functional annotation of significant DEGs
Gene ontology (GO), Kyoto Encyclopedia of Genes and Genomes (KEGG) pathways and Reactome pathways enriched by DEGs were analyzed by the clusterProfiler package (version 3.14.0) [26] and the ReactomePA package (version 1.30.0) [27] with the significant selection criteria including a p value <0.05 and gene count ≥ 2.0.
Integration of the PPI network and correlation analysis of hub nodes
The Search Tool for the Retrieval of Interacting Genes (STRING) online tool [28] was applied to analyze the PPI of the communal DEGs with the threshold of the combined score >0.15. The PPI network was constructed using the Cytoscape software (version 3.7.1) [29]. To identify hub nodes with higher betweenness centrality (BC), we used CytoHubba plug-in [30] in Cytoscape to analyze the significant nodes in the PPI network. In addition, the most highly interconnected module in the PPI network was analyzed using the plug-in MCODE [31] with default parameters. Correlations of hub genes with higher BC and hub nodes in MCODEs were calculated and visualized by the ggplot2 package (version 3.3.1).
Transcription factor-target regulatory network
The transcription factors (TFs) that target hub genes in the PPI network were predicted using the Cytoscape plug-in iRegulon [32], which integrates information from the lager motif and track collections. We obtained the data predicted by the track discovery of existing regulatory datasets, which include data validated by ChIP-Seq, DHS-seq, or FAIRE-seq. TF-target pairs with normalized enrichment scores (NES) >4 were selected.
Results
Identification of 113 communal DEGs between PD and T2DM
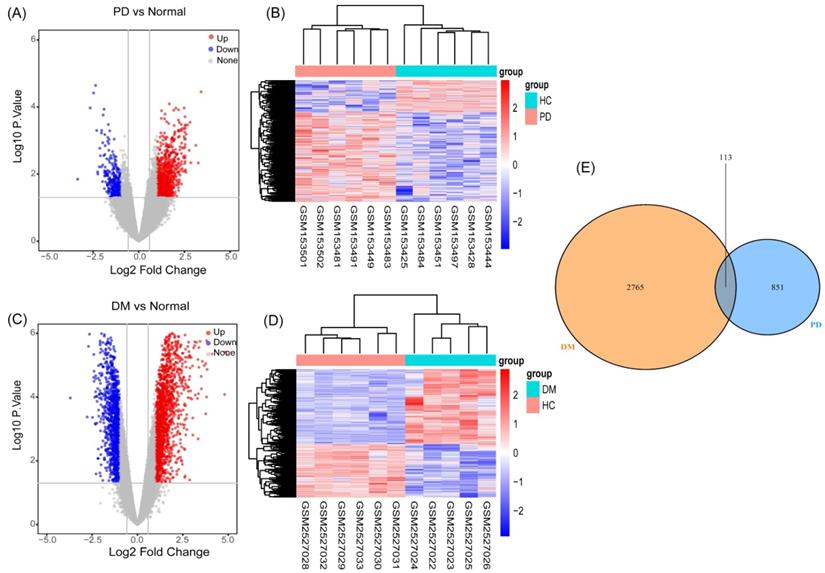
As described in the materials and methods section, based on the PCA and the clustering analyses, samples affecting classification were excluded from the preprocessed datasets (Figure S1, S2). We performed differential gene analysis and cluster analysis based on the screened samples, which included six PD patients and six HCs in GSE6613, and five T2DM patients and six HCs in GSE95849. We identified 964 genes (694 upregulated and 270 downregulated genes) (Figure 2A) as significant DEGs in patients with PD, compared to the controls. Meanwhile, compared to the controls, 2878 genes (1686 upregulated and 1192 downregulated genes) (Figure 2C) were identified as DEGs in T2DM. The results of the cluster analysis (Figure 2B, 2D) showed significant differences in the DEGs in PD and T2DM. By analyzing the shared DEGs of PD and T2DM, we found 113 communal DEGs (Figure 2E), including 49 co-upregulated and 12 co-downregulated genes.
Identification of gene expression profiles in the two datasets. (A) Volcano plot of PD microarray data. (B) The cluster heat map of PD DEGs. (C) Volcano plot of T2DM microarray data. (D) The cluster heat map of T2DM DEGs. (E) Venn diagram of the 194 communal DEGs between T2DM and PD.
Communal DEGs between PD and T2DM focused on the regulation of lipid metabolism
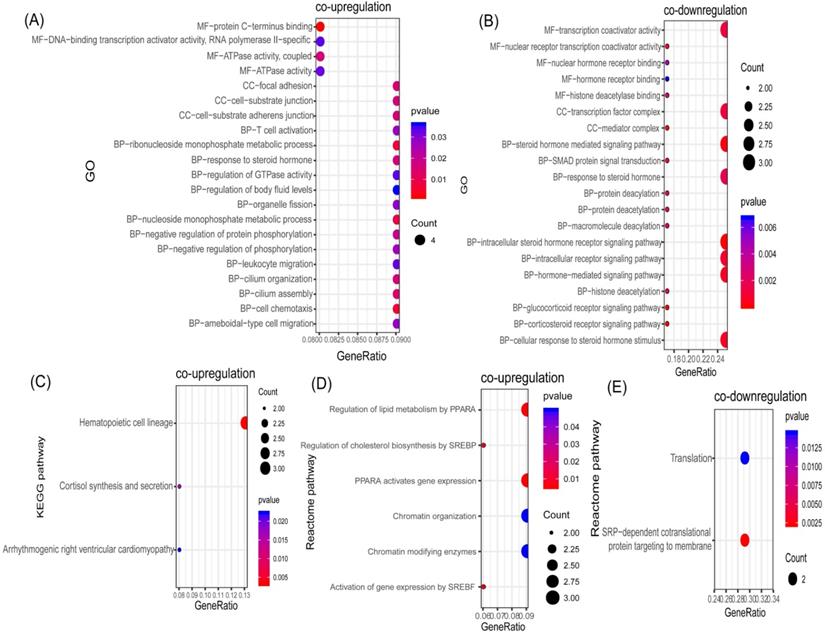
In order to identify potential communal biological processes and pathways between PD and T2DM, functional annotation analyses were performed based on the communal DEGs identified. According to our selection criteria, three KEGG pathways, six Reactome pathways, and 21 GOs were enriched by co-upregulated genes (Figure 3A, 3C, 3D), while two Reactome pathways and 20 GOs were enriched by co-downregulated genes (Figure 3B, 3E). The co-upregulated DEGs were enriched mainly in processes and pathways associated with the regulation of cholesterol biosynthesis (through the sterol regulatory element binding protein (SREBP)) and the regulation of lipid metabolism (through peroxisome proliferator activated receptor alpha (PPARα)). The co-downregulated DEGs were enriched mainly in deacetylation modifications and the steroid hormone mediated signaling pathway. These results suggested that the regulation of lipid metabolism could be the common pathologic mechanism that links both diseases.
Functional annotation of communal DEGs. (A) Bubble plot of the Gene ontology (GO) enriched by co-upregulated DEGs. (B) Bubble plot of the GOs enriched by co-downregulated DEGs. (C) Bubble plot of the KEGG pathway enriched by co-upregulated DEGs. (D) Bubble plot of the Reactome pathway enriched by co-upregulated DEGs. (E) Bubble plot of the Reactome pathway enriched by co-downregulated DEGs
Hub nodes in the PPI network focused on lipid metabolism processes
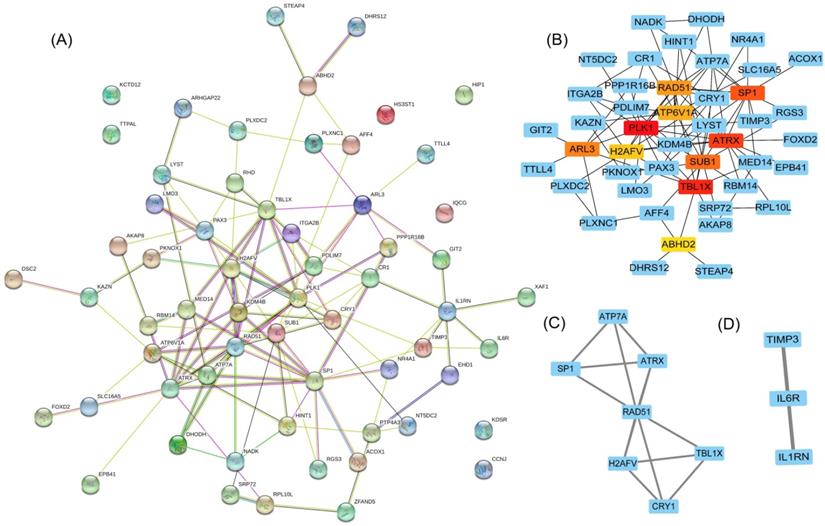
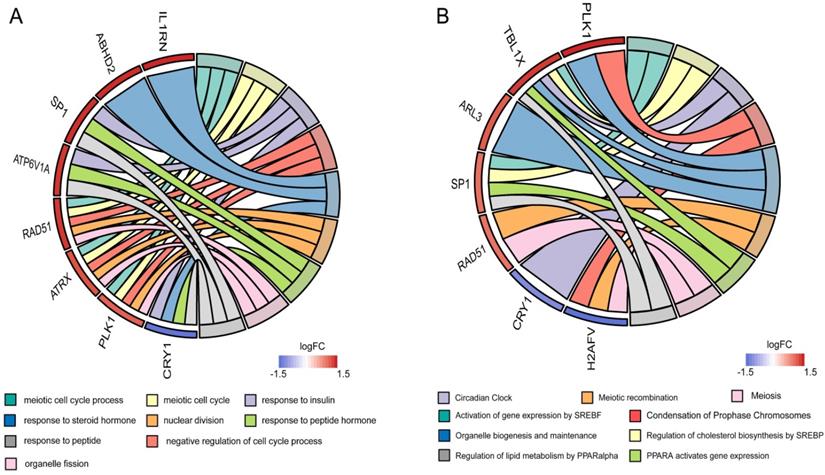
To clarify the interactions between DEGs, we performed a PPI network analysis on all communal DEGs (Figure 4A), and predicted core genes in the network through the topological property of BC (Figure 4B, Supplementary Table 1) and clustering algorithms called MCODE (Figure 4C, 4D). Combining the results of these two analyses, 15 key genes were obtained, in which Sp1 transcription factor (SP1), RAD51 paralog B (RAD51), transducin (beta)-like 1 X-linked (TBL1X), H2A histone family, member V (H2AFV), and alpha-thalassemia/mental retardation syndrome X-linked (ATRX) were identified by both methods. To verify the identified biological processes shared between PD and T2DM, function annotations of the 15 hub genes were performed. The results of those studies highlighted metabolic processes such as the response to insulin and steroid hormones, the activation of gene expression by SREBF, and the activation of gene expression by PPARα (Figure 5). The function annotations of the 15 hub genes were similar to the results of all 113 common DEGs, enhancing the credibility of the conclusion that lipid metabolism processes are the common pathologic mechanism between PD and T2DM.
Hub gene identification in a PPI network based on communal DEGs. (A) The PPI network of co-upregulated and co-downregulated DEGs. (B) The top 10 node genes in the PPI network. (C) Cluster 1 analyzed by the plug-in MCODE in the whole PPI network. (D) Cluster 2 analyzed by the plug-in MCODE in the whole PPI network.
Functional annotation of the hub genes. (A) Circos plot of the GOs enriched by hub genes. (B) Circos plot of the Reactome pathway enriched by hub genes.
SP1 was identified as a key molecule that affects other hub genes
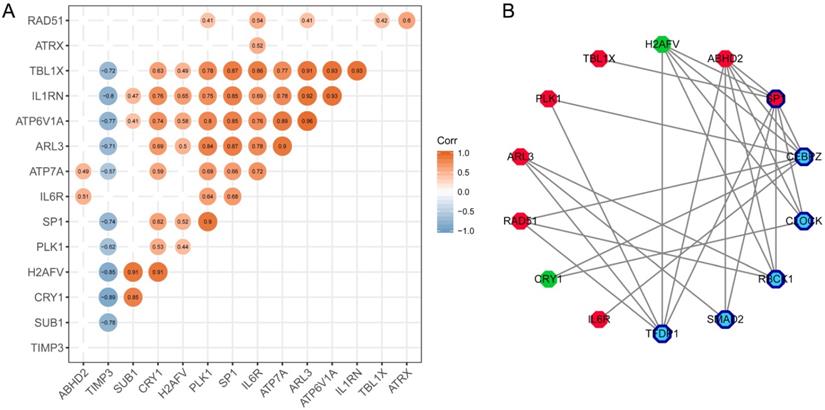
To find the most important regulatory molecule in the 15 hub genes, we analyzed correlations between the hub genes (Figure 6A) and constructed the TF-target regulatory network (Figure 6B, Supplementary Table 2). While the majority of the hub genes had significant correlations with each other, SP1 had either direct or indirect interactions with the other genes in the TF-target regulatory network. In other words, SP1 could be a key gene that regulates and connects with the other 14 hub genes. It is a nuclear transcription factor that can activate or repress the transcription of many genes. We reviewed the roles of the genes in the TF-target network in T2DM and PD (Table 1).
Review of the hub nodes in the transcription factor (TF)-target regulatory network
| Genes | T2DM | PD |
|---|---|---|
| polo-like kinase 1 (PLK1) | Stimulation of KLF14/PLK1 pathway potentiates endothelial dysfunction in Type 2 diabetes mellitus [50]. | PLK1 is involved in the phosphorylation of aggregated α-syn at S129 in this system; knockdown of PLK1 significantly inhibit Cory-induced autophagy that promotes the clearance of PD-associated SNCA/α-synuclein [51]. |
| transducin (beta)-like 1X-linked (TBL1X) | None | None |
| Sp1 transcription factor (SP1) | The specific recognition of -420G by Sp1/3 increases RETN promoter activity, leading to enhanced serum resistin levels, thereby inducing human T2DM [52]. | SP1 is a principal factor regulating increases in MAO B activity, and SP1 inhibition produces neuroprotective effects in PD models through decreases in MAO B activity, which may be a new neuro-protective therapeutic strategy for PD treatment [46]. |
| ADP-ribosylation factor-like 3 (ARL3) | None | None |
| RAD51 paralog B (RAD51) | Advanced Glycation End‐Products decrease the expression of RAD51 and RAD52 in INS-1 cells [53]. | DNA repair proteins like p-CREB, APE1 and Rad51 were increased in response to rotenone-induced DNA damage [54]. |
| H2A histone family, member V (H2AFV) | None | None |
| abhydrolase domain containing 2 (ABHD2) | None | None |
| Circadian Regulator 1 (CRY1) | Insulin-activated SREBP1c downregulates gluconeogenesis through CRY1-mediated FOXO1 degradation and dysregulation of hepatic SREBP1c-CRY1 signaling may contribute to hyperglycaemia in diabetic animals [55]. | None |
| Interleukin 6 Receptor (IL6R) | IL6R inhibits viability and apoptosis of pancreatic beta-cells in type 2 diabetes mellitus via regulation by miR-22 of the JAK/STAT signaling pathway [56]. | Protein expression of IL-1R, IL-6R, and TNFR subtype TNFR1 in the plasma membrane midbrain periaqueductal gray of PD rats was upregulated [57]. |
Identification of the key molecule affecting other hub genes. (A) The correlation analysis between hub genes. (B) TF-targeting regulatory network based on hub genes. Red polygons represent upregulated hub genes; green polygons represent downregulated hub genes; dark blue bordered polygons represent transcription factors; blue polygons represent predicted transcription factors.
Discussion
The last decade has witnessed an unceasing debate on the potential relationship between PD and T2DM. We attempted to associate the transcriptome data of T2DM patients with PD patients in order to explore the crosstalk between the two diseases.
In our study, all of the functional annotation results can be summed up in three aspects: protein modifications (protein deacetylation), lipid synthesis and decomposition (the regulation of cholesterol biosynthesis by SREBP and the regulation of lipid metabolism by PPARα), and the biological effects of lipid products (steroid hormone-mediated signaling pathways). Firstly, protein acetylation and deacetylation are posttranslational protein modifications that regulate inflammation, oxidative stress, mitochondrial function, and glucose and lipid metabolism in PD [33] and T2DM [34]. Secondly, overactivated SREBP means an imbalance between cholesterol synthesis and decomposition, while changes in the activity of PPARα can break the balance in lipid oxidation. All of these disorder processes not only contribute to α-synuclein aggregation and dyslipidemia [35,36], but also lead to elevated levels of both lipid and protein oxidation in T2DM and PD [37,38]. Finally, steroid hormones may participate in both PD [39] and T2DM [40]. For example, endogenous sexual hormones might have neuroprotective effects against neurotoxic agents for dopamine neurons [41], and modulate the glycemic status and risk of T2DM [42].
According to our analyses, 15 hub nodes were identified in the PPI network. The functional annotation results of these hub nodes also highlighted lipid metabolism, and showed these nodes to have significant correlations with each other. In the TF-target regulatory network, SP1 was the core factor that regulated the other genes either directly or through predicted transcription factors. SP1 not only regulates insulin signaling and cholesterol metabolism [43], but it is also a common interpreter of nuclear signal transduction in response to hormones [44]. Besides, SP1 modulates the expression and activity of PD-related genes to produce neuroprotective effects [45,46]. In conclusion, SP1 and its relevant genes may act as a core intersection in the crosstalk between T2DM and PD.
Santiago and Potashkin [47] discussed the pathways that are shared between PD and T2DM and obtained a key shared gene, amyloid precursor protein. The results were based on the analyses of confirmed genes associated with PD and T2DM. These genes were obtained from the genome-wide association studies (GWAS) catalog that collected published GWAS analyses, and were then verified by GEO microarray studies and clinical samples. GWAS aims at identifying genetic variants and disease-trait associations, but cannot identify all genetic determinants of complex traits [48]. Besides, complex traits and complex diseases, such as PD and T2DM, can be attributed not only to genotype but also environment. Results based solely on GWAS data do not include the substantial contribution of environmental factors. It is preferable to combine GWAS data with microarray studies and validation using clinical samples. In our study, we chose to analyze gene expression data from sporadic PD and T2DM patients in order to analyze the transcriptional response of the genome to environmental stimuli or physiological/pathological conditions [49].
Several limitations in our study should be acknowledged. First, the hub nodes identified need to be validated in future studies. Second, the sample size in this study was relatively small, and external validation is needed to consolidate our results. Additionally, it is necessary to perform functional studies to confirm the roles of the DEGs in T2DM and PD. Future functional verification could be performed on model organism that could be used to explore pathway-/gene-disease associations by gain or loss of function.
In conclusion, the communal DEGs and pathways identified in our study reveal transcriptome links between T2DM and PD, and provide novel mechanisms and targets that involve changes in lipid metabolism. Additionally, SP1 could be a key molecule regulating these processes.
Supplementary Material
Supplementary figures and tables.
Acknowledgements
We appreciate the support of all lab members and Dr. Donglai Chen from Department of Thoracic Surgery, Tongji University Affiliated Shanghai Pulmonary Hospital, and we would like to thank 'GEO database' for providing high quality biological data. Finally, we thank International Science Editing (http://www.internationalscienceediting.com) for editing this manuscript.
Funding
This study was supported by the National Key R&D Program of China (2018YFC1314700 and 2018YFA0108000 to LJ), the National Natural Science Foundation of China (81572234 and 81873779 to LJ), the Shanghai Education Development Foundation, Shanghai Municipal Education Commission Shuguang Program (14SG21 to LJ), Priority of Shanghai Key Discipline of Medicine (2017ZZ02020 to LJ).
Author Contributions
XZ designed the research topic, drafted the manuscript, and analyzed the data. XZ and YF participated in the revision of the manuscript and figures. YL, SL, and LJ were involved in the work instruction and financial support.
Competing Interests
The authors have declared that no competing interest exists.
References
1. de Lau LML, Breteler MMB. Epidemiology of Parkinson's disease. The Lancet Neurology. 2006;5:525-35
2. Zheng Y, Ley SH, Hu FB. Global aetiology and epidemiology of type 2 diabetes mellitus and its complications. Nature reviews Endocrinology. 2018;14:88-98
3. Santiago JA, Potashkin JA. Shared dysregulated pathways lead to Parkinson's disease and diabetes. Trends in molecular medicine. 2013;19:176-86
4. D'Amelio M, Ragonese P, Callari G, Di Benedetto N, Palmeri B, Terruso V. et al. Diabetes preceding Parkinson's disease onset. A case-control study. Parkinsonism & related disorders. 2009;15:660-4
5. Cereda E, Barichella M, Pedrolli C, Klersy C, Cassani E, Caccialanza R. et al. Diabetes and risk of Parkinson's disease: a systematic review and meta-analysis. Diabetes care. 2011;34:2614-23
6. Dunn L, Allen GF, Mamais A, Ling H, Li A, Duberley KE. et al. Dysregulation of glucose metabolism is an early event in sporadic Parkinson's disease. Neurobiology of aging. 2014;35:1111-5
7. De Pablo-Fernandez E, Goldacre R, Pakpoor J, Noyce AJ, Warner TT. Association between diabetes and subsequent Parkinson disease: A record-linkage cohort study. Neurology. 2018;91:e139-e42
8. Schernhammer E, Hansen J, Rugbjerg K, Wermuth L, Ritz B. Diabetes and the risk of developing Parkinson's disease in Denmark. Diabetes care. 2011;34:1102-8
9. Yang Y-W, Hsieh T-F, Li C-I, Liu C-S, Lin W-Y, Chiang J-H. et al. Increased risk of Parkinson disease with diabetes mellitus in a population-based study. Medicine. 2017;96:e5921-e
10. Bosco D, Plastino M, Cristiano D, Colica C, Ermio C, De Bartolo M. et al. Dementia is associated with insulin resistance in patients with Parkinson's disease. Journal of the neurological sciences. 2012;315:39-43
11. Xu Q, Park Y, Huang X, Hollenbeck A, Blair A, Schatzkin A. et al. Diabetes and risk of Parkinson's disease. Diabetes care. 2011;34:910-5
12. Scheuing N, Best F, Dapp A, Dreyhaupt I, Filz H-P, Krakow D. et al. Multicentre analysis of 178,992 type 2 diabetes patients revealed better metabolic control despite higher rates of hypertension, stroke, dementia and repeated inpatient care in patients with comorbid Parkinson's disease. Parkinsonism & related disorders. 2013;19:687-92
13. Kotagal V, Albin RL, Müller MLTM, Koeppe RA, Frey KA, Bohnen NI. Diabetes is associated with postural instability and gait difficulty in Parkinson disease. Parkinsonism & related disorders. 2013;19:522-6
14. Van Woert MH, Mueller PS. Glucose, insulin, and free fatty acid metabolism in Parkinson's disease treated with levodopa. Clinical pharmacology and therapeutics. 1971;12:360-7
15. Wahlqvist ML, Lee M-S, Hsu C-C, Chuang S-Y, Lee J-T, Tsai H-N. Metformin-inclusive sulfonylurea therapy reduces the risk of Parkinson's disease occurring with Type 2 diabetes in a Taiwanese population cohort. Parkinsonism & related disorders. 2012;18:753-8
16. Brauer R, Bhaskaran K, Chaturvedi N, Dexter DT, Smeeth L, Douglas I. Glitazone Treatment and Incidence of Parkinson's Disease among People with Diabetes: A Retrospective Cohort Study. PLoS medicine. 2015;12:e1001854-e
17. Athauda D, Maclagan K, Skene SS, Bajwa-Joseph M, Letchford D, Chowdhury K. et al. Exenatide once weekly versus placebo in Parkinson's disease: a randomised, double-blind, placebo-controlled trial. Lancet (London, England). 2017;390:1664-75
18. Lipman IJ, Boykin ME, Flora RE. Glucose intolerance in Parkinson's disease. J Chronic Dis. 1974;27:573-9
19. Vicente Miranda H, El-Agnaf OMA, Outeiro TF. Glycation in Parkinson's disease and Alzheimer's disease. Movement disorders: official journal of the Movement Disorder Society. 2016;31:782-90
20. Dalfó E, Portero-Otín M, Ayala V, Martínez A, Pamplona R, Ferrer I. Evidence of oxidative stress in the neocortex in incidental Lewy body disease. J Neuropathol Exp Neurol. 2005;64:816-30
21. Westermark P, Andersson A, Westermark GT. Islet amyloid polypeptide, islet amyloid, and diabetes mellitus. Physiol Rev. 2011;91:795-826
22. Gautier L, Cope L, Bolstad BM, Irizarry RA. affy-analysis of Affymetrix GeneChip data at the probe level. Bioinformatics (Oxford, England). 2004;20:307-15
23. Ritchie ME, Phipson B, Wu D, Hu Y, Law CW, Shi W. et al. limma powers differential expression analyses for RNA-sequencing and microarray studies. Nucleic acids research. 2015;43:e47-e
24. Konishi T. Principal component analysis for designed experiments. BMC bioinformatics. 2015;16(Suppl 1):S7-S
25. Chen H, Boutros PC. VennDiagram: a package for the generation of highly-customizable Venn and Euler diagrams in R. BMC bioinformatics. 2011;12:35 -
26. Yu G, Wang L-G, Han Y, He Q-Y. clusterProfiler: an R package for comparing biological themes among gene clusters. Omics: a journal of integrative biology. 2012;16:284-7
27. Yu G, He Q-Y. ReactomePA: an R/Bioconductor package for reactome pathway analysis and visualization. Molecular bioSystems. 2016;12:477-9
28. Szklarczyk D, Franceschini A, Wyder S, Forslund K, Heller D, Huerta-Cepas J. et al. STRING v10: protein-protein interaction networks, integrated over the tree of life. Nucleic acids research. 2015;43:D447-D52
29. Shannon P, Markiel A, Ozier O, Baliga NS, Wang JT, Ramage D. et al. Cytoscape: a software environment for integrated models of biomolecular interaction networks. Genome research. 2003;13:2498-504
30. Chin C-H, Chen S-H, Wu H-H, Ho C-W, Ko M-T, Lin C-Y. cytoHubba: identifying hub objects and sub-networks from complex interactome. BMC systems biology. 2014;8(Suppl 4):S11-S
31. Bader GD, Hogue CWV. An automated method for finding molecular complexes in large protein interaction networks. BMC bioinformatics. 2003;4:2 -
32. Janky Rs, Verfaillie A, Imrichová H, Van de Sande B, Standaert L, Christiaens V. et al. iRegulon: from a gene list to a gene regulatory network using large motif and track collections. PLoS computational biology. 2014;10:e1003731-e
33. Harrison IF, Dexter DT. Epigenetic targeting of histone deacetylase: therapeutic potential in Parkinson's disease? Pharmacology & therapeutics. 2013;140:34-52
34. Kitada M, Ogura Y, Monno I, Koya D. Sirtuins and Type 2 Diabetes: Role in Inflammation, Oxidative Stress, and Mitochondrial Function. Frontiers in endocrinology. 2019;10:187 -
35. Doria M, Maugest L, Moreau T, Lizard G, Vejux A. Contribution of cholesterol and oxysterols to the pathophysiology of Parkinson's disease. Free radical biology & medicine. 2016;101:393-400
36. Liu J-X, Liu J, Li P-Q, Xie X-D, Guo Q, Tian L-M. et al. Association of sterol regulatory element-binding protein-1c gene polymorphism with type 2 diabetes mellitus, insulin resistance and blood lipid levels in Chinese population. Diabetes research and clinical practice. 2008;82:42-7
37. Gross B, Pawlak M, Lefebvre P, Staels B. PPARs in obesity-induced T2DM, dyslipidaemia and NAFLD. Nature reviews Endocrinology. 2017;13:36-49
38. Agarwal S, Yadav A, Chaturvedi RK. Peroxisome proliferator-activated receptors (PPARs) as therapeutic target in neurodegenerative disorders. Biochemical and biophysical research communications. 2017;483:1166-77
39. Bourque M, Morissette M, Di Paolo T. Repurposing sex steroids and related drugs as potential treatment for Parkinson's disease. Neuropharmacology. 2019;147:37-54
40. Gopal RA, Bothra N, Acharya SV, Ganesh HK, Bandgar TR, Menon PS. et al. Treatment of hypogonadism with testosterone in patients with type 2 diabetes mellitus. Endocrine practice: official journal of the American College of Endocrinology and the American Association of Clinical Endocrinologists. 2010;16:570-6
41. Vegeto E, Villa A, Della Torre S, Crippa V, Rusmini P, Cristofani R. et al. The Role of Sex and Sex Hormones in Neurodegenerative Diseases. Endocrine reviews. 2020;41:bnz005-bnz
42. Liu S, Sun Q. Sex differences, endogenous sex-hormone hormones, sex-hormone binding globulin, and exogenous disruptors in diabetes and related metabolic outcomes. Journal of diabetes. 2018;10:428-41
43. Tan NY, Khachigian LM. Sp1 phosphorylation and its regulation of gene transcription. Molecular and cellular biology. 2009;29:2483-8
44. Solomon SS, Majumdar G, Martinez-Hernandez A, Raghow R. A critical role of Sp1 transcription factor in regulating gene expression in response to insulin and other hormones. Life sciences. 2008;83:305-12
45. Wang J, Song W. Regulation of LRRK2 promoter activity and gene expression by Sp1. Molecular brain. 2016;9:33 -
46. Yao L, Dai X, Sun Y, Wang Y, Yang Q, Chen X. et al. Inhibition of transcription factor SP1 produces neuroprotective effects through decreasing MAO B activity in MPTP/MPP(+) Parkinson's disease models. Journal of neuroscience research. 2018;96:1663-76
47. Santiago JA, Potashkin JA. Integrative network analysis unveils convergent molecular pathways in Parkinson's disease and diabetes. PLoS ONE. 2013;8:e83940
48. Tam V, Patel N, Turcotte M, Bossé Y, Paré G, Meyre D. Benefits and limitations of genome-wide association studies. Nat Rev Genet. 2019;20:467-84
49. Casamassimi A, Federico A, Rienzo M, Esposito S, Ciccodicola A. Transcriptome Profiling in Human Diseases: New Advances and Perspectives. Int J Mol Sci. 2017 18
50. Hao J-S, Zhu C-J, Yan B-Y, Yan C-Y, Ling R. Stimulation of KLF14/PLK1 pathway by thrombin signaling potentiates endothelial dysfunction in Type 2 diabetes mellitus. Biomedicine & pharmacotherapy = Biomedecine & pharmacotherapie. 2018;99:859-66
51. Chen L-L, Wang Y-B, Song J-X, Deng W-K, Lu J-H, Ma L-L. et al. Phosphoproteome-based kinase activity profiling reveals the critical role of MAP2K2 and PLK1 in neuronal autophagy. Autophagy. 2017;13:1969-80
52. Osawa H, Yamada K, Onuma H, Murakami A, Ochi M, Kawata H. et al. The G/G genotype of a resistin single-nucleotide polymorphism at -420 increases type 2 diabetes mellitus susceptibility by inducing promoter activity through specific binding of Sp1/3. American journal of human genetics. 2004;75:678-86
53. Lim M, Park L, Shin G, Hong H, Kang I, Park Y. Induction of apoptosis of Beta cells of the pancreas by advanced glycation end-products, important mediators of chronic complications of diabetes mellitus. Annals of the New York Academy of Sciences. 2008;1150:311-5
54. Xia N, Zhang Q, Wang ST, Gu L, Yang HM, Liu L. et al. Blockade of metabotropic glutamate receptor 5 protects against DNA damage in a rotenone-induced Parkinson's disease model. Free radical biology & medicine. 2015;89:567-80
55. Jang H, Lee GY, Selby CP, Lee G, Jeon YG, Lee JH. et al. SREBP1c-CRY1 signalling represses hepatic glucose production by promoting FOXO1 degradation during refeeding. Nature communications. 2016;7:12180 -
56. Wu X, Yu T, Ji N, Huang Y, Gao L, Shi W. et al. IL6R inhibits viability and apoptosis of pancreatic beta-cells in type 2 diabetes mellitus via regulation by miR-22 of the JAK/STAT signaling pathway. Diabetes, metabolic syndrome and obesity: targets and therapy. 2019;12:1645-57
57. Zhuang X, Chen Y, Zhuang X, Chen T, Xing T, Wang W. et al. Contribution of Pro-inflammatory Cytokine Signaling within Midbrain Periaqueductal Gray to Pain Sensitivity in Parkinson's Disease via GABAergic Pathway. Frontiers in neurology. 2016;7:104 -
Author contact
![]() Corresponding authors: Siguang Li, Stem Cell Translational Research Center, Tongji Hospital, Tongji University School of Medicine, Shanghai 200065, China, E-mail: siguanglicom; Lingjing Jin, Department of Neurology, Tongji Hospital, Tongji University School of Medicine, Shanghai 200065, China. E-mail: lingjingjincom.
Corresponding authors: Siguang Li, Stem Cell Translational Research Center, Tongji Hospital, Tongji University School of Medicine, Shanghai 200065, China, E-mail: siguanglicom; Lingjing Jin, Department of Neurology, Tongji Hospital, Tongji University School of Medicine, Shanghai 200065, China. E-mail: lingjingjincom.