Impact Factor ISSN: 1449-1907

 Global reach, higher impact
Int J Med Sci 2020; 17(2):191-206. doi:10.7150/ijms.39261 This issue Cite
Research Paper
Epigenome-wide analysis of common warts reveals aberrant promoter methylation
Laith N. AL-Eitan1,2 ![]() , Mansour A. Alghamdi3, Amneh H. Tarkhan1, Firas A. Al-Qarqaz4,5
, Mansour A. Alghamdi3, Amneh H. Tarkhan1, Firas A. Al-Qarqaz4,5
1. Department of Applied Biological Sciences, Jordan University of Science and Technology, Irbid 22110, Jordan
2. Department of Biotechnology and Genetic Engineering, Jordan University of Science and Technology, Irbid 22110, Jordan
3. Department of Anatomy, College of Medicine, King Khalid University, Abha 61421, Saudi Arabia
4. Department of Internal Medicine, Jordan University of Science and Technology, Irbid 22110, Jordan
5. Division of Dermatology, Department of Internal Medicine, King Abdullah University Hospital, Jordan University of Science and Technology, Irbid 22110, Jordan
Received 2019-8-12; Accepted 2019-12-8; Published 2020-1-14
Abstract
Epigenetic alteration of host DNA is a common occurrence in both low- and high-risk human papillomavirus (HPV) infection. Although changes in promoter methylation have been widely studied in HPV-associated cancers, they have not been the subject of much investigation in HPV-induced warts, which are a temporary manifestation of HPV infection. The present study sought to examine the differences in promoter methylation between warts and normal skin. To achieve this, DNA was extracted from 24 paired wart and normal skin samples and inputted into the Infinium MethylationEPIC BeadChip microarray. Differential methylation analysis revealed a clear pattern of hyper- and hypomethylation in warts compared to normal skin, and the most differentially methylated promoters were found within the EIF3EP2, CYSLTR1, C10orf99, KRT6B, LAMA4, and H3F3B genes as well as the C9orf30 pseudogene. Moreover, pathway analysis showed that the H3F3A, CDKN1A, and MAPK13 genes were the most common regulators among the most differentially methylated promoters. Since the tissue samples were excised from active warts, however, this differential methylation could either be a cellular response to HPV infection or an HPV-driven process to establish the wart and/or promote disease progression. Conclusively, it is apparent that HPV infection alters the methylation status of certain genes to possibly initiate the formation of a wart and maintain its presence.
Keywords: wart, HPV, methylation, promoter, epigenetics
Introduction
Epigenetics is the study of heritable changes in gene expression that are not caused by changes to the DNA sequence itself, but by covalent modifications such as DNA methylation (DNA-M) [1]. Mammalian DNA-M, which primarily involves the addition of a methyl group to a cytosine base in a CpG dinucleotide, results in increased gene expression when it occurs at higher levels within the gene's body instead of its promoter region [2]. On a similar note, promoter methylation is of particular epigenetic importance because the vast majority of those located upstream of a gene contain a CpG island, the latter of which is a region with a high concentration of CpG sites [3]. In contrast to the hypermethylated CpG sites scattered throughout the human genome, CpG islands are not methylated, and the methylation of CpG islands initiates remodeling mechanisms that ultimately result in gene silencing [4, 5].
The methylation status of promoters is integral to maintaining normal expression levels of the genes they regulate. In fact, promoter hypermethylation is a key part of cancer development and progression, as it results in the silencing of tumor suppressor gene expression [6]. In addition, host promoter hypermethylation has also been implicated in infections by both oncogenic and non-oncogenic viruses such as the human papillomaviruses (HPV) [7]. HPV comprises a family of double-stranded DNA viruses that exclusively infect the basal epithelium of the skin and mucosa [8]. The majority of HPV infections are asymptomatic and resolve without the need for medical intervention but, depending on the individual and the HPV type, can also result in a number of malignancies and dermatological diseases [9]. One such condition is the wart, which arises due to the benign proliferation of HPV-infected epithelial keratinocytes [10]. The most prevalent type of wart is the common wart, which accounts for nearly 70% of all cutaneous warts encountered in clinical settings [11]. As a result of their benign nature, common warts are subject to a much lesser degree of scrutiny than other HPV-associated diseases.
The impermanent nature of cutaneous warts strongly suggests that epigenetic changes are involved in the mechanism of wart formation and their eventual disappearance. However, a paucity of information exists regarding the methylation status of cutaneous warts, especially in the context of the promotor regions. Therefore, the primary objective of the current study was to provide an exploratory survey of the genome-wide changes in promoter methylation patterns in cutaneous warts compared to healthy skin.
Materials and Methods
Study participants
Ethical approval to conduct this study was obtained from Jordan University of Science and Technology's (JUST) Institutional Review Board (IRB). Twelve Arab males presenting with common warts were recruited from the general population after providing written informed consent. Shave biopsies of common warts and adjacent normal skin were performed, allowing paired tissue samples (wart and normal skin) to be obtained from each participant.
Whole genome bisulfite sequencing
A QIAamp DNA Mini Kit (Qiagen, Germany) was used to perform DNA extraction, and optional RNase A digestion was incorporated. DNA purity and integrity were determined by means of the BioTek PowerWave XS2 Spectrophotometer (BioTek Instruments, Inc., USA) and agarose gel electrophoresis, respectively. Genomic DNA that fulfilled our standards for quality and quantity were shipped on dry ice to the Australian Genome Research Facility (AGRF) in Melbourne, where the quality was further ascertained by the QuantiFluor® dsDNA System (Promega, USA). The Zymo EZ DNA Methylation Kit (Zymo Research, USA) was utilized in order to perform bisulfite conversion on the 24 samples. Lastly, the samples were inputted into the Infinium MethylationEPIC BeadChip microarray (Illumina, USA) for a genome-wide interrogation of over 850,000 CpG sites.
Data processing
RnBeads, a computational R package, was adapted to process and analyze the raw intensity data (IDAT files) from the BeadChip [12]. Quality control, preprocessing, batch effects adjustment, and normalization were carried out on all probes and samples according to the RnBeads package pipeline.
Differential methylation and statistical analysis
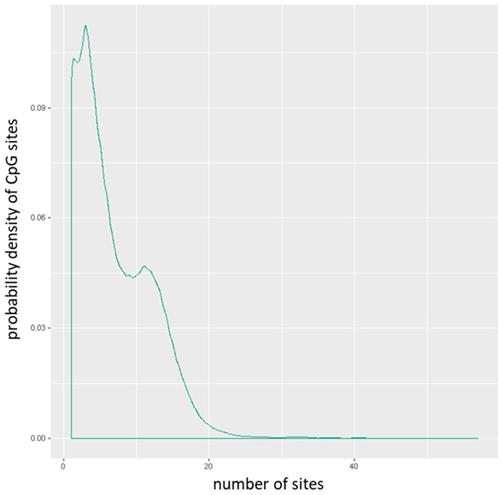
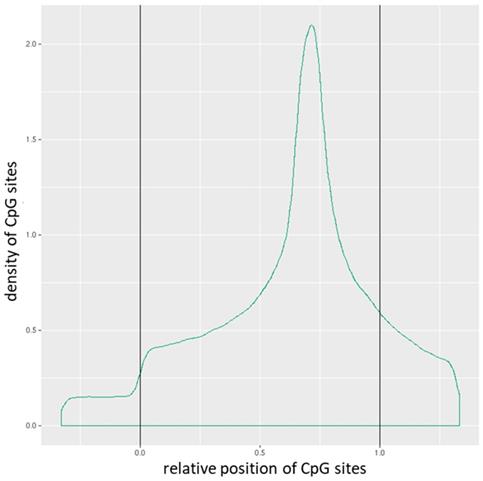
The mean of the mean β (mean.mean β) values of all the interrogated CpG sites in each promoter were computed. The distribution of CpG sites per promoter is shown in Figure 1, while Figure 2 depicts the distribution of CpG sites across promoters. DM for each promoter was calculated using the following three measures: the mean.mean β difference between warts (W) and normal skin (NS), the log2 of the mean quotient in β means across all CpG sites in a promoter, and the adjusted combined p-value of all CpG sites in the promoter using a limma statistical test [12, 13]. Furthermore, these three measures were used to create a combined ranking, in which promoters that exhibit more DM are assigned a lower combined rank [12]. Promoters were sorted from smallest to largest using the combined rank score, and the top-ranking 1000 DM promoters were selected for further analysis. In order to correct for multiple testing, the Benjamini-Hochberg procedure was utilized to set the false discovery rate (FDR) at 5%.
Distribution of CpG sites per promoter.
Distribution of CpG sites across promoters. The relative coordinates of 0 and 1 correspond to the start and end coordinates of promoters. Coordinates smaller than 0 and greater than 1 denote flanking regions normalized by region length.
Gene ontology enrichment analysis
Enrichment analysis for gene ontology (GO) terms associated with the top-ranking 500 DM promoters was performed using the GO consortium [14].
Signaling pathway analysis
A signaling network of the top-ranking 1000 DM promoters was investigated using the SIGnaling Network Open Resource (SIGNOR) 2.0 [15]. Due to the large number of connections, the type of relation was selected to only include 'direct' interactions with a relaxed layout and a score of '0.0'.
Results
Sample clustering based on methylation data
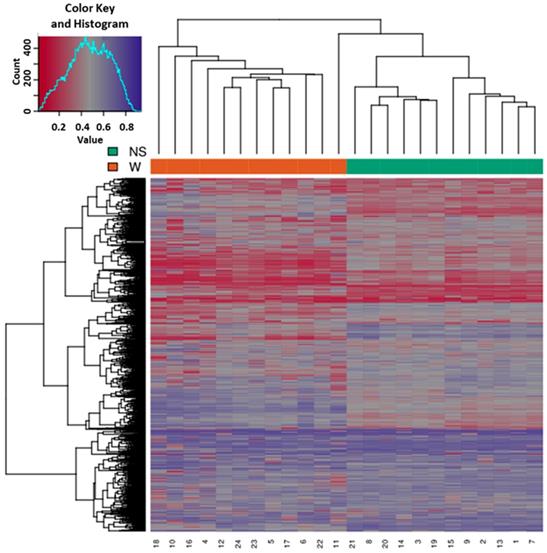
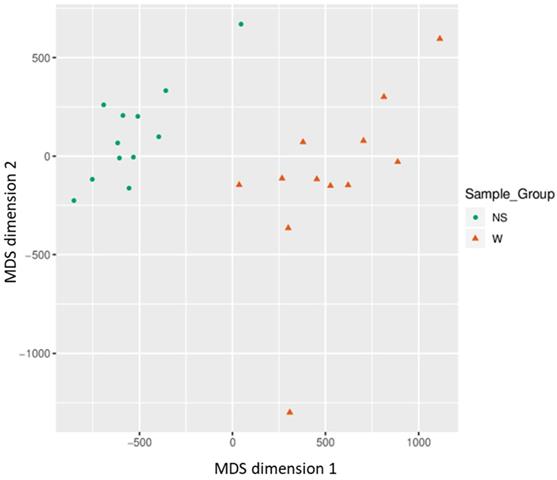
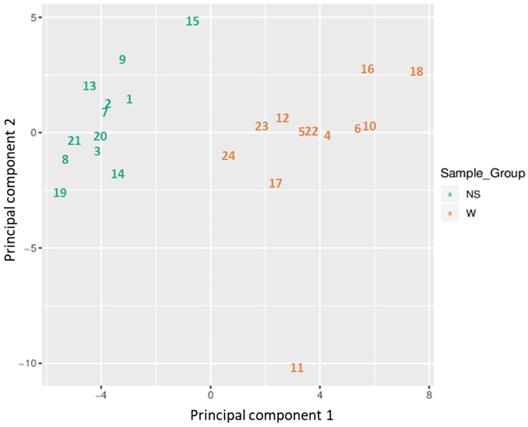
Based on all methylation values of the top-ranking 1000 DM promoters, the 24 samples showed an expected clustering pattern, as samples with similar methylation patterns or phenotypes tended to cluster together (Figure 3). In addition, the dimension reduction test was applied to the dataset using multidimensional scaling (MDS) and principal component analysis (PCA) in order to inspect for a strong signal in the methylation values of the samples (Figures 4 and 5). MDS and PCA confirmed that the difference between wart (W) and normal skin (NS) samples predominated the analysis.
Heatmap showing the hierarchical clustering of samples displaying only the top-ranking 1000 most variable promoters with the highest variance across all samples. Clustering utilized complete linkage and Manhattan distance. The top x-axis shows the normal skin (NS) and wart (W) samples, while the bottom x-axis shows the patient identification number. Values of 0 (red color) and 1 (purple color) indicate decreased and increased methylation, respectively.
Two-dimensional scatterplot illustrating sample positions after the application of Kruskal's non-metric multidimensional scaling based on the matrix of average methylation and Manhattan distance.
Two-dimensional scatterplot showing sample positions after principal component analysis.
Differential methylation of promoters
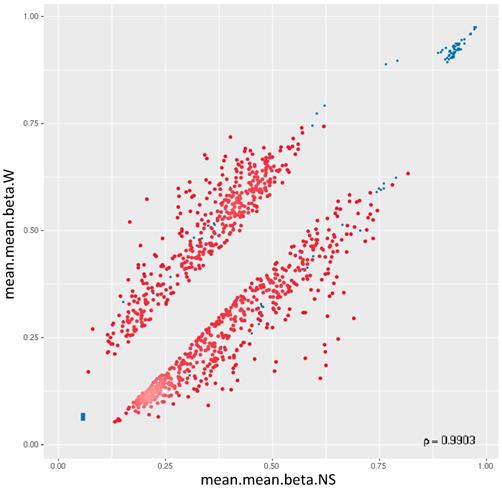
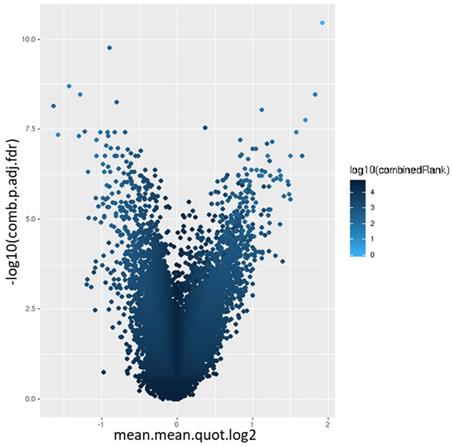
44,929 genomic identifiers passed the quality control and pre-processing steps, including some identifiers that did not map to gene symbols or which were not assigned (NA). Genomic identifiers without symbols were then removed, leaving 27,790 with symbols. The list of DM promoters in warts was limited to the top-ranking 1000 DM promoters using the combined rank score. Using this scoring method, a total of 576 and 424 promoters were found to be hypomethylated and hypermethylated, respectively, in warts (W) compared to normal skin (NS), with a mean β difference =>0.064 and =< -0.064 and p-value =< 0.001 (adjusted p-value =<0.007) (Figure 6). Among the 576 hypomethylated promoters, the β difference ranged from -0.064 to -0.458, while the mean β difference ranged between 0.064 and 0.367 for the 424 hypermethylated promoters. The log2 of the quotient in methylation between warts and normal skin had a maximum value of 1.633 and minimum value of -1.924 (Figure 7). The top-ranking 100 DM promoters with the lowest combined rank score are shown in Table 1.
The 100 top-ranking promoters based on combined ranking score.
| Gene | Gene symbol | Category | RNA class | Chromosome | mean.mean β value (NS) | mean.mean β value (W) | mean.mean β value diff. (W-NS) | mean.mean. quot.log2 | comb.p.val | comb.p.adj. (FDR) | Combined rank |
|---|---|---|---|---|---|---|---|---|---|---|---|
| ENSG00000224674 | EIF3EP2 | Pseudogene | 2 | 0.611 | 0.154 | -0.458 | -1.924 | 7.832E-16 | 3.519E-11 | 1 | |
| ENSG00000263368 | AC069366.1 | Pseudogene | antisense | 17 | 0.206 | 0.573 | 0.367 | 1.431 | 1.336E-13 | 2.001E-09 | 14 |
| ENSG00000173198 | CYSLTR1 | Protein coding | X | 0.166 | 0.520 | 0.353 | 1.580 | 1.671E-11 | 4.415E-08 | 17 | |
| ENSG00000266228 | MIR3611 | RNA gene | miRNA | 10 | 0.403 | 0.128 | -0.275 | -1.584 | 1.083E-11 | 3.744E-08 | 27 |
| ENSG00000267125 | AC012615.3 | RNA gene | 19 | 0.192 | 0.465 | 0.273 | 1.280 | 3.531E-13 | 3.410E-09 | 29 | |
| ENSG00000270808 | AC022400.4 | Pseudogene | lncRNA | 10 | 0.691 | 0.295 | -0.396 | -1.202 | 1.686E-10 | 1.756E-07 | 40 |
| ENSG00000241114 | AC008280.2 | Pseudogene | 2 | 0.383 | 0.129 | -0.254 | -1.503 | 1.876E-10 | 1.756E-07 | 47 | |
| ENSG00000272156 | AC008280.3 | RNA gene | 2 | 0.383 | 0.129 | -0.254 | -1.503 | 1.876E-10 | 1.756E-07 | 47 | |
| ENSG00000207258 | RF00019 | RNA gene | Y RNA | 1 | 0.508 | 0.192 | -0.315 | -1.356 | 6.373E-10 | 4.522E-07 | 62 |
| ENSG00000226545 | AL357552.1 | Pseudogene | 1 | 0.508 | 0.192 | -0.315 | -1.356 | 6.373E-10 | 4.522E-07 | 62 | |
| ENSG00000270002 | AC022028.2 | RNA gene | 10 | 0.458 | 0.199 | -0.259 | -1.056 | 5.656E-10 | 4.246E-07 | 70 | |
| ENSG00000227096 | HMGB3P8 | Pseudogene | 10 | 0.653 | 0.246 | -0.408 | -1.376 | 1.138E-09 | 6.141E-07 | 82 | |
| ENSG00000250532 | AC021180.1 | RNA gene | 4 | 0.621 | 0.233 | -0.388 | -1.378 | 1.576E-09 | 7.956E-07 | 89 | |
| ENSG00000254653 | AC024475.1 | RNA gene | 11 | 0.228 | 0.440 | 0.212 | 1.071 | 1.411E-10 | 1.756E-07 | 99 | |
| ENSG00000265503 | MIR1269B | RNA gene | miRNA | 17 | 0.346 | 0.141 | -0.205 | -1.239 | 1.140E-09 | 6.141E-07 | 109 |
| ENSG00000238024 | DDX39BP2 | Pseudogene | 6 | 0.326 | 0.124 | -0.202 | -1.323 | 1.391E-09 | 7.248E-07 | 113 | |
| ENSG00000273044 | AL022334.2 | RNA gene | 22 | 0.243 | 0.481 | 0.238 | 0.956 | 1.766E-10 | 1.756E-07 | 119 | |
| ENSG00000234105 | AC009468.2 | RNA gene | 7 | 0.576 | 0.307 | -0.269 | -0.961 | 3.100E-09 | 1.151E-06 | 121 | |
| ENSG00000188373 | C10orf99 | Protein coding | 10 | 0.400 | 0.202 | -0.198 | -0.982 | 5.786E-10 | 4.262E-07 | 124 | |
| ENSG00000271597 | AC112230.1 | Pseudogene | lncRNA | 2 | 0.306 | 0.594 | 0.287 | 0.933 | 3.019E-09 | 1.151E-06 | 136 |
| ENSG00000271265 | AL355297.3 | RNA gene | lncRNA | 6 | 0.347 | 0.667 | 0.320 | 0.924 | 1.317E-11 | 3.856E-08 | 145 |
| ENSG00000244286 | ITGB5-AS1 | RNA gene | ncRNA | 3 | 0.202 | 0.393 | 0.190 | 1.223 | 8.912E-12 | 3.640E-08 | 152 |
| ENSG00000226403 | AL392089.1 | RNA gene | 9 | 0.080 | 0.269 | 0.189 | 1.633 | 1.086E-12 | 6.969E-09 | 154 | |
| ENSG00000234936 | AC010883.1 | RNA gene | 2 | 0.288 | 0.498 | 0.210 | 0.909 | 2.020E-11 | 4.908E-08 | 158 | |
| ENSG00000203527 | Z99756.1 | RNA gene | ncRNA | 22 | 0.385 | 0.198 | -0.187 | -0.906 | 5.290E-09 | 1.674E-06 | 161 |
| ENSG00000242147 | AL365356.5 | RNA gene | ncRNA | 10 | 0.334 | 0.148 | -0.186 | -1.263 | 3.506E-11 | 7.161E-08 | 166 |
| ENSG00000270781 | AC091133.5 | Pseudogene | 17 | 0.416 | 0.219 | -0.197 | -0.896 | 4.980E-10 | 3.925E-07 | 170 | |
| ENSG00000250282 | AC002401.2 | RNA gene | 17 | 0.225 | 0.443 | 0.217 | 0.894 | 3.488E-09 | 1.234E-06 | 174 | |
| ENSG00000255158 | AC131934.1 | RNA gene | 11 | 0.299 | 0.590 | 0.291 | 0.977 | 1.016E-08 | 2.625E-06 | 174 | |
| ENSG00000232486 | AL592437.2 | Pseudogene | 9 | 0.666 | 0.354 | -0.312 | -0.892 | 1.930E-09 | 8.758E-07 | 175 | |
| ENSG00000262067 | AC120057.1 | Pseudogene | lncRNA | 17 | 0.505 | 0.171 | -0.333 | -1.505 | 1.139E-08 | 2.816E-06 | 181 |
| ENSG00000266258 | LINC01909 | RNA gene | ncRNA | 18 | 0.629 | 0.299 | -0.330 | -1.048 | 1.479E-08 | 3.408E-06 | 195 |
| ENSG00000257496 | AC025031.1 | RNA gene | 12 | 0.217 | 0.397 | 0.180 | 0.982 | 1.649E-08 | 3.703E-06 | 200 | |
| ENSG00000185479 | KRT6B | Protein-coding | 12 | 0.340 | 0.166 | -0.174 | -1.045 | 7.004E-11 | 1.124E-07 | 216 | |
| ENSG00000270255 | AC009884.2 | Pseudogene | 8 | 0.279 | 0.529 | 0.250 | 0.900 | 2.221E-08 | 4.587E-06 | 217 | |
| ENSG00000167751 | KLK2 | Protein coding | 19 | 0.328 | 0.136 | -0.192 | -1.214 | 2.772E-08 | 5.463E-06 | 227 | |
| ENSG00000268518 | AC020909.2 | RNA gene | 19 | 0.432 | 0.238 | -0.194 | -0.839 | 2.897E-11 | 6.197E-08 | 229 | |
| ENSG00000243795 | LINC02044 | RNA gene | ncRNA | 3 | 0.387 | 0.663 | 0.276 | 0.825 | 1.229E-11 | 3.856E-08 | 246 |
| ENSG00000267632 | AC067852.3 | RNA gene | lncRNA | 17 | 0.402 | 0.719 | 0.316 | 0.821 | 1.561E-10 | 1.756E-07 | 254 |
| ENSG00000259265 | AC027088.3 | RNA gene | 15 | 0.362 | 0.195 | -0.167 | -0.918 | 2.209E-08 | 4.587E-06 | 260 | |
| ENSG00000264733 | MIR4718 | RNA gene | miRNA | 16 | 0.342 | 0.176 | -0.166 | -0.922 | 1.674E-09 | 8.164E-07 | 263 |
| ENSG00000253630 | AC026407.1 | Pseudogene | antisense | 5 | 0.537 | 0.301 | -0.236 | -0.815 | 1.148E-09 | 6.141E-07 | 264 |
| ENSG00000228918 | LINC01344 | RNA gene | ncRNA | 1 | 0.180 | 0.346 | 0.166 | 0.908 | 4.232E-10 | 3.475E-07 | 264 |
| ENSG00000232878 | DPYD-AS1 | RNA gene | ncRNA | 1 | 0.572 | 0.387 | -0.185 | -0.815 | 4.216E-08 | 7.523E-06 | 265 |
| ENSG00000112769 | LAMA4 | Protein coding | 6 | 0.325 | 0.512 | 0.187 | 0.810 | 3.888E-08 | 7.072E-06 | 269 | |
| ENSG00000237126 | AC073254.1 | RNA gene | 2 | 0.368 | 0.202 | -0.166 | -0.835 | 1.684E-08 | 3.745E-06 | 270 | |
| ENSG00000256746 | AC018410.1 | RNA gene | ncRNA | 11 | 0.344 | 0.536 | 0.192 | 0.807 | 2.084E-09 | 9.002E-07 | 271 |
| ENSG00000232560 | C21orf37 | RNA gene | ncRNA | 21 | 0.300 | 0.495 | 0.195 | 0.805 | 5.048E-08 | 8.338E-06 | 274 |
| ENSG00000198796 | ALPK2 | Protein coding | 18 | 0.165 | 0.329 | 0.163 | 0.924 | 1.006E-08 | 2.622E-06 | 286 | |
| ENSG00000185432 | METTL7A | Protein coding | 12 | 0.389 | 0.673 | 0.283 | 0.795 | 7.318E-13 | 5.480E-09 | 286 | |
| ENSG00000087076 | HSD17B14 | Protein coding | 19 | 0.145 | 0.346 | 0.201 | 1.168 | 5.925E-08 | 9.251E-06 | 287 | |
| ENSG00000239255 | AC007620.1 | Pseudogene | 3 | 0.347 | 0.575 | 0.227 | 1.085 | 6.353E-08 | 9.775E-06 | 292 | |
| ENSG00000230403 | LINC01066 | RNA gene | ncRNA | 13 | 0.475 | 0.302 | -0.173 | -0.902 | 8.129E-08 | 1.192E-05 | 306 |
| ENSG00000132475 | H3F3B | Protein coding | 17 | 0.173 | 0.358 | 0.184 | 1.003 | 8.349E-08 | 1.218E-05 | 308 | |
| ENSG00000258274 | AC012085.2 | RNA gene | ncRNA | 12 | 0.415 | 0.624 | 0.208 | 0.785 | 6.143E-11 | 1.062E-07 | 308 |
| ENSG00000244167 | AC005532.2 | Pseudogene | lncRNA | 7 | 0.488 | 0.281 | -0.207 | -0.775 | 4.380E-08 | 7.657E-06 | 324 |
| ENSG00000266740 | MIR4708 | RNA gene | miRNA | 14 | 0.240 | 0.416 | 0.177 | 0.771 | 4.844E-10 | 3.887E-07 | 328 |
| ENSG00000258657 | AL136018.1 | RNA gene | 14 | 0.448 | 0.234 | -0.213 | -0.946 | 1.163E-07 | 1.588E-05 | 329 | |
| ENSG00000186715 | MST1L | Protein coding | 1 | 0.300 | 0.145 | -0.156 | -1.006 | 6.774E-11 | 1.124E-07 | 335 | |
| ENSG00000253543 | AC083923.1 | Pseudogene | 8 | 0.277 | 0.121 | -0.156 | -1.127 | 6.441E-10 | 4.522E-07 | 339 | |
| ENSG00000261095 | AC136285.1 | RNA gene | ncRNA | 16 | 0.487 | 0.272 | -0.215 | -0.958 | 1.368E-07 | 1.803E-05 | 341 |
| ENSG00000213316 | LTC4S | Protein coding | 5 | 0.211 | 0.365 | 0.154 | 1.075 | 1.025E-08 | 2.631E-06 | 348 | |
| ENSG00000267299 | AC011444.3 | RNA gene | 19 | 0.141 | 0.300 | 0.159 | 0.752 | 2.936E-08 | 5.687E-06 | 352 | |
| ENSG00000234502 | FYTTD1P1 | Pseudogene | 9 | 0.361 | 0.180 | -0.182 | -0.969 | 1.678E-07 | 2.118E-05 | 356 | |
| ENSG00000265666 | RARA-AS1 | RNA gene | ncRNA | 17 | 0.189 | 0.339 | 0.151 | 0.868 | 1.088E-07 | 1.501E-05 | 370 |
| ENSG00000182264 | IZUMO1 | Protein coding | 19 | 0.308 | 0.468 | 0.160 | 0.737 | 3.157E-08 | 5.910E-06 | 376 | |
| ENSG00000254113 | AC090193.2 | RNA gene | 8 | 0.243 | 0.419 | 0.177 | 0.736 | 1.371E-08 | 3.276E-06 | 378 | |
| ENSG00000204933 | CD177P1 | Pseudogene | 19 | 0.375 | 0.607 | 0.232 | 0.733 | 2.798E-09 | 1.103E-06 | 382 | |
| ENSG00000110203 | FOLR3 | Protein coding | 11 | 0.536 | 0.357 | -0.180 | -0.746 | 1.990E-07 | 2.311E-05 | 387 | |
| ENSG00000266964 | FXYD1 | Protein coding | 19 | 0.299 | 0.452 | 0.154 | 0.731 | 3.068E-09 | 1.151E-06 | 391 | |
| ENSG00000221857 | AC020907.2 | RNA gene | 19 | 0.299 | 0.452 | 0.154 | 0.731 | 3.068E-09 | 1.151E-06 | 391 | |
| ENSG00000213417 | KRTAP2-4 | Protein coding | 17 | 0.471 | 0.309 | -0.163 | -0.855 | 2.328E-07 | 2.604E-05 | 401 | |
| ENSG00000254853 | AP004247.1 | Pseudogene | 11 | 0.247 | 0.100 | -0.147 | -1.221 | 3.631E-09 | 1.265E-06 | 410 | |
| ENSG00000283664; ENSG00000265375 | MIR4679-1; MIR4679-2 | RNA gene | miRNA | 10 | 0.353 | 0.589 | 0.236 | 0.722 | 1.858E-10 | 1.756E-07 | 410 |
| ENSG00000261257 | AP000821.1 | RNA gene | lncRNA | 11 | 0.394 | 0.543 | 0.149 | 0.746 | 2.524E-07 | 2.757E-05 | 411 |
| ENSG00000204880 | KRTAP4-8 | Protein coding | 17 | 0.356 | 0.198 | -0.158 | -0.823 | 2.945E-07 | 3.114E-05 | 425 | |
| ENSG00000215930 | MIR942 | RNA gene | miRNA | 1 | 0.410 | 0.266 | -0.144 | -0.782 | 8.361E-09 | 2.305E-06 | 427 |
| ENSG00000271680 | AC098935.2 | Pseudogene | antisense | 1 | 0.244 | 0.100 | -0.144 | -1.211 | 4.741E-08 | 7.978E-06 | 428 |
| ENSG00000258380 | AL356805.1 | RNA gene | 14 | 0.292 | 0.435 | 0.144 | 1.043 | 2.010E-08 | 4.354E-06 | 432 | |
| ENSG00000249717 | AC110760.2 | RNA gene | ncRNA | 4 | 0.480 | 0.694 | 0.213 | 0.707 | 5.817E-08 | 9.171E-06 | 436 |
| ENSG00000265462; ENSG00000266758 | MIR3680-1; MIR3680-2 | RNA gene | miRNA | 16 | 0.383 | 0.630 | 0.247 | 0.705 | 8.156E-10 | 5.161E-07 | 438 |
| ENSG00000263361 | MIR378H | RNA gene | miRNA | 5 | 0.411 | 0.268 | -0.143 | -0.731 | 7.162E-08 | 1.080E-05 | 443 |
| ENSG00000249483 | AC026726.1 | RNA gene | lncRNA | 5 | 0.114 | 0.257 | 0.142 | 0.852 | 1.524E-08 | 3.459E-06 | 446 |
| ENSG00000227735 | CYCSP5 | Pseudogene | antisense | 1 | 0.212 | 0.070 | -0.142 | -1.478 | 2.842E-09 | 1.110E-06 | 449 |
| ENSG00000267130 | AC008738.2 | RNA gene | 19 | 0.163 | 0.310 | 0.146 | 0.698 | 3.087E-08 | 5.835E-06 | 449 | |
| ENSG00000269480 | AC020913.2 | RNA gene | 19 | 0.388 | 0.226 | -0.162 | -0.755 | 4.211E-07 | 3.933E-05 | 481 | |
| ENSG00000260673 | AL034376.1 | RNA gene | 6 | 0.392 | 0.254 | -0.139 | -0.703 | 8.046E-08 | 1.187E-05 | 482 | |
| ENSG00000261392 | AC087190.2 | RNA gene | 16 | 0.735 | 0.481 | -0.255 | -0.681 | 2.657E-07 | 2.869E-05 | 488 | |
| ENSG00000196344 | ADH7 | Protein coding | 4 | 0.290 | 0.152 | -0.138 | -0.936 | 2.488E-07 | 2.740E-05 | 488 | |
| ENSG00000170454 | KRT75 | Protein coding | 12 | 0.467 | 0.293 | -0.175 | -0.729 | 4.448E-07 | 4.087E-05 | 489 | |
| ENSG00000254175 | IGLVI-42 | Pseudogene | 22 | 0.232 | 0.095 | -0.137 | -1.201 | 1.475E-10 | 1.756E-07 | 498 | |
| ENSG00000254073 | IGLVVII-41-1 | Pseudogene | 22 | 0.232 | 0.095 | -0.137 | -1.201 | 1.475E-10 | 1.756E-07 | 498 | |
| ENSG00000253947 | AC008705.1 | RNA gene | 5 | 0.393 | 0.582 | 0.189 | 0.677 | 1.507E-08 | 3.438E-06 | 498 | |
| ENSG00000275874 | PICSAR | RNA gene | ncRNA | 21 | 0.467 | 0.318 | -0.150 | -0.675 | 2.541E-07 | 2.757E-05 | 503 |
| ENSG00000233930 | KRTAP5-AS1 | RNA gene | ncRNA | 11 | 0.162 | 0.298 | 0.136 | 0.944 | 1.138E-08 | 2.816E-06 | 503 |
| ENSG00000188100 | FAM25A | Protein coding | 10 | 0.389 | 0.254 | -0.135 | -0.688 | 1.426E-07 | 1.862E-05 | 509 | |
| ENSG00000261078 | AC009118.1 | RNA gene | 16 | 0.250 | 0.115 | -0.135 | -1.008 | 2.220E-08 | 4.587E-06 | 513 | |
| ENSG00000259195 | AC021739.1 | Pseudogene | 15 | 0.284 | 0.149 | -0.134 | -0.927 | 4.219E-08 | 7.523E-06 | 519 | |
| ENSG00000260905 | AC009021.1 | RNA gene | 16 | 0.616 | 0.384 | -0.232 | -0.667 | 8.523E-08 | 1.235E-05 | 523 | |
| ENSG00000006831 | ADIPOR2 | Protein coding | 12 | 0.721 | 0.501 | -0.220 | -0.667 | 1.007E-07 | 1.410E-05 | 527 |
Two-dimensional scatterplot of the top-ranking 1000 DM promoters. The mean.mean β values of normal skin (NS) and warts (W) are shown on the x-axis and y-axis, respectively. The methylation β values range from 0 (unmethylated) to 1 (methylated).
Volcano plot of the promoter differential methylation quantified by the log2 of the quotient in mean.mean methylation and adjusted combined p-value between warts (W) and normal skin (NS). The color scale represents the combined ranking.
Gene ontology enrichment analysis
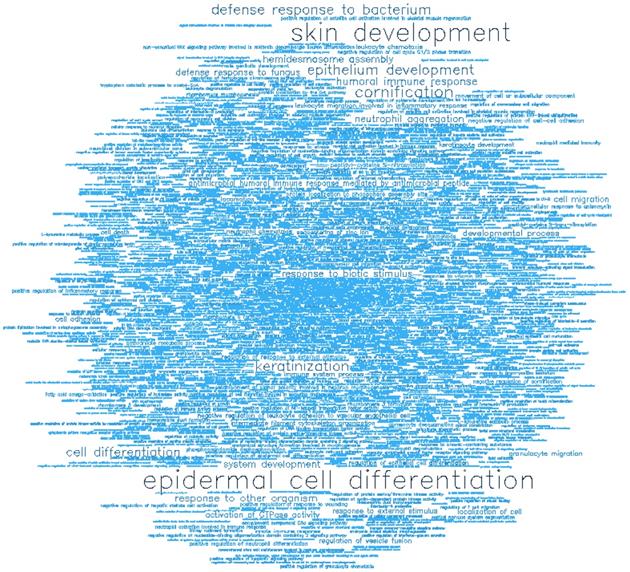
Gene ontology (GO) enrichment analysis of biological process (BP) and molecular function (MF) was conducted on the top-ranking 500 DM hypermethylated promoters (Figure 8, Figure 9, Table 2, and Table 3) and the top-ranking 500 DM hypomethylated promoters (Figure 10, Figure 11, Table 4, and Table 5).
Function and clinical relevance of the protein-coding genes containing the most differentially methylated promoters in warts
| Gene symbol | Gene name | Main physiological function |
|---|---|---|
| CYSLTR1 | Cysteinyl leukotriene receptor 1 | Mediates bronchoconstriction |
| C10orf99 | Chromosome 10 Open Reading Frame 99 | Mediates recruitment of lymphocytes to epithelia |
| KRT6B | Keratin 6B | Epithelial wound repair and inflammation |
| KLK2 | Kallikrein Related Peptidase 2 | Sperm liquefication |
| LAMA4 | Laminin Subunit Alpha 4 | Cell adhesion, differentiation, and migration |
| ALPK2 | Alpha Kinase 2 | Unknown |
| METTL7A | Methyltransferase Like 7A | Unknown |
| HSD17B14 | 17β-Hydroxysteroid dehydrogenase type 14 | Steroid metabolism |
| H3F3B | H3 Histone Family Member 3B | Found at sites of nucleosomal displacement |
| MST1L | Macrophage Stimulating 1 Like | Unknown |
| LTC4S | Leukotriene C4 Synthase | Involved in cysteinyl leukotriene biosynthesis |
| IZUMO1 | Izumo sperm-egg fusion 1 | Essential for fusion and binding of sperm and egg |
| FOLR3 | Folate receptor 3 | Mediate delivery of 5-methyltetrahydrofolate to cell interior |
| FXYD1 | FXYD Domain Containing Ion Transport Regulator 1 | Regulates ion channel activity |
| KRTAP2-4 | Keratin Associated Protein 2-4 | Involved in hair formation |
| KRTAP4-8 | Keratin Associated Protein 4-8 | Involved in hair formation |
| ADH7 | Alcohol dehydrogenase 7 | Functions in retinoic acid synthesis |
| KRT75 | Keratin 75 | Involved in hair and nail formation |
| FAM25A | Family with sequence similarity 25 member A | Unknown |
| ADIPOR2 | Adiponectin receptor 2 | Regulates glucose and lipid metabolism |
GO enrichment analysis showing the significant biological processes (BP) of the top 500 hypermethylated promoters.
| GOMFID | P-value | Odds ratio | ExpCount | Count | Size | Term |
|---|---|---|---|---|---|---|
| GO:0009913 | 0 | 11.3215 | 2.1081 | 19 | 328 | epidermal cell differentiation |
| GO:0043588 | 0 | 9.3276 | 2.6737 | 20 | 409 | skin development |
| GO:0070268 | 0 | 14.8063 | 0.7126 | 9 | 110 | cornification |
| GO:0031424 | 0 | 13.9409 | 0.664 | 8 | 111 | keratinization |
| GO:0060429 | 0 | 3.7163 | 8.1779 | 25 | 1251 | epithelium development |
| GO:0042742 | 0 | 8.0356 | 1.5624 | 11 | 239 | defense response to bacterium |
| GO:0030154 | 0 | 2.5597 | 26.423 | 49 | 4042 | cell differentiation |
| GO:0006959 | 0 | 6.7129 | 1.4905 | 9 | 228 | humoral immune response |
| GO:0051707 | 0 | 3.5529 | 5.4585 | 17 | 835 | response to other organism |
| GO:0070488 | 0 | Inf | 0.0131 | 2 | 2 | neutrophil aggregation |
| GO:0031581 | 0 | 58.5596 | 0.0719 | 3 | 11 | hemidesmosome assembly |
| GO:0009607 | 1e-04 | 3.3622 | 5.7461 | 17 | 879 | response to biotic stimulus |
| GO:0048731 | 1e-04 | 2.1729 | 30.6198 | 50 | 4684 | system development |
| GO:0050832 | 1e-04 | 17.986 | 0.2549 | 4 | 39 | defense response to fungus |
| GO:0032502 | 2e-04 | 2.0271 | 40.0921 | 59 | 6133 | developmental process |
| GO:0016477 | 2e-04 | 2.639 | 9.1062 | 21 | 1393 | cell migration |
| GO:0090630 | 3e-04 | 9.5433 | 0.5753 | 5 | 88 | activation of GTPase activity |
| GO:0061844 | 5e-04 | 11.8647 | 0.3726 | 4 | 57 | antimicrobial humoral immune response mediated by antimicrobial peptide |
| GO:0009605 | 8e-04 | 2.5057 | 8.646 | 19 | 1419 | response to external stimulus |
| GO:0051674 | 8e-04 | 2.378 | 10.0018 | 21 | 1530 | localization of cell |
| GO:0007155 | 9e-04 | 2.4699 | 8.6421 | 19 | 1322 | cell adhesion |
| GO:0031338 | 0.001 | 9.819 | 0.4445 | 4 | 68 | regulation of vesicle fusion |
| GO:0097530 | 0.001 | 7.0599 | 0.7648 | 5 | 117 | granulocyte migration |
| GO:0002376 | 0.0014 | 2.0026 | 18.1078 | 31 | 2770 | immune system process |
| GO:0002523 | 0.0018 | 38.6782 | 0.0654 | 2 | 10 | leukocyte migration involved in inflammatory response |
| GO:0030595 | 0.0019 | 4.9654 | 1.2943 | 6 | 198 | leukocyte chemotaxis |
| GO:0040011 | 0.002 | 2.1602 | 11.4792 | 22 | 1756 | locomotion |
| GO:1904995 | 0.0022 | 34.3786 | 0.0719 | 2 | 11 | negative regulation of leukocyte adhesion to vascular endothelial cell |
| GO:0045104 | 0.0023 | 12.6396 | 0.2615 | 3 | 40 | intermediate filament cytoskeleton organization |
| GO:0030593 | 0.0025 | 7.5626 | 0.5687 | 4 | 87 | neutrophil chemotaxis |
| GO:0003334 | 0.0027 | 30.9389 | 0.0784 | 2 | 12 | keratinocyte development |
| GO:0032119 | 0.0027 | 30.9389 | 0.0784 | 2 | 12 | sequestering of zinc ion |
| GO:0008219 | 0.0029 | 2.0056 | 14.1398 | 25 | 2163 | cell death |
| GO:0030856 | 0.003 | 5.4424 | 0.9806 | 5 | 150 | regulation of epithelial cell differentiation |
| GO:0018119 | 0.0032 | 28.1246 | 0.085 | 2 | 13 | peptidyl-cysteine S-nitrosylation |
| GO:0034497 | 0.0032 | 28.1246 | 0.085 | 2 | 13 | protein localization to phagophore assembly site |
| GO:0032101 | 0.0034 | 2.6778 | 4.8571 | 12 | 743 | regulation of response to external stimulus |
| GO:0022408 | 0.0036 | 5.2242 | 1.0198 | 5 | 156 | negative regulation of cell-cell adhesion |
| GO:0006928 | 0.0045 | 1.979 | 13.0285 | 23 | 1993 | movement of cell or subcellular component |
| GO:0006935 | 0.0049 | 2.8124 | 3.8177 | 10 | 584 | chemotaxis |
| GO:0045087 | 0.0051 | 2.4353 | 5.7853 | 13 | 885 | innate immune response |
| GO:0003336 | 0.0065 | Inf | 0.0065 | 1 | 1 | corneocyte desquamation |
| GO:0021593 | 0.0065 | Inf | 0.0065 | 1 | 1 | rhombomere morphogenesis |
| GO:0021660 | 0.0065 | Inf | 0.0065 | 1 | 1 | rhombomere 3 formation |
| GO:0021666 | 0.0065 | Inf | 0.0065 | 1 | 1 | rhombomere 5 formation |
| GO:0033037 | 0.0065 | Inf | 0.0065 | 1 | 1 | polysaccharide localization |
| GO:0034516 | 0.0065 | Inf | 0.0065 | 1 | 1 | response to vitamin B6 |
| GO:0035644 | 0.0065 | Inf | 0.0065 | 1 | 1 | phosphoanandamide dephosphorylation |
| GO:0043420 | 0.0065 | Inf | 0.0065 | 1 | 1 | anthranilate metabolic process |
| GO:0045660 | 0.0065 | Inf | 0.0065 | 1 | 1 | positive regulation of neutrophil differentiation |
| GO:0072046 | 0.0065 | Inf | 0.0065 | 1 | 1 | establishment of planar polarity involved in nephron morphogenesis |
| GO:0072740 | 0.0065 | Inf | 0.0065 | 1 | 1 | cellular response to anisomycin |
| GO:1905716 | 0.0065 | Inf | 0.0065 | 1 | 1 | negative regulation of cornification |
| GO:0006950 | 0.008 | 1.6938 | 24.6188 | 36 | 3766 | response to stress |
| GO:1903036 | 0.0081 | 7.7836 | 0.4118 | 3 | 63 | positive regulation of response to wounding |
| GO:0050729 | 0.0082 | 5.354 | 0.791 | 4 | 121 | positive regulation of inflammatory response |
| GO:0030539 | 0.0082 | 16.2749 | 0.1373 | 2 | 21 | male genitalia development |
| GO:1902807 | 0.0087 | 5.2634 | 0.8041 | 4 | 123 | negative regulation of cell cycle G1/S phase transition |
| GO:0045606 | 0.0098 | 14.7231 | 0.1504 | 2 | 23 | positive regulation of epidermal cell differentiation |
| GO:0001775 | 0.0099 | 2.0563 | 8.459 | 16 | 1294 | cell activation |
GO enrichment analysis showing the significant molecular functions (MF) of the top 500 hypermethylated promoters.
| GOMFID | P-value | Odds ratio | ExpCount | Count | Size | Term |
|---|---|---|---|---|---|---|
| GO:0050786 | 0 | 99.375 | 0.0655 | 4 | 11 | RAGE receptor binding |
| GO:0017137 | 1e-04 | 7.2337 | 1.0653 | 7 | 179 | Rab GTPase binding |
| GO:0035662 | 1e-04 | 340.8367 | 0.0179 | 2 | 3 | Toll-like receptor 4 binding |
| GO:0050544 | 3e-04 | 113.5986 | 0.0298 | 2 | 5 | arachidonic acid binding |
| GO:0005200 | 4e-04 | 8.9173 | 0.613 | 5 | 103 | structural constituent of cytoskeleton |
| GO:0045294 | 0.0019 | 37.8526 | 0.0655 | 2 | 11 | alpha-catenin binding |
| GO:0036041 | 0.0022 | 34.0653 | 0.0714 | 2 | 12 | long-chain fatty acid binding |
| GO:0008146 | 0.0035 | 10.7307 | 0.3035 | 3 | 51 | sulfotransferase activity |
| GO:0001856 | 0.006 | Inf | 0.006 | 1 | 1 | complement component C5a binding |
| GO:0005130 | 0.006 | Inf | 0.006 | 1 | 1 | granulocyte colony-stimulating factor receptor binding |
| GO:0030429 | 0.006 | Inf | 0.006 | 1 | 1 | kynureninase activity |
| GO:0036458 | 0.006 | Inf | 0.006 | 1 | 1 | hepatocyte growth factor binding |
| GO:0047888 | 0.006 | Inf | 0.006 | 1 | 1 | fatty acid peroxidase activity |
| GO:0061981 | 0.006 | Inf | 0.006 | 1 | 1 | 3-hydroxykynureninase activity |
| GO:1901567 | 0.0096 | 14.7995 | 0.1488 | 2 | 25 | fatty acid derivative binding |
GO enrichment analysis showing the significant biological processes (BP) of the top 500 hypomethylated promoters.
| GOMFID | P-value | Odds ratio | ExpCount | Count | Size | Term |
|---|---|---|---|---|---|---|
| GO:1901750 | 0 | 102.821 | 0.0789 | 4 | 8 | leukotriene D4 biosynthetic process |
| GO:0006751 | 0 | 82.2519 | 0.0888 | 4 | 9 | glutathione catabolic process |
| GO:0006691 | 0 | 21.5282 | 0.2861 | 5 | 29 | leukotriene metabolic process |
| GO:0046456 | 1e-04 | 12.589 | 0.4538 | 5 | 46 | icosanoid biosynthetic process |
| GO:0051572 | 3e-04 | 203.1707 | 0.0296 | 2 | 3 | negative regulation of histone H3-K4 methylation |
| GO:0006575 | 4e-04 | 4.9708 | 1.7363 | 8 | 176 | cellular modified amino acid metabolic process |
| GO:0072268 | 6e-04 | 101.5793 | 0.0395 | 2 | 4 | pattern specification involved in metanephros development |
| GO:0048762 | 9e-04 | 4.3203 | 1.9829 | 8 | 201 | mesenchymal cell differentiation |
| GO:0072081 | 9e-04 | 67.7154 | 0.0493 | 2 | 5 | specification of nephron tubule identity |
| GO:0022612 | 0.0012 | 5.4916 | 1.1739 | 6 | 119 | gland morphogenesis |
| GO:0040012 | 0.0012 | 2.2988 | 9.4409 | 20 | 957 | regulation of locomotion |
| GO:0030155 | 0.0015 | 2.5831 | 6.2347 | 15 | 632 | regulation of cell adhesion |
| GO:0030334 | 0.0016 | 2.3435 | 8.2867 | 18 | 840 | regulation of cell migration |
| GO:0051893 | 0.0018 | 8.3709 | 0.5229 | 4 | 53 | regulation of focal adhesion assembly |
| GO:0017144 | 0.0018 | 2.3773 | 7.6948 | 17 | 780 | drug metabolic process |
| GO:0048293 | 0.002 | 40.6244 | 0.0691 | 2 | 7 | regulation of isotype switching to IgE isotypes |
| GO:0086036 | 0.002 | 40.6244 | 0.0691 | 2 | 7 | regulation of cardiac muscle cell membrane potential |
| GO:0032412 | 0.002 | 3.7493 | 2.269 | 8 | 230 | regulation of ion transmembrane transporter activity |
| GO:0033598 | 0.0023 | 12.7584 | 0.2664 | 3 | 27 | mammary gland epithelial cell proliferation |
| GO:0071493 | 0.0026 | 33.8516 | 0.0789 | 2 | 8 | cellular response to UV-B |
| GO:1902041 | 0.0027 | 7.455 | 0.582 | 4 | 59 | regulation of extrinsic apoptotic signaling pathway via death domain receptors |
| GO:0035148 | 0.003 | 4.523 | 1.4107 | 6 | 143 | tube formation |
| GO:0016064 | 0.0031 | 5.4155 | 0.9865 | 5 | 100 | immunoglobulin mediated immune response |
| GO:0033689 | 0.0033 | 29.0139 | 0.0888 | 2 | 9 | negative regulation of osteoblast proliferation |
| GO:0045869 | 0.0033 | 29.0139 | 0.0888 | 2 | 9 | negative regulation of single stranded viral RNA replication via double stranded DNA intermediate |
| GO:0070383 | 0.0033 | 29.0139 | 0.0888 | 2 | 9 | DNA cytosine deamination |
| GO:0072048 | 0.0033 | 29.0139 | 0.0888 | 2 | 9 | renal system pattern specification |
| GO:0051270 | 0.0034 | 2.1328 | 9.579 | 19 | 971 | regulation of cellular component movement |
| GO:0043001 | 0.0035 | 10.9332 | 0.3058 | 3 | 31 | Golgi to plasma membrane protein transport |
| GO:0032409 | 0.0035 | 3.421 | 2.4761 | 8 | 251 | regulation of transporter activity |
| GO:0071526 | 0.0038 | 10.5555 | 0.3157 | 3 | 32 | semaphorin-plexin signaling pathway |
| GO:0043648 | 0.0038 | 5.1432 | 1.0358 | 5 | 105 | dicarboxylic acid metabolic process |
| GO:0001756 | 0.0041 | 6.6105 | 0.6511 | 4 | 66 | somitogenesis |
| GO:0009972 | 0.0041 | 25.3857 | 0.0987 | 2 | 10 | cytidine deamination |
| GO:0046087 | 0.0041 | 25.3857 | 0.0987 | 2 | 10 | cytidine metabolic process |
| GO:0035510 | 0.0041 | 10.2031 | 0.3255 | 3 | 33 | DNA dealkylation |
| GO:0048870 | 0.0043 | 1.8716 | 15.0936 | 26 | 1530 | cell motility |
| GO:0070988 | 0.0048 | 6.3043 | 0.6807 | 4 | 69 | demethylation |
| GO:0030307 | 0.0048 | 4.0729 | 1.5587 | 6 | 158 | positive regulation of cell growth |
| GO:0034754 | 0.0049 | 4.8503 | 1.095 | 5 | 111 | cellular hormone metabolic process |
| GO:0060766 | 0.005 | 22.5637 | 0.1085 | 2 | 11 | negative regulation of androgen receptor signaling pathway |
| GO:0007045 | 0.0056 | 6.0251 | 0.7103 | 4 | 72 | cell-substrate adherens junction assembly |
| GO:0060429 | 0.0058 | 1.9184 | 12.3412 | 22 | 1251 | epithelium development |
| GO:0001867 | 0.006 | 20.3061 | 0.1184 | 2 | 12 | complement activation, lectin pathway |
| GO:0016554 | 0.006 | 20.3061 | 0.1184 | 2 | 12 | cytidine to uridine editing |
| GO:0046133 | 0.006 | 20.3061 | 0.1184 | 2 | 12 | pyrimidine ribonucleoside catabolic process |
| GO:0072520 | 0.006 | 20.3061 | 0.1184 | 2 | 12 | seminiferous tubule development |
| GO:0048513 | 0.0067 | 1.5794 | 33.344 | 47 | 3380 | animal organ development |
| GO:0032101 | 0.0068 | 2.1741 | 7.3298 | 15 | 743 | regulation of response to external stimulus |
| GO:0001838 | 0.007 | 4.4295 | 1.1937 | 5 | 121 | embryonic epithelial tube formation |
| GO:0045995 | 0.007 | 4.4295 | 1.1937 | 5 | 121 | regulation of embryonic development |
| GO:0010566 | 0.007 | 18.459 | 0.1282 | 2 | 13 | regulation of ketone biosynthetic process |
| GO:0002699 | 0.007 | 3.7491 | 1.6869 | 6 | 171 | positive regulation of immune effector process |
| GO:0016053 | 0.0076 | 2.6059 | 4.0447 | 10 | 410 | organic acid biosynthetic process |
| GO:0045668 | 0.0076 | 8.0512 | 0.4045 | 3 | 41 | negative regulation of osteoblast differentiation |
| GO:0090382 | 0.0076 | 8.0512 | 0.4045 | 3 | 41 | phagosome maturation |
| GO:0050772 | 0.0077 | 5.4604 | 0.7793 | 4 | 79 | positive regulation of axonogenesis |
| GO:1901888 | 0.0081 | 5.3882 | 0.7892 | 4 | 80 | regulation of cell junction assembly |
| GO:0000722 | 0.0081 | 16.9197 | 0.1381 | 2 | 14 | telomere maintenance via recombination |
| GO:0042446 | 0.0084 | 5.3179 | 0.7991 | 4 | 81 | hormone biosynthetic process |
| GO:0001667 | 0.0085 | 2.56 | 4.1137 | 10 | 417 | ameboidal-type cell migration |
| GO:0030278 | 0.0092 | 3.5327 | 1.7856 | 6 | 181 | regulation of ossification |
| GO:0010959 | 0.0092 | 2.6793 | 3.5317 | 9 | 358 | regulation of metal ion transport |
| GO:1904062 | 0.0094 | 2.8684 | 2.9299 | 8 | 297 | regulation of cation transmembrane transport |
| GO:0000415 | 0.0099 | Inf | 0.0099 | 1 | 1 | negative regulation of histone H3-K36 methylation |
| GO:0003147 | 0.0099 | Inf | 0.0099 | 1 | 1 | neural crest cell migration involved in heart formation |
| GO:0030209 | 0.0099 | Inf | 0.0099 | 1 | 1 | dermatan sulfate catabolic process |
| GO:0035713 | 0.0099 | Inf | 0.0099 | 1 | 1 | response to nitrogen dioxide |
| GO:0044345 | 0.0099 | Inf | 0.0099 | 1 | 1 | stromal-epithelial cell signaling involved in prostate gland development |
| GO:0046901 | 0.0099 | Inf | 0.0099 | 1 | 1 | tetrahydrofolylpolyglutamate biosynthetic process |
| GO:0048694 | 0.0099 | Inf | 0.0099 | 1 | 1 | positive regulation of collateral sprouting of injured axon |
| GO:0050928 | 0.0099 | Inf | 0.0099 | 1 | 1 | negative regulation of positive chemotaxis |
| GO:0060598 | 0.0099 | Inf | 0.0099 | 1 | 1 | dichotomous subdivision of terminal units involved in mammary gland duct morphogenesis |
| GO:0061713 | 0.0099 | Inf | 0.0099 | 1 | 1 | anterior neural tube closure |
| GO:0061767 | 0.0099 | Inf | 0.0099 | 1 | 1 | negative regulation of lung blood pressure |
| GO:0071250 | 0.0099 | Inf | 0.0099 | 1 | 1 | cellular response to nitrite |
| GO:0071954 | 0.0099 | Inf | 0.0099 | 1 | 1 | chemokine (C-C motif) ligand 11 production |
| GO:0072168 | 0.0099 | Inf | 0.0099 | 1 | 1 | specification of anterior mesonephric tubule identity |
| GO:0072169 | 0.0099 | Inf | 0.0099 | 1 | 1 | specification of posterior mesonephric tubule identity |
| GO:0072184 | 0.0099 | Inf | 0.0099 | 1 | 1 | renal vesicle progenitor cell differentiation |
| GO:0072259 | 0.0099 | Inf | 0.0099 | 1 | 1 | metanephric interstitial fibroblast development |
| GO:0090246 | 0.0099 | Inf | 0.0099 | 1 | 1 | convergent extension involved in somitogenesis |
| GO:0098749 | 0.0099 | Inf | 0.0099 | 1 | 1 | cerebellar neuron development |
| GO:1900281 | 0.0099 | Inf | 0.0099 | 1 | 1 | positive regulation of CD4-positive, alpha-beta T cell costimulation |
| GO:1904328 | 0.0099 | Inf | 0.0099 | 1 | 1 | regulation of myofibroblast contraction |
| GO:1904635 | 0.0099 | Inf | 0.0099 | 1 | 1 | positive regulation of glomerular visceral epithelial cell apoptotic process |
| GO:1904877 | 0.0099 | Inf | 0.0099 | 1 | 1 | positive regulation of DNA ligase activity |
| GO:1905580 | 0.0099 | Inf | 0.0099 | 1 | 1 | positive regulation of ERBB3 signaling pathway |
| GO:1905943 | 0.0099 | Inf | 0.0099 | 1 | 1 | negative regulation of formation of growth cone in injured axon |
| GO:2000080 | 0.0099 | Inf | 0.0099 | 1 | 1 | negative regulation of canonical Wnt signaling pathway involved in controlling type B pancreatic cell proliferation |
| GO:2000184 | 0.0099 | Inf | 0.0099 | 1 | 1 | positive regulation of progesterone biosynthetic process |
| GO:2000572 | 0.0099 | Inf | 0.0099 | 1 | 1 | positive regulation of interleukin-4-dependent isotype switching to IgE isotypes |
GO enrichment analysis showing the significant molecular functions (MF) of the top 500 hypomethylated promoters.
| GOMFID | P-value | Odds ratio | ExpCount | Count | Size | Term |
|---|---|---|---|---|---|---|
| GO:0036374 | 0 | 105.3038 | 0.0575 | 3 | 6 | glutathione hydrolase activity |
| GO:0047844 | 0.0019 | 41.8516 | 0.0671 | 2 | 7 | deoxycytidine deaminase activity |
| GO:0000979 | 0.0045 | 9.855 | 0.3354 | 3 | 35 | RNA polymerase II core promoter sequence-specific DNA binding |
| GO:0004126 | 0.0057 | 20.9195 | 0.115 | 2 | 12 | cytidine deaminase activity |
| GO:0050681 | 0.0075 | 8.0828 | 0.4025 | 3 | 42 | androgen receptor binding |
| GO:0031492 | 0.0091 | 7.5041 | 0.4312 | 3 | 45 | nucleosomal DNA binding |
| GO:0003940 | 0.0096 | Inf | 0.0096 | 1 | 1 | L-iduronidase activity |
| GO:0004326 | 0.0096 | Inf | 0.0096 | 1 | 1 | tetrahydrofolylpolyglutamate synthase activity |
| GO:0004441 | 0.0096 | Inf | 0.0096 | 1 | 1 | inositol-1,4-bisphosphate 1-phosphatase activity |
| GO:0008725 | 0.0096 | Inf | 0.0096 | 1 | 1 | DNA-3-methyladenine glycosylase activity |
| GO:0008829 | 0.0096 | Inf | 0.0096 | 1 | 1 | dCTP deaminase activity |
| GO:0008841 | 0.0096 | Inf | 0.0096 | 1 | 1 | dihydrofolate synthase activity |
| GO:0031962 | 0.0096 | Inf | 0.0096 | 1 | 1 | mineralocorticoid receptor binding |
| GO:0034512 | 0.0096 | Inf | 0.0096 | 1 | 1 | box C/D snoRNA binding |
| GO:0043916 | 0.0096 | Inf | 0.0096 | 1 | 1 | DNA-7-methylguanine glycosylase activity |
| GO:0050649 | 0.0096 | Inf | 0.0096 | 1 | 1 | testosterone 6-beta-hydroxylase activity |
| GO:0052821 | 0.0096 | Inf | 0.0096 | 1 | 1 | DNA-7-methyladenine glycosylase activity |
| GO:0052822 | 0.0096 | Inf | 0.0096 | 1 | 1 | DNA-3-methylguanine glycosylase activity |
| GO:0052829 | 0.0096 | Inf | 0.0096 | 1 | 1 | inositol-1,3,4-trisphosphate 1-phosphatase activity |
| GO:0086038 | 0.0096 | Inf | 0.0096 | 1 | 1 | calcium:sodium antiporter activity involved in regulation of cardiac muscle cell membrane potential |
| GO:0031625 | 0.0096 | 2.8578 | 2.9417 | 8 | 307 | ubiquitin protein ligase binding |
Word cloud illustrating the significant biological processes (BP) associated with the top-ranking 500 hypermethylated promoters.
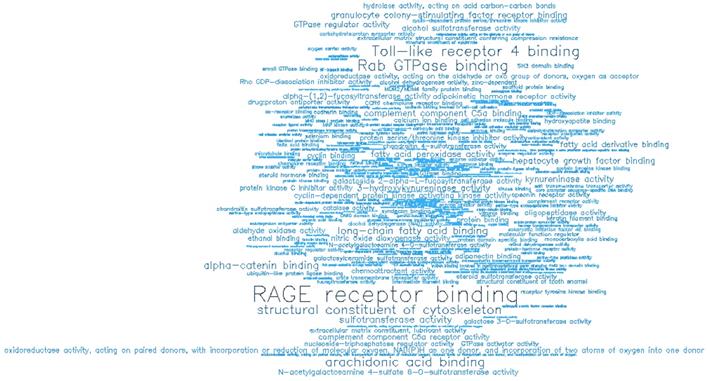
Word cloud illustrating the significant molecular functions (MF) associated with the top-ranking 500 hypermethylated promoters.
Word cloud illustrating the significant biological processes (BP) associated with the top-ranking 500 hypomethylated promoters.

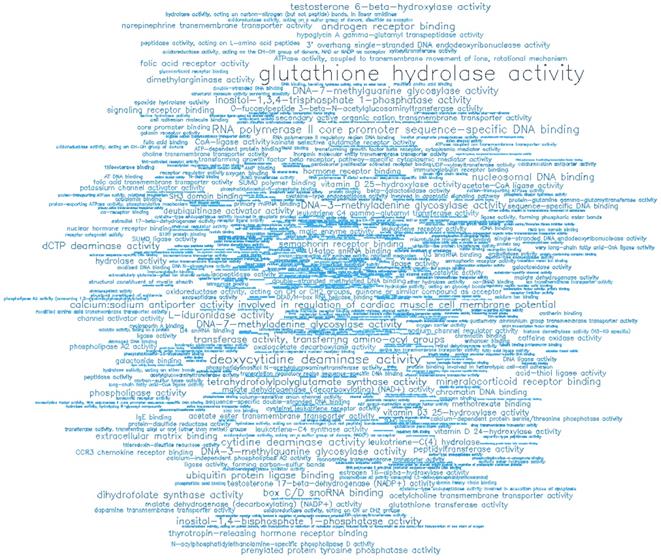
Word cloud illustrating the significant molecular functions (MF) associated with the top-ranking 500 hypomethylated promoters.
Pathway analysis
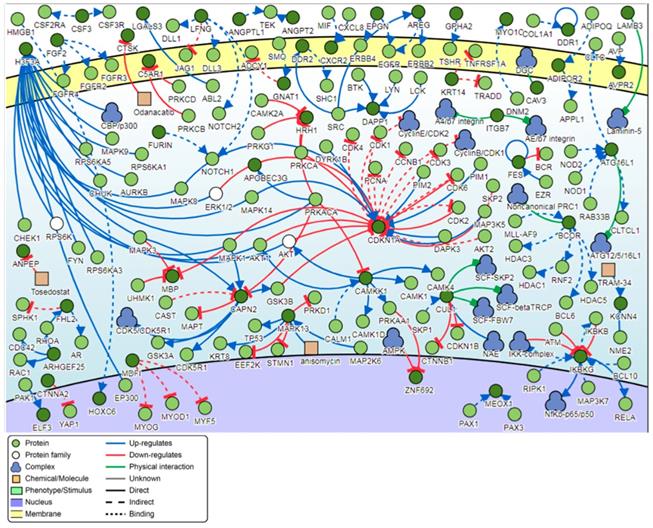
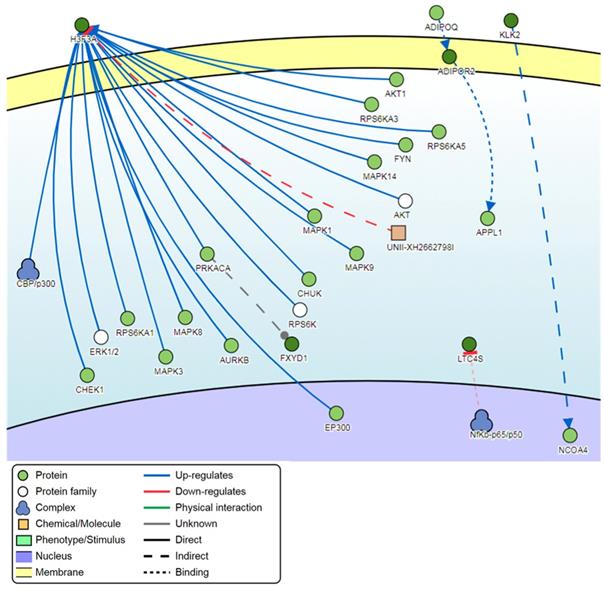
Signaling network analysis of the top-ranking 1000 DM promoters illustrated that several promoter genes were common regulators of this gene network, with a minimum of 7 direct connectivities each. These promoter genes include H3F3A, CDKN1A, MAPK13, IKBKG, CAPN2, CAMKK1 and CUL1 (Figure 12). Moreover, H3F3A was found to be the most common regulator when the signaling network analysis was carried out on the top 100 DM promoters.
Pathway signaling network generated from the top-ranking 1000 DM promoters.
Pathway signaling network generated from the top-ranking 100 DM promoters.
Discussion
To the best of the authors' knowledge, this is the first study to investigate the genome-wide changes in promoter methylation patterns associated with HPV-induced cutaneous warts. The present findings provide an exploratory analysis that creates clear lines of future research on this topic, especially with regard to validation studies involving larger sample sizes.
In the present study, the most differentially methylated (DM) promoter in warts compared to normal skin was found within the eukaryotic translation initiation factor 3 subunit E pseudogene 2 (EIF3EP2) gene, a pseudogene with no function or association previously reported in the literature. Likewise, little is known about the second most DM gene in warts, the chromosome 9 open reading frame 30 (C9orf30) pseudogene. In contrast, the third most DM gene is the protein-coding cysteinyl leukotriene receptor 1 (CYSLTR1) gene, which is normally involved in allergic and hypersensitive reactions [16]. Variation in the CYSLTR1 gene modulates asthma risk as well as adenoid hypertrophy progression, and it has been implicated in the disease outcome of colorectal, prostate, and squamous cell carcinoma [17-21]. Moreover, CYSLTR1 is highly expressed in the normal human skin epidermis, but its expression was found to be even higher in atopic dermatitis [22]. Table 2 depicts all the protein-coding genes containing DM promoters from among the top-ranking 100 listed in Table 1.
Among the protein-coding genes, C10orf99 and KRT6B promoters exhibited high levels of differential methylation in warts. The chromosome 10 open reading frame 99 (C10orf99) gene encodes for an antimicrobial peptide that is widely expressed in the skin and digestive tract [23]. In a pathologic context, C10orf99 was determined to contribute to psoriasis development by promoting keratinocyte proliferation [24, 25]. Likewise, the keratin 6B (KRT6B) gene encodes for a type II keratin that is normally present in mammalian epithelial cells and is rapidly induced in human keratinocytes after skin wounding [26]. KRT6B has been identified as a potential biomarker for differentiating between lung adenocarcinoma and lung squamous cell carcinoma, and its increased expression is associated with lower disease-free survival rates in young breast cancer patients [27, 28]. Mutations in the KRT6B gene result in an autosomal dominant skin disorder known as pachyonychia congenita, which involves plantar keratoderma and pain alongside thickened toenails [29]. In contrast, two of the most differentially methylated protein-coding promoters, namely the kallikrein related peptidase 2 (KLK2) and Izumo sperm-egg fusion 1 (IZUMO1) genes, are integral for sperm function. KLK2 over-expression has been associated with the promotion of prostate cancer cell growth [30].
As previously mentioned, the ephemeral nature of warts hints towards the involvement of an epigenetic component. Correspondingly, some of the most DM promoters were found within the laminin subunit alpha 4 (LAMA4) and H3 histone family member 3B (H3F3B) genes, which are responsible for cell differentiation and nucleosomal displacement, respectively [31, 32]. In certain breast cancer subtypes, increased LAMA4 expression was noted to contribute to the chromatin remodeling mechanisms that are a part of cancer progression [33]. Moreover, atypical HF3B expression was reported to be associated with colorectal cancer and chondroblastoma [34, 35]. On a similar note, epigenetic modifications have been linked to changes in metabolism in a number of different non-communicable diseases, including cancer and diabetes [36]. In the present study, promoters were differentially methylated within the 17β-hydroxysteroid dehydrogenase type 14 (HSD17B14), leukotriene C4 synthase (LTC4S), folate receptor 3 (FOLR3), alcohol dehydrogenase 7 (ADH7), and adiponectin receptor 2 (ADIPOR2) genes that are involved in steroid, eicosanoid, folate, retinol, and glucose and lipid metabolism, respectively [37-41]. Like the CYSLTR1 gene, LTC4S polymorphisms were associated with asthma risk and drug responsiveness in different ethnic populations [42-45].
Pathway analysis demonstrated that the most common regulator among the top-ranking 1000 DM promoters was the H3 histone family member 3A (H3F3A) gene. Like the H3F3B gene, H3F3A encodes for a histone variant and is involved in transcriptional regulation [46]. Aberrant H3F3A expression has been associated with the promotion of pediatric and adolescent cancers as well as lung cancer cell migration [46, 47]. The second most common regulator was the cyclin dependent kinase inhibitor 1A (CDKN1A) gene, which is mostly involved in CDK2 inhibition and is a primary target of p53 activity [48]. The CDKN1A gene was associated with better patient survival in HPV-related oropharyngeal squamous cell carcinoma [49]. The third most common regulator in HPV-induced warts is the mitogen-activated protein kinase 13 (MAPK13) gene. MAPK13 is a member of the MAP kinase family and functions to regulate cellular responses to a range of different stimuli, especially in the context of keratinocyte apoptosis and skin homeostasis [50]. Analysis of genome-wide promoter methylation revealed that MAPK13 was hypermethylated in the majority of primary and metastatic melanomas [51]. MAPK13 was also found to be hypermethylated in esophageal squamous cell carcinoma [52].
In summary, it is apparent that HPV-induced warts possess certain patterns of promoter methylation that could be responsible for their formation and maintenance. One limitation of the current study is that it is not possible at this stage to determine whether the differential methylation occurred as a result of the host cells' response to infection or due to HPV-driven processes responsible for wart formation and progression. Future research is required in order to assess the functional and clinical importance of the hypo- and hypermethylated promoter sites as well as to determine the exact nature of this differential methylation.
Acknowledgements
This work was supported by the Deanship of Research at Jordan University of Science and Technology under grant number 184/2017. The authors would like to express their gratitude to King Khalid University, Saudi Arabia, for providing administrative and technical support.
Ethics Committee Approval and Patient Consent
Ethical approval was obtained from the Jordan University of Science and Technology (JUST) IRB committee (Ref. # 19/105/2017). All participants gave written informed consent before participating in this study.
Competing Interests
The authors have declared that no competing interest exists.
References
1. Lim DHK, Maher ER. DNA methylation: a form of epigenetic control of gene expression. Obstet Gynaecol. 2010;12:37-42
2. Wagner JR, Busche S, Ge B. et al. The relationship between DNA methylation, genetic and expression inter-individual variation in untransformed human fibroblasts. Genome Biol. 2014;15:R37
3. Deaton AM, Bird A. CpG islands and the regulation of transcription. Genes Dev. 2011;25:1010-22
4. Takai D, Jones PA. Comprehensive analysis of CpG islands in human chromosomes 21 and 22. Proc Natl Acad Sci. 2002;99:3740-3745
5. Jones PA, Baylin SB. The Epigenomics of Cancer. Cell. 2007;128:683-692
6. Brooks J, Cairns P, Zeleniuch-Jacquotte A. Promoter methylation and the detection of breast cancer. Cancer Causes Control. 2009;20:1539-50
7. Kuss-Duerkop SK, Westrich JA, Pyeon D. DNA Tumor Virus Regulation of Host DNA Methylation and Its Implications for Immune Evasion and Oncogenesis. Viruses. 2018 [Epub ahead of print]
8. McKinney C, Hussmann K, McBride A. et al. The Role of the DNA Damage Response throughout the Papillomavirus Life Cycle. Viruses. 2015;7:2450-2469
9. Ljubojevic S, Skerlev M. HPV-associated diseases. Clin Dermatol. 2014;32:227-234
10. Lacarrubba F, Verzì AE, Quattrocchi E. et al. Cutaneous and Anogenital Warts. Atlas of Pediatric Dermatoscopy. Cham: Springer International Publishing. 2018:35-44
11. Plasencia JM. Cutaneous warts: diagnosis and treatment. Prim Care. 2000;27:423-34
12. Assenov Y, Müller F, Lutsik P. et al. Comprehensive analysis of DNA methylation data with RnBeads. Nat Methods. 2014;11:1138-1140
13. Ritchie ME, Phipson B, Wu D. et al. limma powers differential expression analyses for RNA-sequencing and microarray studies. Nucleic Acids Res. 2015;43:e47-e47
14. The Gene Ontology Consortium. Expansion of the Gene Ontology knowledgebase and resources. Nucleic Acids Res. 2017;45:D331-D338
15. Perfetto L, Briganti L, Calderone A. et al. SIGNOR: a database of causal relationships between biological entities. Nucleic Acids Res. 2016;44:D548-D554
16. Jiang Y, Borrelli LA, Kanaoka Y. et al. CysLT2 receptors interact with CysLT1 receptors and down-modulate cysteinyl leukotriene dependent mitogenic responses of mast cells. Blood. 2007;110:3263-70
17. Gao W, Li J, Li Q. et al. CYSLTR1 promotes adenoid hypertrophy by activating ERK1/2. Exp Ther Med. 2018;16:966-970
18. Hong X, Zhou H, Tsai H-J. et al. Cysteinyl leukotriene receptor 1 gene variation and risk of asthma. Eur Respir J. 2009;33:42-8
19. McGovern T, Goldberger M, Chen M. et al. CysLT1 Receptor Is Protective against Oxidative Stress in a Model of Irritant-Induced Asthma. J Immunol. 2016;197:266-77
20. Öhd JF, Nielsen CK, Campbell J. et al. Expression of the leukotriene D4 receptor CysLT1, COX-2, and other cell survival factors in colorectal adenocarcinomas. Gastroenterology. 2003;124:57-70
21. Bai S, Zhang P, Zhang J-C. et al. A gene signature associated with prognosis and immune processes in head and neck squamous cell carcinoma. Head Neck. 2019 [Epub ahead of print]
22. Hussain I, Kitagaki K, Businga TR. et al. Expression of cysteinyl leukotriene receptor-1 in skin. J Am Acad Dermatol. 2004;51:1032-1033
23. Yang M, Tang M, Ma X. et al. AP-57/C10orf99 is a new type of mutifunctional antimicrobial peptide. Biochem Biophys Res Commun. 2015;457:347-352
24. Roberson EDO, Liu Y, Ryan C. et al. A Subset of Methylated CpG Sites Differentiate Psoriatic from Normal Skin. J Invest Dermatol. 2012;132:583-592
25. Chen C, Wu N, Duan Q. et al. C10orf99 contributes to the development of psoriasis by promoting the proliferation of keratinocytes. Sci Rep. 2018;8:8590
26. Moll R, Divo M, Langbein L. The human keratins: biology and pathology. Histochem Cell Biol. 2008;129:705-733
27. Xiao J, Lu X, Chen X. et al. Eight potential biomarkers for distinguishing between lung adenocarcinoma and squamous cell carcinoma. Oncotarget. 2017;8:71759-71771
28. Johnson RH, Hu P, Fan C. et al. Gene expression in “young adult type” breast cancer: a retrospective analysis. Oncotarget. 2015;6:13688
29. Cao L-H, Luo Y, Wen W. et al. A novel frameshift mutation in keratin 16 underlies pachyonychia congenita with focal palmoplantar keratoderma. Br J Dermatol. 2011;165:1145-7
30. Shang Z, Niu Y, Cai Q. et al. Human kallikrein 2 (KLK2) promotes prostate cancer cell growth via function as a modulator to promote the ARA70-enhanced androgen receptor transactivation. Tumor Biol. 2014;35:1881-1890
31. Bush KM, Yuen BT, Barrilleaux BL. et al. Endogenous mammalian histone H3.3 exhibits chromatin-related functions during development. Epigenetics Chromatin. 2013;6:7
32. Shan N, Zhang X, Xiao X. et al. Laminin α4 (LAMA4) expression promotes trophoblast cell invasion, migration, and angiogenesis, and is lowered in preeclamptic placentas. Placenta. 2015;36:809-820
33. Triulzi T, Casalini P, Sandri M. et al. Neoplastic and Stromal Cells Contribute to an Extracellular Matrix Gene Expression Profile Defining a Breast Cancer Subtype Likely to Progress. PLoS One. 2013;8:e56761
34. Behjati S, Tarpey PS, Presneau N. et al. Distinct H3F3A and H3F3B driver mutations define chondroblastoma and giant cell tumor of bone. Nat Genet. 2013;45:1479-1482
35. Ayoubi HA, Mahjoubi F, Mirzaei R. Investigation of the human H3.3B (H3F3B) gene expression as a novel marker in patients with colorectal cancer. J Gastrointest Oncol. 2017;8:64-69
36. Tzika E, Dreker T, Imhof A. Epigenetics and Metabolism in Health and Disease. Front Genet. 2018;9:361
37. Lukacik P, Kavanagh KL, Oppermann U. Structure and function of human 17β-hydroxysteroid dehydrogenases. Mol Cell Endocrinol. 2006;248:61-71
38. Haeggström JZ, Rinaldo-Matthis A, Wheelock CE. et al. Advances in eicosanoid research, novel therapeutic implications. Biochem Biophys Res Commun. 2010;396:135-139
39. O'Byrne MR, Au KS, Morrison AC. et al. Association of folate receptor (FOLR1, FOLR2, FOLR3) and reduced folate carrier (SLC19A1) genes with meningomyelocele. Birth Defects Res A Clin Mol Teratol. 2010;88:689-94
40. Kumar S, Sandell LL, Trainor PA. et al. Alcohol and aldehyde dehydrogenases: retinoid metabolic effects in mouse knockout models. Biochim Biophys Acta. 2012;1821:198-205
41. Tao C, Sifuentes A, Holland WL. Regulation of glucose and lipid homeostasis by adiponectin: effects on hepatocytes, pancreatic β cells and adipocytes. Best Pract Res Clin Endocrinol Metab. 2014;28:43-58
42. Kang M-J, Kwon J-W, Kim B-J. et al. Polymorphisms of the PTGDR and LTC4S influence responsiveness to leukotriene receptor antagonists in Korean children with asthma. J Hum Genet. 2011;56:284-289
43. Arriba-Méndez S, Sanz C, Isidoro-García M. et al. Analysis of 927T > C CYSLTR1 and -444A > C LTC4S polymorphisms in children with asthma. Allergol Immunopathol (Madr). 2008;36:259-263
44. Zhang Y, Huang H, Huang J. et al. The -444A/C Polymorphism in the LTC4S Gene and the Risk of Asthma: A Meta-analysis. Arch Med Res. 2012;43:444-450
45. Kumar A, Sharma S, Agrawal A. et al. Association of the -1072G/A Polymorphism in the LTC4S Gene with Asthma in an Indian Population. Int Arch Allergy Immunol. 2012;159:271-277
46. Park S-M, Choi E-Y, Bae M. et al. Histone variant H3F3A promotes lung cancer cell migration through intronic regulation. Nat Commun. 2016;7:12914
47. Lan F, Shi Y. Histone H3.3 and cancer: A potential reader connection. Proc Natl Acad Sci U S A. 2015;112:6814-9
48. Abbas T, Dutta A. p21 in cancer: intricate networks and multiple activities. Nat Rev Cancer. 2009;9:400-14
49. Chernock RD, Wang X, Gao G. et al. Detection and significance of human papillomavirus, CDKN2A(p16) and CDKN1A(p21) expression in squamous cell carcinoma of the larynx. Mod Pathol. 2013;26:223-231
50. Efimova T. p38δ mitogen-activated protein kinase regulates skin homeostasis and tumorigenesis. Cell Cycle. 2010;9:498-505
51. Gao L, Smit MA, van den Oord JJ. et al. Genome-wide promoter methylation analysis identifies epigenetic silencing of MAPK 13 in primary cutaneous melanoma. Pigment Cell Melanoma Res. 2013;26:542-554
52. O' Callaghan C, Fanning L, Barry O. et al. Hypermethylation of MAPK13 Promoter in Oesophageal Squamous Cell Carcinoma Is Associated with Loss of p38δ MAPK Expression. Cancers (Basel). 2015;7:2124-2133
Author contact
![]() Corresponding author: Email: lneitanedu.jo
Corresponding author: Email: lneitanedu.jo