Impact Factor ISSN: 1449-1907
- Issue 9; 2026
- Issue 8; 2026
- Issue 7; 2026
- Issue 6; 2026
- Issue 5; 2026
- Volume 23; 2026
- Past Issues
- Editorial Board
- Cover Images
- Index & Coverage
- Cover Suggestion
- Special Issues
Introduction
Materials and Methods
Results
Discussion
Conclusion
Abbreviations
Acknowledgements
References

 Global reach, higher impact
Int J Med Sci 2019; 16(4):501-506. doi:10.7150/ijms.31153 This issue Cite
Research Paper
Intrauterine Fetal and Neonatal Death between Small for Date and Non-Small for Date in Small for Gestational Age Infants
Toshiya Itoh1 ![]() , Yoshio Matsuda2
, Yoshio Matsuda2 ![]() , Hiroaki Itoh1, Masaki Ogawa3, Kemal Sasaki4, Naohiro Kanayama1
, Hiroaki Itoh1, Masaki Ogawa3, Kemal Sasaki4, Naohiro Kanayama1
1. Department of Obstetrics and Gynecology, Hamamatsu University School of Medicine, 1-20-1 Handayama, Higashi-ku, Hamamatsu city, Shizuoka 431-3192, Japan
2. Department of Obstetrics and Gynecology, Japan Community Health care Organization (JCHO) Mishima General Hospital, 2276 Yata Aza Fujikubo, Mishima city, Shizuoka 411-0801, Japan
3. Department of Obstetrics and Gynecology, Tokyo Women's Medical University, 8-1 Kawada-cho, Shinjuku-ku, Tokyo 162-8666, Japan
4. Department of Food and Health Sciences, Jissen Women's University, 4-4-1 Osakaue, Hino city, Tokyo 191-8510, Japan
Received 2018-11-1; Accepted 2019-2-8; Published 2019-3-9
Abstract
Objective: To demonstrate the differences in intrauterine fetal deaths and neonatal deaths between small for date (SFD) and Non-SFD neonates by applying a novel classification from both Z scores of placental weight (PW) and fetal/placental weight ratio (F/P) to small for gestational age (SGA) neonates.
Methods: From 93,034 placentas/infants of mothers who vaginally delivered a singleton infant (Japan Perinatal Registry Network database 2013), SGA (n=7,780) was chosen according to the reference to Japanese neonatal growth chart. They were divided into two subgroups: SFD (body weight and height less than the 10th percentile, n=3,379) and Non-SFD (only body weight less than the 10th percentile, n=4,401). Z scores of PW and F/P based on the standard curves for sex-, parity-, and gestational-age-specific PW and F/P were calculated. The population was classified into 9 groups according to the combination of 'low vs. middle vs. high' i) PW Z score and ii) F/P Z score. In both i) and ii), ± 1.28 standard deviations in the Z scores were used for classifying low vs. middle vs. high, with 3×3 making 9 groups. From top-left to bottom-right, we labeled the groups as Group A to Group I.
Results: SFD and Non-SFD neonates distributed in the same 6 groups (A, D, E, G, H, I). In group E, which was considered to be balanced placental and infant growth, the incidence of intrauterine fetal death was significantly higher in Non-SFD neonates than in SFD neonates. In group D, which was considered to be small placenta and balanced infant growth, the incidence of neonatal death was significantly higher in SFD neonates than in Non-SFD neonates.
Conclusion: Assessment of SGA neonates by dividing them into SFD and Non-SFD neonates and application of a 9-group classification by PW and F/P Z scores were informative to understand the pathophysiological involvement of an imbalance between placental and fetal sizes.
Keywords: small for gestational age, small for date, fetal/placental weight ratio, placenta, intrauterine fetal death, neonatal death
Introduction
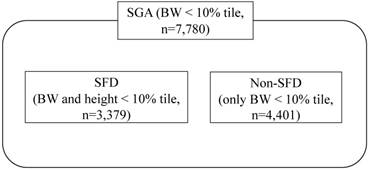
The definition of small for gestational age (SGA) by Battaglia and Lubchenco [1] as birthweight below the 10th percentile for gestational age, has been widely used. On the other hand, in consideration of the pathophysiological contribution of small composition, small for date (SFD) newborns were further classified as both of body weight (BW) and height less than the 10th percentile [2-5]. Therefore, SGA neonates are composed of two subgroups of SFD and Non-SFD neonates (Figure 1). However, the differential perinatal outcomes of SFD neonates are yet to be fully understood in comparison with those of Non-SFD neonates among SGA newborns.
The concept of SGA, SFD, and Non-SFD neonates.
Pathophysiological changes in placentas are closely associated with the development of SGA neonates [6-8]. We, and others, have reported the norms for placental weight (PW) in order to analyze the contribution of placental size to fetal development [9-11]. A possible important contribution of an imbalance between placental and fetal sizes has been demonstrated in the development of SGA by assessment using the fetal/PW ratio (F/P) [12]. Recently, we proposed a novel 9-group classification according to PW and F/P, and its usefulness in assessing the underlying characteristics of imbalance between placental and fetal sizes in perinatal death [2].
Here, we applied this analysis with this 9-group classification to compare intrauterine fetal death (IUFD) and neonatal death (ND) between SFD neonates, i.e. growth-restricted and relatively small height, and Non-SFD neonates, i.e. growth-restricted and relatively large height, among 7,780 SGA neonates from the Japan Perinatal Registry Network database.
Materials and Methods
The study protocol was reviewed and approved by the Ethics Committee of Hamamatsu University School of Medicine, which is conformed to Helsinki Declaration of 1975, as revised in Fortaleza 2013. (Date of approval: 2017/08/04, reference number: 2017-157). Individual data were collected from the Japan Perinatal Registry Network database 2013, which is managed by the Japan Society of Obstetrics and Gynecology and included 187,180 newborns (18.2% of entire Japanese ones). Ob/Gyn physicians entered the data in 300 institutions during 2013. The Registry has contributed to the perinatal epidemiological investigations in Japan [2, 13-15].
As described previously [13], after manually removal of blood clots, the untrimmed placenta together with the membranes and umbilical cord was weighed by the midwife. In more detail, the placenta was weighed without drainage within 2 h after delivery using standardized scales of medical device grade. The F/P was calculated by dividing BW by PW in grams [9].
The neonatal growth chart (New Japanese neonatal anthropometric chart) in general use in Japan, published by Itabashi et al. in 2010 [16], was generated based on data from vaginal deliveries, because the BW of infants from cesarean deliveries was significantly lighter during the preterm period. Thus, in this study, PW and F/P were analyzed only in placentas/infants delivered vaginally. The study population consisted of 93,034 placentas/infants from women who vaginally delivered a singleton infant between 22 and 41 weeks of gestation. SGA infants (BW less than the 10th percentile, n=7,780) were chosen from the eligible cases according to the above-mentioned neonatal growth chart [16]. They were divided into two subgroups: SFD (BW and height less than the 10th percentile, n=3,379) and Non-SFD (only BW less than the 10th percentile, n=4,401) (Figure 1).
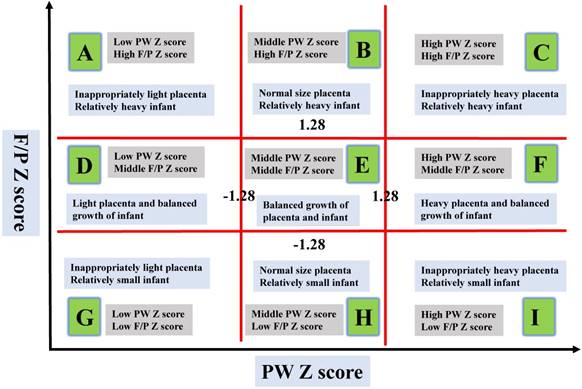
The 9-group classification by PW and F/P ratio was carried out as described previously [2]. In brief, standard curves for PW and F/P were constructed using the LMS [skewness (L), median(M), and coefficient of variation(S)] method, according to fetal gender (male or female) and maternal parity (nulliparous or multiparous), and were represented as the 10th, 50th, and 90th percentiles for every gestational week (GW) and day. The LMS method was used to calculate three sets of values for each gestational day [17]. Each Z score of the PW and F/P was then calculated using the formula; Z = [(sample data/M) L - 1]/ (L x S). We classified the study population into three groups as follows: low Z score group, less than -1.28 standard deviations (SD); intermediate Z score group, -1.27 to 1.27 SD; and high Z score group, over 1.28 SD considering that the 10th percentile and 90th percentile of the data were regarded to be almost equal to -1.28 and 1.28 SD of the data, and the Z score represents a marker of deviation from the average. The resultant 9 groups were labeled them from top-left (Group A) to bottom-right (Group I), and Group E was considered to be a control for the remaining eight groups, as described previously (Figure 2) [2].
Labels of the nine blocks made by placental weight (PW) and fetal/placental (F/P) Z scores, Described as in Matsuda et al. The X-axis represents the Z score of PW focusing on scores of -1.28 SD and 1.28 SD. The Y-axis represents the Z score of F/P focusing on scores of -1.28 SD and 1.28 SD. The characteristics of the 9 groups made using the Z scores of PW and F/P are shown, which considered the relationships between BW and PW.
Poor perinatal outcomes (cases) were defined as IUFD and ND and the definition of neonatal death is death from any reasons within 4 weeks after birth. We analyzed the difference in frequencies of IUFD and ND between the SFD and Non-SFD subgroups among SGA neonates. The results were expressed as the means ± SD. Statistical analyses were performed using JMP 13.1.0 software (SAS Institute Inc.). For categorical variables, Fisher's exact test was used. A p-value <0.05 was considered significant.
Results
Of the 7,780 cases in this study, there were 801 preterm deliveries and 6,979 term deliveries. Perinatal backgrounds of the subjects are described in Table 1. The distributions of BW were as follows; < 1,000 g: 168 cases, 1,000-1,499 g: 118 cases, 1,500-2,499 g: 4,440 cases, and > 2,500 g: 3,054 cases. There were 201 cases of IUFD and 18 cases of ND. The mean GW in the IUFD group was 29.5 ± 5.1 weeks. Frequent perinatal complications or maternal backgrounds of IUFD were placental abruption (20 cases), hypertensive disorder of pregnancies (17 cases), fetal growth restriction (FGR, 38 cases), and maternal smoking during pregnancy (14 cases). The mean GW in the ND group was 33.0 ± 5.7 weeks. There were 10 cases of FGR among the ND cases.
Perinatal backgrounds of the subjects
| Entire SGA (7,780) | Mean or n | SD | Range |
| Maternal age (yr.) | 31.4 | 5.46 | (15-47) |
| Maternal body weight (kg) | 58.7 | 8.6 | (31.6-154) |
| Maternal BMI (non-pregnant) (kg/m2) | 20.3 | 3.26 | (15.0-46.6) |
| Maternal BMI (kg/m2) | 23.8 | 3.25 | (16.8-49.7) |
| Body weight gain (kg) | 10.2 | 5.18 | (-17.0-39.0) |
| Birth weight (g) | 2337 | 393 | (175-2970) |
| Gestational age at birth | 38.4 | 2.4 | (22-41) |
| Entire SGA (7,780) | (n) | ||
| Gender of newborns | Male | 3,872 | |
| Female | 3,908 | ||
| Term birth | 6,980 | ||
| Preterm birth | 800 | ||
Among the 9 groups made by the combination of PW Z scores and F/P Z score, 7,780 cases of SGA (SFD and Non-SFD) infants were distributed into 6 groups: 11.3% (11.7% and 10.9%) in Group A, 33.6% (40.0% and 28.7%) in Group D, 44.6% (37.6% and 50.1%) in Group E (middle PW Z score and middle F/P Z score; balanced growth of placenta and infant), 0.2% (0.5% and 0.1%) in Group G, 9.6% (9.9% and 9.5%) in Group H, and 0.5% (0.3% and 0.7%) in Group I, respectively (Figure 3A). Table 2 shows GW and BW of SFD and Non-SFD neonates. The distributions of the cases are biased at the center to the lower left side and there were no cases in groups B, C, or F.
Characteristics of the nine groups among SFD neonates and Non-SFD neonates.
| SFD (n=3,379) | Non-SFD (n=4,401) | |||||
|---|---|---|---|---|---|---|
| Gestational weeks | Birth weight | Gestational weeks | Birth weight | |||
| Groups | n | Mean ± SD | Mean ± SD | n | Mean ± SD | Mean ± SD |
| A | 396 | 38.2±2.4 | 2,224±422 | 480 | 38.6±2.0 | 2,399±327 |
| D | 1,352 | 38.3±2.3 | 2,206±397 | 2,206 | 38.5±9.2 | 2,420±363 |
| E | 1,270 | 38.6±2.1 | 2,364±331 | 1,265 | 38.7±2.0 | 2,388±327 |
| G | 18 | 32.4±6.0 | 927±705 | 1 | 26 | 374 |
| H | 333 | 37.5±4.0 | 2,103±581 | 417 | 38.5±2.4 | 2,354±394 |
| I | 10 | 35.8±5.2 | 1,897±720 | 32 | 38.3±3.0 | 2,374±444 |
A total 7,780 SGA neonates were divided into nine groups according to the combination of 'low vs. middle vs. high' i) PW Z score and ii) F/P Z score as described in the Methods.
Scatter chart of PW Z scores against F/P and the distribution of groups of entire SGA (SFD and Non-SFD) neonates (A), IUFD (B) and ND (C) in the 9-group classification made using the Z scores of PW and F/P.
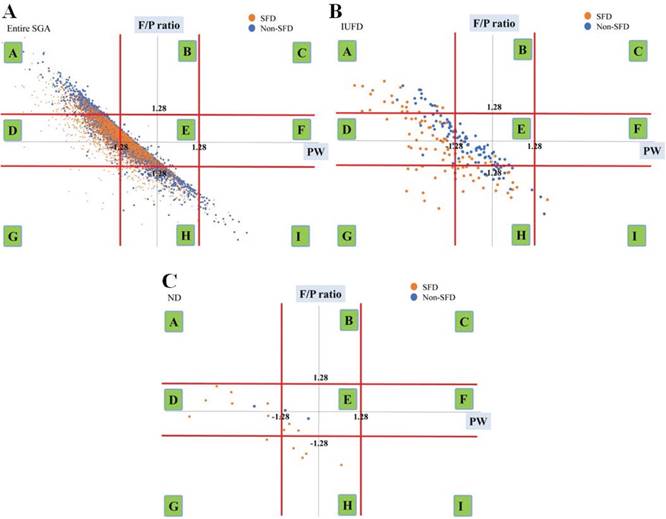
In Figure 3B and 3C, we have also shown the distributions of ND and IUFD, respectively. The comparison of the incidences of IUFD, ND between SFD and Non-SFD neonates using Fisher's exact test are summarized in Table 3 and Table 4. The incidence of ND in the SFD group was higher than that in the Non-SFD group (Table 3, 0.4% vs 0.1%, p<0.001). In Group D, the incidence of ND in the SFD group was also higher than that in the Non-SFD group (Table 4, 0.60% vs 0.08%, p<0.05). On the other hand, in Group E, the incidence of IUFD in the Non-SFD group was higher than that in the SFD group (Table 4, 0.9% vs 2.2%, p<0.05).
Comparison of IUFD and ND between SFD and Non-SFD groups in entire SGA.
| Entire SGA (n) | SFD (3,379) | Non-SFD (4,401) | P |
|---|---|---|---|
| IUFD (n) | 2.8% (94) | 2.4% (107) | .34 |
| ND (n) | 0.4% (15) | 0.1% (3) | .001 |
Fisher's exact test was carried out between SFD and Non-SFD subjects with vs without IUFD or ND.
Comparison of IUFD and ND between SFD and Non-SFD groups in groups A, D, E, G, H, and I.
| Group A (n) | SFD (396) | Non-SFD (480) | P |
| IUFD (n) | 4.8% (19) | 2.7% (13) | .10 |
| ND (n) | 0% (0) | 0% (0) | - |
| Group D (n) | SFD (1,352) | Non-SFD (1,265) | P |
| IUFD (n) | 2.4% (32) | 2.1% (26) | .59 |
| ND (n) | 0.60% (8) | 0.08% (1) | .03 |
| Group E (n) | SFD (1,270) | Non-SFD (2,206) | P |
| IUFD (n) | 0.8% (10) | 2.2% (48) | .001 |
| ND (n) | 0.20% (3) | 0.09% (2) | .36 |
| Group G (n) | SFD (18) | Non-SFD (1) | P |
| IUFD (n) | 55.6% (10) | 100% (1) | >.99 |
| ND (n) | 5.6% (1) | 0% (0) | >.99 |
| Group H (n) | SFD (333) | Non-SFD (417) | P |
| IUFD (n) | 6.6% (22) | 4.1% (17) | .13 |
| ND (n) | 0.9% (3) | 0% (0) | .08 |
| Group I (n) | SFD (10) | Non-SFD (32) | P |
| IUFD (n) | 10.0% (1) | 6.3% (2) | >.99 |
| ND (n) | 0% (0) | 0% (0) | - |
Fisher's exact test was used between SFD and Non-SFD subjects with vs without IUFD, ND.
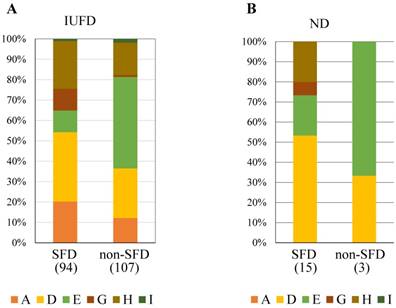
IUFD was most frequently observed in Group D in SFD neonates and in Group E in Non-SFD neonates (Figure 4A). ND was most frequently observed in Group D in SFD neonates and Group E in Non-SFD neonates (Figure 4B).
The constitution of subclasses in IUFD (A) and ND (B) in SFD and Non-SFD neonates.
Discussion
In the present study, the proportion of ND, but not IUFD, in SFD neonates was higher than that in Non-SFD neonates (Table 4), suggesting that a rather high rate of ND is a characteristic of SFD neonates compared with Non-SFD neonates, as an entity. Then, we applied a 9-group classification made from the combinations of the Z scores of both PW and F/P to SFD and Non-SFD neonates. The neonates were distributed across same 6 groups (A, D, E, G, H, and I) (Figure 3A), but different characteristics were observed between SFD and Non-SFD neonates.
Incidences of IUFD was significantly higher in Non-SFD neonates than those in SFD neonates in Group E using Fisher's exact test (Table 4). The net numbers of IUFD were highest in Group E in Non-SFD neonates but not SFD neonates (Figure 4A). In the textbook Williams' Obstetrics [18], the body type of FGR was hypothetically divided into two types, i.e. symmetrical pattern with both small head and body and asymmetrical pattern with obviously small body compared with the head (thin body composition) by ultrasound. Symmetrical and asymmetrical FGR were hypothesized to be associated with the fetal origins and insufficient supply of nutrients to the fetus because of placental dysfunction, respectively. Neonates in the Non-SFD subgroup had low BW and relatively high height, which could be regard as a thin body composition, and this might be closely related to the hypothetical theory of asymmetrical FGR underlined with potential intrauterine poor nutrient supply via the placenta. In consideration of this concept, we speculated that relative poor placental function might be linked with the higher incidence of IUFD in the Non-SFD subgroup (low BW and relatively high height) in SGA neonates, specifically in Group E with well-balanced growth pattern of the fetus and placenta.
On the other hand, the incidence of ND was significantly higher in SFD neonates than in Non-SFD neonates in Group D using Fisher's exact test (Table 4) where the placenta was small and fetal weight was small, but proper for small placental weight (Figure 2). The net numbers of ND were highest in Group D in SFD neonates but not in Non-SFD neonates (Figure 4B). The higher incidence of ND in SFD neonates than in Non-SFD neonates in Group D might be at least partly associated with the fetus itself, considering the hypothetical concept of symmetrical FGR. The unidentified intrinsic causative factors for small size and small composition in utero might be related to the subsequent poor adaptability to the circumstances during the neonatal period, without supply from the placenta.
Symmetrical/asymmetrical pattern is the concept of fetal assessment using ultrasound, whereas SFD/Non-SFD was diagnosed by neonatal measurement after birth. It is necessary for this speculation to clarify the exact relationship between fetal ultrasound findings and neonatal physique measurement. Nevertheless, the application of the present 9-group classification to SGA neonates identified a critical different fetal as well as neonatal prognosis between Group D and Group E. Moreover, it was noted that Group D and Group E would be regarded as identical using only the F/P.
Among SGA neonates who had higher morbidity and mortality rate than appropriate for gestational age neonates, we suggested that Non-SFD and SFD neonates tended to have rather high risks during the fetal and neonatal periods, respectively, which was mainly characterized by the differential prognosis in Group D and Group E using our 9-group classification. Therefore, the application of this 9-group classification to SGA neonates could be useful to understand the pathophysiological involvement of an imbalance between placental and fetal sizes, especially in relation to the clinical importance of the SFD subgroup.
This study had some limitations. First, this study was based on the Japan Perinatal Registry Network database, which is constructed from data from secondary and tertiary facilities; therefore, it did not include nationwide delivery. However, this large amount of data is considered relevant for evaluating the relationship of PW and F/P in SFD and Non-SFD neonates. Second, we excluded cases of Cesarean section because of their smaller BW than of vaginal deliveries [16]. Third, the procedure for measuring placental weight was not identical among facilities, but the above-mentioned procedure is typical in Japan. In addition, untrimmed placental weight obtained by this procedure could affect the F/P, but a previous report on trimmed and untrimmed placentas showed a high correlation between them [19].
Conclusion
The comparison between SFD and non-SFD neonates with a 9-group classification using Z scores of PW and F/P to SGA neonates is useful to understand the pathophysiological involvement of an imbalance between placental and fetal sizes, especially concerning the clinical importance of SFD subcategories among SGA neonates.
Abbreviations
PW: placental weight; BW: birth weight; GW: gestational week; F/P: fetal/placental weight ratio; SGA: small for gestational age; SFD: small for date; IUFD: intrauterine fetal death; ND: neonatal death.
Acknowledgements
We thank Mr. Norio Sugimoto for his statistical help.
This work was supported in part by MEXT KAKENHI (Grants-in- Aid for Scientific Research) Grant Numbers JP16K15703
Competing Interests
The authors have declared that no competing interest exists.
References
1. Battaglia FC, Lubchenco LO. A practical classification of newborn infants by weight and gestational age. J Pediatr. 1967;71:159-63
2. Matsuda Y, Itoh T, Itoh H, Ogawa M, Sasaki K, Kanayama N. et al. Impact of placental weight and fetal/placental weight ratio Z score on fetal growth and the perinatal outcome. Int J Med Sci. 2018;15:484-91
3. Albertsson-Wikland K, Karlberg J. Natural growth in children born SGA with and without catch up growth. Horm Res. 2003;59(Suppl 1):129
4. Verkauskiene R, Albertsson Wikland K, Niklasson A. Variation in size at birth in infants born small for gestational age in Lithuania. Acta Paediatr. 2002;91:329-34
5. Suzuki Y, Kono Y, Hayakawa T, Shimozawa H, Matano M, Yada Y. Neonatal factors related to center variation in the incidence of late-onset circulatory collapse in extremely preterm infants. PLoS One. 2018;13:e0198518
6. Aviram R, T BS, Kidron D. Placental aetiologies of foetal growth restriction: clinical and pathological differences. Early Hum Dev. 2010;86:59-63
7. Ganer Herman H, Barber E, Gasnier R, Gindes L, Bar J, Schreiber L. et al. Placental pathology and neonatal outcome in small for gestational age pregnancies with and without abnormal umbilical artery Doppler flow. Eur J Obstet Gynecol Reprod Biol. 2018;222:52-6
8. Redline RW. Placental pathology: a systematic approach with clinical correlations. Placenta. 2008:29 Suppl A: S86-91
9. Ogawa M, Matsuda Y, Nakai A, Hayashi M, Sato S, Matsubara S. Standard curves of placental weight and fetal/placental weight ratio in Japanese population: difference according to the delivery mode, fetal sex, or maternal parity. European journal of obstetrics, gynecology, and reproductive biology. 2016;206:225-31
10. Almog B, Shehata F, Aljabri S, Levin I, Shalom-Paz E, Shrim A. Placenta weight percentile curves for singleton and twins deliveries. Placenta. 2011;32:58-62
11. Wallace JM, Bhattacharya S, Horgan GW. Gestational age, gender and parity specific centile charts for placental weight for singleton deliveries in Aberdeen, UK. Placenta. 2013;34:269-74
12. Macdonald EM, Koval JJ, Natale R, Regnault T, Campbell MK. Population-based placental weight ratio distributions. Int J Pediatr. 2014;2014:291846
13. Matsuda Y, Ogawa M, Nakai A, Hayashi M, Satoh S, Matsubara S. Fetal/Placental weight ratio in term Japanese pregnancy: its difference among gender, parity, and infant growth. Int J Med Sci. 2015;12:301-5
14. Matsuda Y, Hayashi K, Shiozaki A, Kawamichi Y, Satoh S, Saito S. Comparison of risk factors for placental abruption and placenta previa: case-cohort study. J Obstet Gynaecol Res. 2011;37:538-46
15. Hayashi M, Nakai A, Satoh S, Matsuda Y. Adverse obstetric and perinatal outcomes of singleton pregnancies may be related to maternal factors associated with infertility rather than the type of assisted reproductive technology procedure used. Fertil Steril. 2012;98:922-8
16. Itabashi K, Miura F, Uehara R, Nakamura Y. New Japanese neonatal anthropometric charts for gestational age at birth. Pediatrics international: official journal of the Japan Pediatric Society. 2014;56:702-8
17. Cole TJ. Using the LMS method to measure skewness in the NCHS and Dutch National height standards. Ann Hum Biol. 1989;16:407-19
18. Fetal-growth-disorders. In: Cunnigham FG, Leveno KJ, Bloom SL, Dashe JS, Hoffman BL, Casey BM, Spong CY, editors. Williamus Obstetrics. 25 th ed. New York: McGraw-Hill. 2018 p. 844-97
19. Leary SD, Godfrey KM, Greenaway LJ, Davill VA, Fall CH. Contribution of the umbilical cord and membranes to untrimmed placental weight. Placenta. 2003;24:276-8
Author contact
![]() Corresponding author: Toshiya Itoh, MD, Department of Obstetrics and Gynecology, Hamamatsu University School of Medicine, 1-20-1 Handayama, Higashi-ku, Hamamatsu city, Shizuoka 431-3192, Japan. Tel: +81-53-435-2309; FAX: +81-53-435-2308; e-mail: toshitoucom and Yoshio Matsuda, MD, PhD, Director, Japan Community Health care Organization (JCHO) Mishima General Hospital, 2276 Yata Aza Fujikubo, Mishima- City, Shizuoka 411-0801, Japan. Tel: +81-55-975-3031 (ext. 2843); Fax: +81-55-973-3647; E-mail: yoshiom2979com
Corresponding author: Toshiya Itoh, MD, Department of Obstetrics and Gynecology, Hamamatsu University School of Medicine, 1-20-1 Handayama, Higashi-ku, Hamamatsu city, Shizuoka 431-3192, Japan. Tel: +81-53-435-2309; FAX: +81-53-435-2308; e-mail: toshitoucom and Yoshio Matsuda, MD, PhD, Director, Japan Community Health care Organization (JCHO) Mishima General Hospital, 2276 Yata Aza Fujikubo, Mishima- City, Shizuoka 411-0801, Japan. Tel: +81-55-975-3031 (ext. 2843); Fax: +81-55-973-3647; E-mail: yoshiom2979com