Impact Factor ISSN: 1449-1907

 Global reach, higher impact
Int J Med Sci 2019; 16(2):285-291. doi:10.7150/ijms.28264 This issue Cite
Research Paper
Non-alcoholic fatty liver disease is associated with low-grade albuminuria in men without diabetes mellitus
Seok Hui Kang, Kyu Hyang Cho, Jun Young Do ![]()
Division of Nephrology, Department of Internal Medicine, Yeungnam University Hospital, Daegu, Republic of Korea
Received 2018-7-2; Accepted 2018-11-29; Published 2019-1-1
Abstract
Background: Non-alcoholic fatty liver disease (NAFLD) is associated with the dysregulation of multiple metabolic and inflammatory pathways. These can lead to extrahepatic disorders involving the kidney, a vulnerable organ responsible for extra-renal complications. Evaluating the association between NAFLD and low-grade albuminuria as a renal complication would be helpful to better understand the pathophysiology and extra-hepatic complications of NAFLD.
Patients and Methods: Our study extracted data from database obtained a representative population sample. Overall, 3867 men were included in this survey. Our study included only men without diabetes mellitus, with a urinary albumin/creatinine ratio < 30 mg/g (n = 1390). Low-grade albuminuria was defined by a urinary albumin/creatinine ratio within the highest quartile. The fatty liver index was calculated in accordance with Bedogni's equation. We defined the NAFLD group as patients with a fatty liver index of ≥ 60.
Results: In the multivariate analysis, the urinary albumin/creatinine ratio in the non-NAFLD and NAFLD groups was 3.05 ± 0.14 and 5.19 ± 0.42, respectively (P < 0.001). The correlation coefficients between the fatty liver index and urinary albumin/creatinine ratio were 0.124 in the Pearson's correlation test and 0.084 in the partial correlation test (P < 0.001 and P = 0.002, respectively). Linear regression analysis showed a positive association between the fatty liver index and the urinary albumin/creatinine ratio on multivariate analysis. Logistic regression analysis showed that the odds ratio for low-grade albuminuria with NAFLD was 2.31 (95% confidence interval, 1.47-3.61; P < 0.001) on the multivariate analysis. Subgroup analyses according to the presence of metabolic syndrome or age (< 50 or ≥ 50 years) showed that the association between NAFLD and the urinary albumin/creatinine ratio was stronger for participants without metabolic syndrome and in those aged < 50 years.
Conclusion: NAFLD was associated with low-grade albuminuria in men without diabetes mellitus in this study. Therefore, men with a relatively high fatty liver index or NAFLD should be closely monitored for low-grade albuminuria, especially in absence of metabolic syndrome.
Keywords: Non-alcoholic fatty liver disease, albuminuria, metabolic syndrome
Introduction
Non-alcoholic fatty liver disease (NAFLD) is chronic liver disease; encompassing conditions ranging from fatty liver disease to liver cirrhosis. NAFLD is characterized by fat accumulation without competing etiologies for steatosis such as viral hepatitis or heavy alcohol intake [1,2]. Primary NAFLD is typically associated with metabolic disturbances, such as metabolic syndrome (MetS) and/or insulin resistance, in particular [3,4]. Previous epidemiologic studies have shown that the prevalence of NAFLD is approximately 30% in the USA, 24% in Europe, and 27% in Asia [5-7]. The prevalence of NAFLD is rapidly increasing [8]. Previous studies have shown a positive association between NAFLD and systemic chronic diseases, such as diabetes mellitus (DM), cardiovascular disease, sarcopenia, and osteoporosis, through various metabolic disturbances [9-13]. New relationships between other chronic diseases and NAFLD have also been demonstrated. These findings suggest that NAFLD is indeed a systemic disorder and is associated with incident cardio-metabolic diseases and mortality [14,15].
Albuminuria is a well-known risk factor of cardiovascular disease and chronic kidney disease progression [16]. Microalbuminuria is classically defined by an albumin level of 30-300 mg/day in the urine or a urinary albumin/creatinine ratio (UACR) of 30-300 mg/g. However, considering the limitation of single cut-off values, researchers have focused on the importance of high levels of albuminuria of < 30 mg/day (or 30 mg/g); this condition has been called “low-grade albuminuria” (LGA). Previous studies have shown an association between LGA and various cardiometabolic diseases [17-20]. Tanaka et al. demonstrated that LGA leads to high mortality rates [20].
NAFLD is associated with the dysregulation of multiple metabolic and inflammatory pathways (e.g., peripheral/hepatic insulin resistance, chronic inflammation, oxidative stress, or the renin-angiotensin system) [4]. These can lead to extrahepatic disorders such as DM, hypertension, MetS, or cardiovascular disease. Epidemiologic or experimental studies have shown an association between NAFLD and extrahepatic disorders as a consequence of these pathophysiological disorders [4]. The kidney is an organ influenced by extra-renal complications and is vulnerable to different cardio-metabolic disturbances induced by NAFLD. Therefore, NAFLD is a systemic and inflammatory disease and can lead to the development of renal complications. Lin et al. enrolled Chinese adults and provided evidence for the association of LGA and NAFLD using ultrasonography [21]. Although a previous study has investigated the association between these two variables, regional and national disparities should also be considered. An additional study on a Korean population would be helpful to identify the association between the two variables. Thus, an evaluation of the association between NAFLD and LGA would be helpful to better understand the underlying pathophysiology and extra-hepatic complications of NAFLD. If the link between these two variables is identified, LGA may be considered an additive risk factor for mortality or morbidity in patients with NAFLD. Therefore, the aim of the present study was to evaluate the relationship between the two variables.
Patients & Methods
Study population
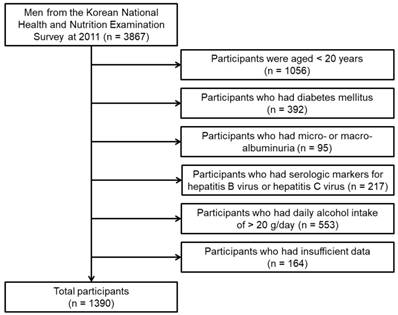
Our study used the database from the Korean National Health and Nutrition Examination Survey (2011). DM was defined as the self-reported diagnosis of DM as confirmed by a medical doctor, fasting blood glucose ≥ 126 mg/dL, or HbA1c levels ≥ 6.5%. Micro- or macro-albuminuria was defined as UACR ≥ 30 mg/g. The flow chart of participants included in the study is shown in Figure 1. Overall, 1390 men were included in our analysis. Our study was approved by the institutional review board of the Yeungnam University Hospital. The board waived the need for informed consent, as the subjects' records and information were anonymized and de-identified prior to analysis.
Flow chart of participants
Study variables
Data collected during examination included the following: age, body mass index (BMI, kg/m2), waist circumference (cm), triglyceride level (mg/dL), high-density lipoprotein cholesterol level (HDL-C, mg/dL), fasting blood glucose level (mg/dL), gamma-glutamyltransferase level (GGT, U/L), systolic blood pressure (mmHg), diastolic blood pressure (mmHg), smoking status, education level, exercise, presence of cerebrovascular accidents or coronary artery disease, estimated glomerular filtration rate (eGFR, mL/min/1.73 m2), household income (1000 won/month), UACR (mg/g), and the fatty liver index (FLI).
Smoking status was classified as non-smoker, ex-smoker, and non-smoker. Education level was classified as less than high school, high school level, and college or higher degree. The exercise status was defined as a moderate-intensity activity of > 30 min/day for ≥ 5 days/week or high-intensity activity of > 20 min/day for ≥ 3 days/week [22]. The presence of cerebrovascular accidents was defined as a self-reported diagnosis of stroke from a medical doctor. The presence of coronary artery disease was defined as the self-reported diagnosis of myocardial infarction or angina from a medical doctor. The eGFR was calculated using the Chronic Kidney Disease Epidemiology Collaboration equation as in a previous study [23]. Urinary albumin levels were measured from random samples using a turbidimetric immunoassay (Hitachi Automatic Analyzer 7600, Hitachi). Urinary creatinine levels were measured using a colorimetric method (Hitachi Automatic Analyzer 7600, Hitachi). Urine albumin and creatinine levels were measured at the same laboratory for all surveys. The inter-assay coefficient of variation for all laboratory work was consistently low (< 3.1%). The UACR was calculated as mg per g of creatinine (mg/g). The cut-off points of the UACR quartiles were 0.04-0.52 mg/g for the first quartile, 0.53-1.65 mg/g for the second quartile, 1.66-3.87 mg/g for the third quartile, and 3.88-29.9 mg/g for the fourth quartile. LGA was defined as an UACR within the highest quartile, as previously defined [24]. The FLI was calculated in accordance with Bedogni's equation as follows [25]:
FLI =

The FLI ranges between 0 and 100. Previous studies have shown that the FLI score has a high concordance or accuracy for the diagnosis of NAFLD using gold standard methods [25,26]. We defined the NAFLD group as patients with an FLI of ≥ 60, as previously defined [26].
MetS was defined in accordance with the Adult Treatment Panel III criteria using the modified cutoff values for Asian populations as suggested by the Asia-Pacific guidelines [27].
Statistical analyses
All data were analyzed using the statistical software SAS (Version 9.4, SAS Campus Drive, Cary, NC, USA). Categorical variables were expressed as both counts and percentages. Continuous variables were expressed as means ± standard deviation (SD) or standard error (SD). Pearson's χ2 or Fisher's exact test was used to analyze categorical variables. For continuous variables, means were compared using the Student's t-test. Linear regression analysis was performed to assess independent predictors of UACR. Logistic regression analyses were used to estimate the odds ratios (ORs) and 95% confidence intervals (CIs), which were then applied to determining the relationship between NAFLD and LGA. Multivariate analyses were adjusted for age, household income, smoking status, education level, exercise, eGFR, BMI, waist circumference, triglyceride level, HDL-C level, fasting blood glucose level, systolic blood pressure, diastolic blood pressure, and presence of cerebrovascular accident or coronary artery disease. A P-value of < 0.05 was considered statistically significant.
Results
Clinical characteristics of the study participants
The number of participants in the non-NAFLD and NAFLD groups were 1180 and 210, respectively. The clinical characteristics of the participants are shown in Table 1. The participants in the NAFLD group were older than those in the non-NAFLD group. BMI, waist circumference, triglyceride level, fasting blood glucose level, systolic blood pressure, and diastolic blood pressure were higher in the NAFLD group than in the non-NAFLD group. The HDL-C level was lower in the NAFLD group than in the non-NAFLD group. The proportion of current smokers was greater in the NAFLD group than in the non-NAFLD group. There were no significant differences with regard to education level, exercise status, presence of cerebrovascular accident or coronary artery disease, eGFR level, and household income between the two groups.
Clinical characteristics of study participants according to the presence of NAFLD
| Variables | Non-NAFLD (n = 1180) | NAFLD (n = 210) | P-value* |
|---|---|---|---|
| Age (years) | 50.5 ± 17.1 | 48.0 ± 14.1 | 0.027 |
| Body mass index (kg/m2) | 23.0 ± 2.6 | 27.4 ± 2.6 | <0.001 |
| Waist circumference (cm) | 81.7 ± 7.8 | 94.7 ± 6.7 | <0.001 |
| Triglycerides (mg/dL) | 117.2 ± 69.0 | 256.5 ± 154.4 | <0.001 |
| HDL-C (mg/dL) | 50.5 ± 11.5 | 44.5 ± 9.4 | <0.001 |
| Fasting blood glucose (mg/dL) | 92.2 ± 9.0 | 97.7 ± 9.4 | <0.001 |
| Systolic blood pressure (mmHg) | 118.7 ± 15.1 | 122.9 ± 13.9 | <0.001 |
| Diastolic blood pressure (mmHg) | 76.8 ± 9.6 | 81.4 ± 9.3 | <0.001 |
| Smoking habits | <0.001 | ||
| Non-smoker | 310 (26.3%) | 34 (16.2%) | |
| Ex-smoker | 477 (40.4%) | 79 (37.6%) | |
| Current smoker | 393 (33.3%) | 97 (46.2%) | |
| Education level | 0.585 | ||
| Less than high school | 310 (26.3%) | 49 (23.3%) | |
| High school | 419 (35.5%) | 74 (35.2%) | |
| College or more | 451 (38.2%) | 87 (41.4%) | |
| Exercise (%) | 597 (50.6%) | 92 (43.8%) | 0.070 |
| Cerebrovascular accident (%) | 22 (1.9%) | 2 (1.0%) | 0.350 |
| Coronary artery disease (%) | 31 (2.6%) | 7 (3.3%) | 0.563 |
| eGFR (mL/min/1.73m2) | 90.7 ± 15.5 | 90.8 ± 15.5 | 0.942 |
| Household income (1000won/month) | 503.8 ± 1652.6 | 432 ± 731.4 | 0.538 |
| Fatty liver index | 23.6 ± 16.3 | 73.8 ± 9.6 | <0.001 |
Data are expressed as numbers (percentages) for categorical variables and as mean ± standard deviation for continuous variables.
*P-values were determined using the Student's t-test for continuous variables and Pearson χ2 or Fisher's exact test for categorical variables. Abbreviations: NAFLD, non-alcoholic fatty liver disease; HDL-C, high-density lipoprotein cholesterol; eGFR, estimated glomerular filtration rate.
Association between albuminuria and NAFLD
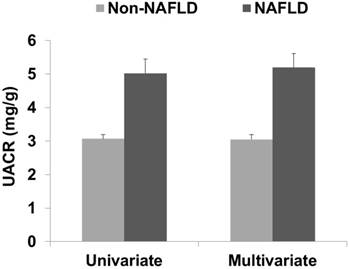
In the univariate analysis, the UACR in the non-NAFLD and NAFLD groups was 3.07 ± 0.13 and 5.02 ± 0.42, respectively (data are shown as mean ± SE, P < 0.001; Figure 2). In the multivariate analysis, the UACR in the non-NAFLD and NAFLD groups was 3.05 ± 0.14 and 5.19 ± 0.42, respectively (P < 0.001). The correlation coefficients between the FLI and UACR were 0.124 in the Pearson's correlation test and 0.084 in the partial correlation test (P < 0.001 and P = 0.002, respectively). Linear regression analysis showed a positive association between the FLI and UACR in both the univariate and multivariate analyses (Table 2).
UACR according to the presence of NAFLD. The data are expressed as means and standard errors. The multivariate analysis was adjusted for age, household income, smoking status, education level, exercise, estimated glomerular filtration rate, body mass index, waist circumference, triglyceride level, high-density lipoprotein cholesterol level, fasting blood glucose level, systolic blood pressure, diastolic blood pressure, cerebrovascular accident, and coronary artery disease. Abbreviations: UACR, urine albumin/creatinine ratio; Non-NAFLD, participants without non-alcoholic fatty liver disease; NAFLD, participants with non-alcoholic fatty liver disease.
Linear regression analyses of the UACR
| Independent variables | Univariate | Multivariate | |||
|---|---|---|---|---|---|
| Non-standardized β ± SE | P-value* | Non-standardized β ± SE | P-value* | ||
| Fatty liver index | 0.025 ± 0.005 | <0.001 | 0.042 ± 0.013 | 0.002 | |
| Age | 0.050 ± 0.008 | <0.001 | 0.043 ± 0.013 | 0.001 | |
| Household income | 0.000 ± 0.000 | 0.177 | 0.000 ± 0.000 | 0.349 | |
| Smoking habits | 0.550 ± 0.167 | 0.001 | 0.439 ± 0.169 | 0.010 | |
| Education level | -0.840 ± 0.161 | <0.001 | -0.459 ± 0.183 | 0.012 | |
| Exercise | 0.022 ± 0.258 | 0.931 | 0.242 ± 0.255 | 0.344 | |
| eGFR | -0.030 ± 0.008 | <0.001 | 0.015 ± 0.011 | 0.180 | |
| Body mass index | 0.106 ± 0.042 | 0.012 | -0.045 ± 0.091 | 0.622 | |
| Waist circumference | 0.055 ± 0.014 | <0.001 | -0.023 ± 0.032 | 0.479 | |
| Triglycerides | 0.002 ± 0.001 | 0.064 | -0.004 ± 0.002 | 0.061 | |
| HDL-C | -0.006 ± 0.011 | 0.585 | 0.004 ± 0.013 | 0.743 | |
| Fasting blood glucose | 0.045 ± 0.014 | 0.001 | 0.007 ± 0.015 | 0.628 | |
| Systolic blood pressure | 0.046 ± 0.009 | <0.001 | 0.006 ± 0.012 | 0.601 | |
| Diastolic blood pressure | 0.046 ± 0.013 | 0.001 | 0.037 ± 0.018 | 0.043 | |
| Cerebrovascular accident | 2.733 ± 0.988 | 0.006 | 1.971 ± 0.982 | 0.045 | |
| Coronary artery disease | 1.687 ± 0.790 | 0.033 | 1.021 ± 0.793 | 0.198 | |
*The dependent variable was the UACR, and the multivariate analysis was adjusted for age, household income, smoking status, education level, exercise, eGFR, body mass index, waist circumference, triglyceride level, HDL-C level, fasting blood glucose level, systolic blood pressure, diastolic blood pressure, cerebrovascular accident, and coronary artery disease.
Abbreviations: UACR, urine albumin/creatinine ratio; SE, standard error; eGFR, estimated glomerular filtration rate; HDL-C, high-density lipoprotein cholesterol.
The number of participants with LGA was 226 (22.5%) in the non-NAFLD group and 81 (38.6%) in the NAFLD group (P < 0.001). Logistic regression analysis showed that the OR for LGA with NAFLD was 2.16 (95% CI, 1.58-2.94; P < 0.001) in the univariate analysis and 2.31 (95% CI, 1.47-3.61; P < 0.001) in the multivariate analysis. The OR for LGA with a 1 unit increase in the FLI was 1.01 (95% CI, 1.01-1.02; P < 0.001) in the univariate analysis and 1.02 (95% CI, 1.01-1.04; P = 0.002) in the multivariate analysis.
Subgroup analyses according to age and the presence of MetS
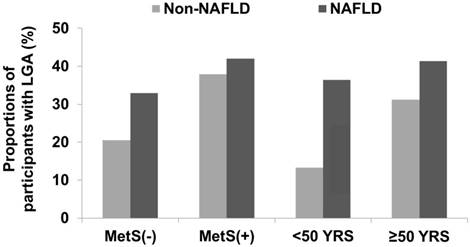
The number of participants with MetS was 140 in the non-NAFLD group and 131 in the NAFLD group. Participants aged < 50 years were 571 in the non-NAFLD and 118 in the NAFLD group. Among the participants without MetS, the UACR in the non-NAFLD and NAFLD groups was 2.86 ± 0.13 and 4.18 ± 0.58, respectively (data shown as mean ± SE; P = 0.029). Among the participants with MetS, the UACR in the non-NAFLD and NAFLD groups was 4.60 ± 0.48 and 5.54 ± 0.57, respectively (P = 0.209). Among the participants aged < 50 years, the UACR in the non-NAFLD and NAFLD groups was 2.16 ± 0.13 and 5.07 ± 0.57, respectively (P < 0.001). For participants aged ≥ 50 years, the UACR in the non-NAFLD and NAFLD groups was 3.92 ± 0.22 and 4.96 ± 0.62, respectively (P = 0.114). The participants with LGA showed similar trends in UACR (Figure 3).
Proportions of participants with LGA according to age or presence of MetS. Among the study population without MetS, the number of participants with LGA was 213 (20.5%) in the non-NAFLD group and 26 (32.9%) in the NAFLD group (P = 0.009). Among participants with MetS, those with LGA were 53 (37.9%) in the non-NAFLD group and 55 (42.0%) in the NAFLD group (P = 0.488). Among participants aged < 50 years, those with LGA were 76 (13.3%) in the non-NAFLD group and 43 (36.4%) in the NAFLD group (P < 0.001). Among participants aged ≥ 50 years, those with LGA were 190 (31.2%) in the non-NAFLD group and 37 (41.3%) in the NAFLD group (P = 0.054). Abbreviations: LGA, low-grade albuminuria; MetS, metabolic syndrome.
Discussion
Our study included only men without DM and with a UACR < 30 mg/g. The UACR in the NAFLD group was higher than that in the non-NAFLD group. The FLI as a continuous variable was correlated with the UACR in both correlation and linear regression analyses. NAFLD as a categorical variable was associated with the presence of LGA. Subgroup analyses according to the presence of MetS or age (< 50 or ≥ 50 years) showed that the association between NAFLD and UACR was stronger in participants without MetS and in those aged < 50 years.
Our study did not include women. NAFLD is a sexual dimorphic disease, in which premenopausal women have a lower prevalence of NAFLD compared to men or postmenopausal women [28]. Carulli et al. evaluated difference in patients with NAFLD according to sex and showed that men with NAFLD were on an average 10 years younger than women with NAFLD [29]. They suggested that physiological levels of estrogen might be protective for the development of NAFLD due to the improvement in insulin sensitivity, dyslipidemia, and visceral fat accumulation [29]. Postmenopausal women have a higher risk of NAFLD compared to premenopausal women, and the risk of NAFLD in these women was comparable to that of men [30]. In addition, hormone replacement therapy was associated with a decreased risk of NAFLD after menopause [31]. In our study, the prevalence of NAFLD was approximately 15.1%. Although our study reported data exclusively for men, we also performed similar analyses for female patients and our results did not show any significant differences between the two variables (data not shown). The prevalence of NAFLD in women was below 15.1%. A very low prevalence in women may lead to negative results, but instead may be an informative result for postmenopausal women.
The potential association between NAFLD and kidney disease is an interesting concept; however, cause-effect relationship is inconclusive and complex. NAFLD and kidney disease share risk factors, such as metabolic disturbances and inflammation. Previous studies have suggested that NAFLD can lead to chronic kidney disease through dyslipidemia, hypertension, insulin resistance, chronic inflammation, or oxidative stress; however, these studies have defined chronic kidney disease based on the eGFR alone and/or urine dipstick test results for overt proteinuria [32-37]. Overt proteinuria and decrease in the eGFR are markers for an advanced stage of chronic kidney disease.
Some studies have focused on the association between NAFLD and microalbuminuria [38-41]. Casoinic et al. enrolled patients with type 2 DM and showed there was a positive association between NAFLD and microalbuminuria [39]. However, DM per se is a strong risk factor for albuminuria and DM-specific renal pathologies, such as glomerular vasculopathy or hyperfiltration, which may lead to confusion regarding the independent association between NAFLD and albuminuria in patients with DM. Therefore, the exclusion of patients with DM may help identify an independent association between the two variables.
A UACR of < 30 mg/g has classically been defined as normal. However, the amount of albuminuria is positively correlated with poor outcomes. It is difficult to definitely distinguish participants with ratios below a cut-off value using a single cut-off point from those above. Therefore, the threshold of UACR ≥ 30 mg/g associated with adverse outcomes is not absolute [42]. Recent studies have demonstrated adverse outcomes in participants with LGA [17-20]. The prevalence of LGA in the general population with or without comorbidities is greater than that of micro-albuminuria or overt proteinuria. In addition, LGA presents at an earlier stage of renal damage than micro-albuminuria or overt proteinuria. Therefore, early detection and intervention of LGA would be more effective in the prevention of the progression of chronic kidney disease or other pathologies.
Lin et al. investigated the association between LGA and NAFLD in a Chinese population [21]. Their study showed that NAFLD was positively associated with LGA, and the relationship was greater in men and/or the younger population than in women and/or the elderly population. In addition, there were no significant differences between the two variables in patients with DM. However, their data could not completely exclude patients with hepatitis B and did not include chronic diseases, such as cerebrovascular accidents or coronary artery disease, which would be confounding factors for the UACR. Our data completely excluded patients with hepatitis B and C using laboratory findings, such as hepatitis B surface antigen or anti-HCV antibody, and included patients with cerebrovascular accidents or coronary artery disease. The results of our study and the study by Lin et al. were similar. Significant differences were observed in young adults or participants without MetS, which indicated that the association between NAFLD and LGA was greater in participants without concurrent MetS.
This study has several limitations. First, it was a retrospective cross-sectional study. We could not evaluate the causality between NAFLD and LGA. Second, we used a single urine spot sample to calculate the UACR. Third, NAFLD was not defined using gold standard methods, such as liver biopsy. As liver biopsies are invasive and potentially risky, it would be difficult to perform to identify NAFLD in an epidemiologic study [3]. Clinical practice guidelines recommend that validated steatosis score systems, such as the FLI, NAFLD liver fat score, NAFLD fibrosis score, or fibrosis-4 score, would be valuable to predict the presence of NAFLD for a large-scale screening study [43]. Among these, FLI is one of the best-validated methods for predicting NAFLD. The FLI defined according to Bedogni et al. is one of the most popular equations for predicting fatty liver disease and a previous study using a dichromatic category (i.e., presence or absence of steatosis) showed a high sensitivity and specificity [25]. However, the FLI is limited by its weak association with histological levels of steatosis [44]. A recent study evaluated the diagnostic validity, level of histologic steatosis, and metabolic parameters of a new semi-quantitative index using ultrasonographic findings [45]. This index accurately identified histological severity and was associated with various metabolic indicators.
In conclusion, NAFLD was associated with LGA in men without DM in this study. Therefore, participants with a relatively high FLI or NAFLD should be closely monitored for LGA, especially if they are men without evidence of MetS. A prospective, multi-ethnic study, including accurate parameters such as UACR, a 24-hour urine sample, and a semi-quantitative ultrasonographic index assessing both the presence and grade of NAFLD, is warranted to overcome these limitations.
Acknowledgements
This study was supported by the National Research Foundation of Korea (NRF) grant funded by the Korea government (Ministry of Science and ICT) (2017R1C1B5077075).
Competing Interests
The authors have declared that no competing interest exists.
References
1. Nascimbeni F, Pais R, Bellentani S. et al. From NAFLD in clinical practice to answers from guidelines. J Hepatol. 2013;59:859-871
2. Leoni S, Tovoli F, Napoli L. et al. Current guidelines for the management of non-alcoholic fatty liver disease: A systematic review with comparative analysis. World J Gastroenterol. 2018;24:3361-3373
3. Italian Association for the Study of the Liver (AISF). AISF position paper on nonalcoholic fatty liver disease (NAFLD): Updates and future directions. Dig Liver Dis. 2017;49:471-483
4. Lonardo A, Nascimbeni F, Mantovani A. et al. Hypertension, diabetes, atherosclerosis and NASH: Cause or consequence? J Hepatol. 2018;68:335-352
5. Petersen KF, Dufour S, Feng J. et al. Increased prevalence of insulin resistance and nonalcoholic fatty liver disease in Asian-Indian men. Proc Natl Acad Sci U S A. 2006;103:18273-18277
6. Vernon G, Baranova A, Younossi ZM. Systematic review: the epidemiology and natural history of non-alcoholic fatty liver disease and non-alcoholic steatohepatitis in adults. Aliment Pharmacol Ther. 2011;34:274-285
7. Younossi ZM, Koenig AB, Abdelatif D. et al. Global epidemiology of nonalcoholic fatty liver disease-Meta-analytic assessment of prevalence, incidence and outcomes. Hepatology. 2015;64:73-84
8. Wah-Kheong C, Khean-Lee G. Epidemiology of a fast emerging disease in the Asia-Pacific region: non-alcohol fatty liver disease. Hepatol Int. 2013;7:65-71
9. Lonardo A, Ballestri S, Marchesini G. et al. Nonalcoholic fatty liver disease: a precursor of the metabolic syndrome. Dig Liver Dis. 2015;47:181-190
10. Targher G, Day CP, Bonora E. Risk of cardiovascular disease in patients with nonalcoholic fatty liver disease. N Engl J Med. 2010;363:1341-1350
11. Choi DH, Lee SJ, Kang CD. et al. Nonalcoholic fatty liver disease is associated with coronary artery disease in Koreans. World J Gastroenterol. 2013;19:6453-6457
12. Lee YH, Kim SU, Song K. et al. Sarcopenia is associated with significant liver fibrosis independently of obesity and insulin resistance in nonalcoholic fatty liver disease: Nationwide surveys (KNHANES 2008-2011). Hepatology. 2016;63:776-786
13. Ahn SH, Seo DH, Kim SH. et al. The relationship between fatty liver index and bone mineral density in Koreans: KNHANES 2010-2011. Osteoporos Int. 2017 [Epub ahead of print]
14. Petta S, Valenti L, Bugianesi E. et al. A "systems medicine" approach to the study of non-alcoholic fatty liver disease. Dig Liver Dis. 2016;48:333-342
15. Targher G, Byrne CD, Lonardo A. et al. Non-alcoholic fatty liver disease and risk of incident cardiovascular disease: A meta-analysis. J Hepatol. 2016;65:589-600
16. Kidney Disease. Improving Global Outcomes (KDIGO) Blood Pressure Work Group. KDIGO Clinical Practice Guideline for the Management of Blood Pressure in Chronic Kidney Disease. Kidney Int Suppl. 2012;2:337-414
17. Lieb W, Mayer B, Stritzke J. et al. Association of low-grade urinary albumin excretion with left ventricular hypertrophy in the general population: the MONICA/KORA Augsburg Echocardiographic Substudy. Nephrol Dial Transplant. 2006;21:2780-2787
18. Katz DH, Selvaraj S, Aguilar FG. et al. Association of low-grade albuminuria with adverse cardiac mechanics: findings from the hypertension genetic epidemiology network (HyperGEN) study. Circulation. 2014;129:42-50
19. Hong JW, Ku CR, Noh JH. et al. Association between hearing impairment and albuminuria in the Korean adults: The 2011-2012 Korean National Health and Nutrition Examination Survey. Medicine. 2015;94:e1840
20. Tanaka F, Komi R, Makita S. et al. Low-grade albuminuria and incidence of cardiovascular disease and all-cause mortality in non-diabetic and normotensive individuals. J Hypertens. 2016;34:506-512
21. Lin L, Lu J, Huang X. et al. Nonalcoholic fatty liver disease is associated with low-grade albuminuria in Chinese adults (change not displayed). QJM. 2016;109:737-743
22. World Health Organization. Global recommendations on physical activity for health. Geneva: World Health Organization. 2010:19 Aug, 2016 Available: http://apps.who.int/iris/ bitstream/10665/44399/1/9789241599979_eng.pdf
23. Levey AS, Stevens LA, Schmid CH. et al. A new equation to estimate glomerular filtration rate. Ann Intern Med. 2009;150:604-612
24. Zhang J, Chen Y, Xu Y. et al. Low-Grade Albuminuria Is Associated with Metabolic Syndrome and Its Components in Middle-Aged and Elderly Chinese Population. PLoS One. 2013;8:e65597
25. Bedogni G, Bellentani S, Miglioli L. et al. The fatty liver index: a simple and accurate predictor of hepatic steatosis in the general population. BMC Gastroenterol. 2006:6 33
26. Gastaldelli A, Kozakova M, Højlund K. et al. Fatty liver is associated with insulin resistance, risk of coronary heart disease, and early atherosclerosis in a large European population. Hepatology. 2009;49:1537-1544
27. Grundy SM, Cleeman JI, Daniels SR. et al. Diagnostic and management of the metabolic syndrome: an American Heart Association/National Heart, Lung, and Blood Institute Scientific Statement. Circulation. 2005;112:2735-2752
28. Ballestri S, Nascimbeni F, Baldelli E. et al. NAFLD as a sexual dimorphic disease: Role of gender and reproductive status in the development and progression of nonalcoholic fatty liver disease and inherent cardiovascular risk. Adv Ther. 2017;34:1291-1326
29. Carulli L, Lonardo A, Lombardini S. et al. Gender, fatty liver and GGT. Hepatology. 2006;44:278-279
30. Yang JD, Abdelmalek MF, Pang H. et al. Gender and menopause impact severity of fibrosis among patients with nonalcoholic steatohepatitis. Hepatology. 2014;59:1406-1414
31. McKenzie J, Fisher BM, Jaap AJ. et al. Effects of HRT on liver enzyme levels in women with type 2 diabetes: a randomized placebo-controlled trial. Clin Endocrinol (Oxf). 2006;65:40-44
32. Targher G, Chonchol MB, Byrne CD. CKD and nonalcoholic fatty liver disease. Am J Kidney Dis. 2014;64:638-652
33. Targher G, Chonchol M, Bertolini L. et al. Increased risk of CKD among type 2 diabetics with nonalcoholic fatty liver disease. J Am Soc Nephrol. 2008;19:1564-1570
34. Chang Y, Ryu S, Sung E. et al. Nonalcoholic fatty liver disease predicts chronic kidney disease in nonhypertensive and nondiabetic Korean men. Metabolism. 2008;57:569-576
35. Arase Y, Suzuki F, Kobayashi M. et al. The development of chronic kidney disease in Japanese patients with non-alcoholic fatty liver disease. Intern Med. 2011;50:1081-1087
36. Targher G, Mantovani A, Pichiri I. et al. Nonalcoholic fatty liver disease is independently associated with an increased incidence of chronic kidney disease in patients with type 1 diabetes. Diabetes Care. 2014;37:1729-1736
37. Mantovani A, Zaza G, Byrne CD. et al. Nonalcoholic Fatty Liver Disease Increases Risk of Incident Chronic Kidney Disease: a Systematic Review and Meta-Analysis. Metabolism. 2017 [Epub ahead of print]
38. Yilmaz Y, Alahdab YO, Ozdogan O. et al. Non-alcoholic fatty liver disease and microalbuminuria in non-diabetic patients: role of insulin resistance. Intern Med J. 2009;39:709-710
39. Casoinic F, Sâmpelean D, Bădău C. et al. Nonalcoholic fatty liver disease-a risk factor for microalbuminuria in type 2 diabetic patients. Rom J Intern Med. 2009;47:55-59
40. Kim BJ, Kim BS, Kang JH. The association between serum ferritin level, microalbuminuria and non-alcoholic fatty liver disease in non-diabetic, non-hypertensive men. Clin Exp Hypertens. 2014;36:380-385
41. Kasapoglu B, Turkay C, Yalcın KS. et al. Increased microalbuminuria prevalence among patients with nonalcoholic fatty liver disease. Ren Fail. 2016;38:15-19
42. de Zeeuw D. Albuminuria: a target for treatment of type 2 diabetic nephropathy. Semin Nephrol. 2007;27:172-181
43. European Association for the Study of the Liver (EASL); European Association for the Study of Diabetes (EASD); European Association for the Study of Obesity (EASO). EASL-EASD-EASO Clinical Practice Guidelines for the management of non-alcoholic fatty liver disease. J Hepatol. 2016;64:1388-1402
44. Fedchuk L, Nascimbeni F, Pais R. et al. Performance and limitations of steatosis biomarkers in patients with nonalcoholic fatty liver disease. Aliment Pharmacol Ther. 2014;40:1209-1222
45. Ballestri S, Nascimbeni F, Baldelli E. et al. Ultrasonographic fatty liver indicator detects mild steatosis and correlates with metabolic/histological parameters in various liver diseases. Metabolism. 2017;72:57-65
Author contact
![]() Corresponding author: Jun-Young Do, MD, Department of Internal Medicine, Yeungnam University Hospital, 317-1 Daemyung-Dong, Nam-Ku, Daegu 705-717, Korea. Fax: +82-53-654-8386, Phone: +82-53-680-3844, E-mail: jydoyu.ac.kr
Corresponding author: Jun-Young Do, MD, Department of Internal Medicine, Yeungnam University Hospital, 317-1 Daemyung-Dong, Nam-Ku, Daegu 705-717, Korea. Fax: +82-53-654-8386, Phone: +82-53-680-3844, E-mail: jydoyu.ac.kr