Impact Factor ISSN: 1449-1907
- Issue 9; 2026
- Issue 8; 2026
- Issue 7; 2026
- Issue 6; 2026
- Issue 5; 2026
- Volume 23; 2026
- Past Issues
- Editorial Board
- Cover Images
- Index & Coverage
- Cover Suggestion
- Special Issues
Introduction
Materials and methods
Results
Discussion
Supplementary Material
Acknowledgements
References

 Global reach, higher impact
Int J Med Sci 2018; 15(14):1676-1685. doi:10.7150/ijms.28728 This issue Cite
Research Paper
Elevated mRNA Levels of AURKA, CDC20 and TPX2 are associated with poor prognosis of smoking related lung adenocarcinoma using bioinformatics analysis
Meng-Yu Zhang, Xiao-Xia Liu, Hao Li, Rui Li, Xiao Liu, Yi-Qing Qu ![]()
Department of Respiratory Medicine, Qilu Hospital of Shandong University, Jinan 250012, China
Received 2018-7-24; Accepted 2018-10-11; Published 2018-11-5
Abstract
Background and aim: Adenocarcinoma is a very common pathological subtype for lung cancer. We aimed to identify the gene signature associated with the prognosis of smoking related lung adenocarcinoma using bioinformatics analysis.
Methods: A total of five gene expression profiles (GSE31210, GSE32863, GSE40791, GSE43458 and GSE75037) have been identified from the Gene Expression Omnibus (GEO) database. Differentially expressed genes (DEGs) were analyzed using GEO2R software and functional and pathway enrichment analysis. Furthermore, the overall survival (OS) and recurrence-free survival (RFS) have been validated using an independent cohort from the Cancer Genome Atlas (TCGA) database.
Results: We identified a total of 58 DEGs which mainly enriched in ECM-receptor interaction, platelet activation and PPAR signaling pathway. Then according to the enrichment analysis results, we selected three genes (AURKA, CDC20 and TPX2) for their roles in regulating tumor cell cycle and cell division. The results showed that the hazard ratio (HR) of the mRNA expression of AURKA for OS was 1.588 with (1.127-2.237) 95% confidence interval (CI) (P=0.009). The mRNA levels of CDC20 (HR 1.530, 95% CI 1.086-2.115, P=0.016) and TPX2 (HR 1.777, 95%CI 1.262-2.503, P=0.001) were also significantly associated with the OS. Expression of these three genes were not associated with RFS, suggesting that there might be many factors affect RFS.
Conclusion: The mRNA signature of AURKA, CDC20 and TPX2 were potential biomarkers for predicting poor prognosis of smoking related lung adenocarcinoma.
Keywords: lung adenocarcinoma, differentially expressed genes, gene ontology, Kaplan-Meier analysis, biomarkers
Introduction
Lung cancer is the most common cause of cancer death worldwide, which account for 27% of all cancer death [1]. Being different from the stable increasing survival rates in most of the other cancers, the 5-year survival rate of lung cancer is less than 18% at present [2]. Lung adenocarcinoma is the most common type of lung cancer comprising around 40% of all lung cancer [3]. Smoking is a main risk factor for lung cancer, and continuing smokers after diagnosis have worse prognosis than those who abstain from smoking [4]. It is demonstrated that smokers have higher frequencies of genomic alteration compared with non-smokers in lung cancer [5,6]. Therefore, it is essential to manage the patients according to the status of smoking in the diagnosis and treatment of lung cancer. However, the exact profiles of gene alternations in lung adencarcinoma with smokers and non-smokers have not been well understood.
Currently, considerable studies and tools have been reported to characterize gene expression profiles in lung cancer [7-9]. Liu et al have reported that mRNA levels of EPHA4, FGFR2 and EGFR might play important roles in the progression and development of smoking related lung adenocarcinoma [10]. Hu et al have demonstrated that smoking could induced the up-regulation of CDK1, CCNB1 and CDC20 in smoking related lung adenocarcinoma than non-smokers [11]. Furthermore, the elevated mRNA levels of NEK2 and TTK have been reported to increase the risk of mortality of smoking related lung adenocarcinoma [12]. Nowadays, accelerating public databases using the high-throughput microarray and sequencing technology have been established. Bioinformatics analysis basing on the public databases are believed to provide valuable information in disease prediction.
Therefore, our present study was aimed to identify the gene signature associated with the prognosis of smoking related lung adenocarcinoma using bioinformatics analysis. In this present study, we identified 58 DEGs in smoking related lung adenocarcinoma from five GEO datasets, and verified them using an independent cohort from TCGA database.
Materials and methods
Data collection
Gene expression profiles (GSE31210, GSE32863, GSE40791, GSE43458 and GSE75037) were retrieved from the Gene Expression Omnibus (GEO) database (http://www.ncbi.nlm.nih.gov/geo/). In detail, GSE31210 included a total of 226 lung adenocarcinoma tissues which were comprised of 111 smokers and 115 non-smokers [9]. GSE32863 included 58 lung adenocarcinoma tissues and 58 matched normal lung tissues [13]. GSE40791 included 94 lung adenocarcinoma tissues and 100 adjacent normal lung tissues [14]. GSE43458 contained 80 lung adenocarcinoma tissues including 40 smokers and 40 non-smokers [15]. GSE75037 included 83 lung adenocarcinoma tissues and 83 matched normal lung tissues [16].
Identification of DEGs
GEO2R (https://www.ncbi.nlm.nih.gov/geo/geo2r/) is a web tool for screening DEGs by comparing two groups of samples. The procedure of GEO2R is the following: firstly, enter a series accession number in the box. Then, click “Define groups” and enter names for the groups of samples you plan to compare. After samples have been assigned to groups, click “Top 250” to run the test with default parameters. To see more than the top 250 results, or if you want to save the results, the complete results table may be downloaded using the “Save all results” button. The cut-off criterion was set as the P < 0.05 and absolute fold change > 1.5. In addition, the R package ggplot2 package (version 2.2.1, https://cran.r-project.org/web/packages/ggplot2) was used to perform the volcano plots of all the genes among five GEO datasets; Venn Diagram package (version 1.6.17, https://cran.r-project.org/web/packages/VennDiagram/) was applied to identify the overlapping up regulated genes among these five GEO datasets. Moreover, heat maps for the overlapping genes was generated using the pheatmap package (version 1.0.8, https://cran.r-project.org/web/packages/pheatmap).
Pathway and functional enrichment analysis
Kyoto Encyclopedia of Genes and Genomes (KEGG) is a knowledge base for systematic analysis of gene functions. Gene ontology (GO) enrichment analysis predicts the function of the target genes in three aspects, including biological processes, cellular components and molecular function. In our study, we performed GO and KEGG pathway enrichment analysis using the Database for Annotation, Visualization, and Integrated Discovery (DAVID) online tool (version 6.8, https://david.ncifcrf.gov/). P < 0.05 was the threshold for the identification of significant GO terms and KEGG pathways.
Data validation
The validation datasets were download from the Cancer Genome Atlas (TCGA) tools cancer browser (https://genome-cancer.ucsc.edu/). The procedure of select validation datasets is the following: firstly, select a cohort and dataset to explore. Then click HTSeq-Counts to choose gene expression RNAseq, it will jump to another interface and you can download the dataset according to the download link. Finally, we selected 497 smoking related lung adenocarcinoma tissues, which included 75 non-smokers and 422 smokers. Detailed clinical information of patients was showed in Table 1.
Clinical characteristics and correlations with mRNA expression of AURKA, TPX2 and CDC20.
| Characteristic | n=497 | AURKA | TPX2 | CDC20 | ||||||
|---|---|---|---|---|---|---|---|---|---|---|
| Lown=248 | Highn=249 | P value | Lown=248 | Highn=249 | P value | Lown=248 | Highn=249 | P value | ||
| Age (years) | 0.043 | 0.029 | <0.001 | |||||||
| <65 | 214 | 96 | 118 | 96 | 118 | 86 | 128 | |||
| >=65 | 264 | 143 | 121 | 145 | 119 | 156 | 108 | |||
| Not given | 19 | 9 | 10 | 7 | 12 | 6 | 13 | |||
| Gender | <0.001 | 0.005 | 0.005 | |||||||
| Female | 230 | 95 | 135 | 99 | 131 | 99 | 131 | |||
| Male | 267 | 153 | 114 | 149 | 118 | 149 | 118 | |||
| Smoking history | 0.002 | 0.008 | 0.004 | |||||||
| Smoker | 422 | 198 | 224 | 200 | 222 | 199 | 223 | |||
| Non-smoker | 75 | 50 | 25 | 48 | 27 | 49 | 26 | |||
| New tumor event | 0.114 | 0.008 | 0.013 | |||||||
| YES | 118 | 53 | 65 | 47 | 71 | 48 | 70 | |||
| NO | 257 | 138 | 119 | 140 | 117 | 140 | 117 | |||
| Not given | 122 | 57 | 65 | 61 | 61 | 60 | 62 | |||
| Pathological T stage | 0.062 | 0.001 | 0.001 | |||||||
| T1 | 164 | 94 | 70 | 102 | 64 | 100 | 64 | |||
| T2 | 267 | 122 | 145 | 115 | 152 | 115 | 152 | |||
| T3 + T4 | 64 | 31 | 33 | 30 | 34 | 32 | 32 | |||
| unknown | 2 | 1 | 1 | 1 | 1 | 1 | 1 | |||
| Therapy outcome | 0.002 | <0.001 | 0.014 | |||||||
| *CR+PR | 232 | 128 | 104 | 131 | 101 | 127 | 105 | |||
| *SD+PD | 71 | 24 | 47 | 23 | 48 | 27 | 44 | |||
| unknown | 194 | 96 | 98 | 94 | 100 | 94 | 100 | |||
*CR+PR:Complete Remission+Partial Remission.
*SD+PD:Stable Disease+Progressive Disease.
Statistical analyses
Statistical analyses were performing using SPSS IBM for windows version 23.0 (IBM Corporation, Armonk, NY, USA) and GraphPad Prism 7.0 (GraphPad Software, Inc., La Jolla, CA, USA). Single comparison of the expression rates between two groups were determined by Student's t-test. The comparison of clinical characteristic were determined by Chi-square test or Fisher's exact probability tests. The level of gene expression is bounded by the median, lower than the median was defined as low expression group, on the contrary, higher than the median is high expression group. Kaplan-Meier analysis was performed using validation datasets and examined by Log-rank test. We performed two types of survival outcomes including overall survival (OS) and recurrence-free survival (RFS). OS was defined as the time between the date of surgery and the date of death or last followup, RFS was defined as period from surgery to recurrence or last followup. All P values were two-sides and less than 0.05 were considered statistically significant.
Results
Identification of DEGs
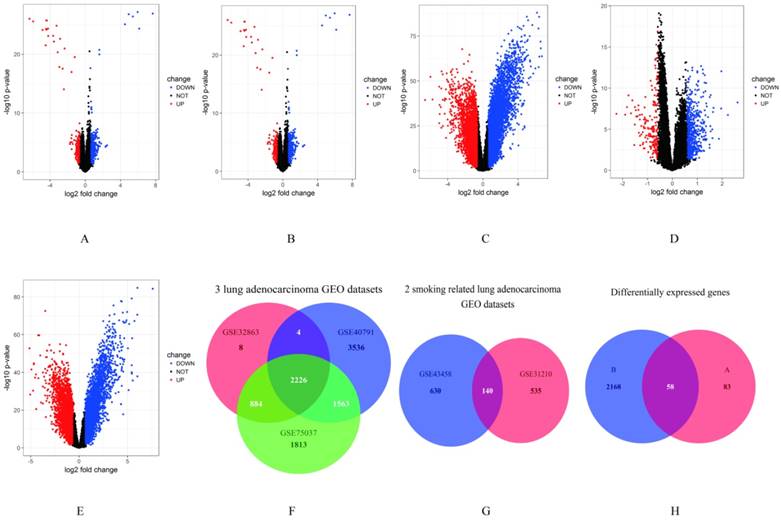
In our study, gene expression profiles from three datasets (including lung adenocarcinoma tissues and non-tumor lung tissues) in lung adenocarcinoma and two datasets (including smokers and non-smokers) in smoking related lung adenocarcinoma were selected to compare gene expression. Genes with P < 0.05 and absolute fold change > 1.5 were considered as DEGs. The results showed that 3564 genes (1682 up-regulated and 1882 down-regulated genes) differentially expressed in GSE32863, 10896 genes (5064 up-regulated and 5832 down-regulated genes) differentially expressed in GSE40791, 7726 genes (3771 up-regulated and 3955 down-regulated genes) differentially expressed in GSE75037, 829 genes (274 up-regulated and 555 down-regulated genes) differentially expressed in GSE31210 and 831 genes (195 up-regulated and 636 down-regulated genes) differentially expressed in GSE43458 (Figure 1A-E). Then, we performed an overlapping analysis of the DEGs in lung adenocarcinoma and smoking related lung adenocarcinoma to identify genes which were specifically over expressed in smoking related lung adenocarcinoma. As showed in Fig. 1F, a total of 2226 genes were significantly differentially expressed in the three lung adenocarcinoma datasets. 140 genes were overlapped in the two smoking related lung adenocarcinoma datasets as showed in Figure 1G. After further screening by overlapping these two subsets of genes, 58 DEGs were identified to be closely related to the smoking related lung adenocarcinoma (Figure 1H, Supplementary Figure S1).
Identification of DEGs. A-E. Volcano plots of the different mRNA expression analysis. X-axis: log 2 fold change; Y-axis: -log10 p-value for each probes; A: There were 829 genes identified to be differentially expressed in GSE31210, including 274 up-regulated and 555 down-regulated genes. B: 3564 genes (1682 up-regulated and 1882 down-regulated genes) identified to be differentially expressed in GSE32863. C: 10896 genes (5064 up-regulated and 5832 down-regulated genes) differentially expressed in GSE40791. D: 831 genes (195 up-regulated and 636 down-regulated genes) in GSE43458. E: 7726 genes (3771 up-regulated and 3955 down-regulated genes) in GSE75037. F-H. Overlap analysis between different datasets. F: A total of 2226 genes were significantly differentially expressed in three lung adenocarcinoma GEO datasets. G: 140 genes were overlapped in two smoking related lung adenocarcinoma GEO datasets. H: There were 58 overlapping genes significantly differentially expressed between smokers and non-smoers of lung adenocarcinoma in five GEO datasets.
Functional enrichment of DEGs
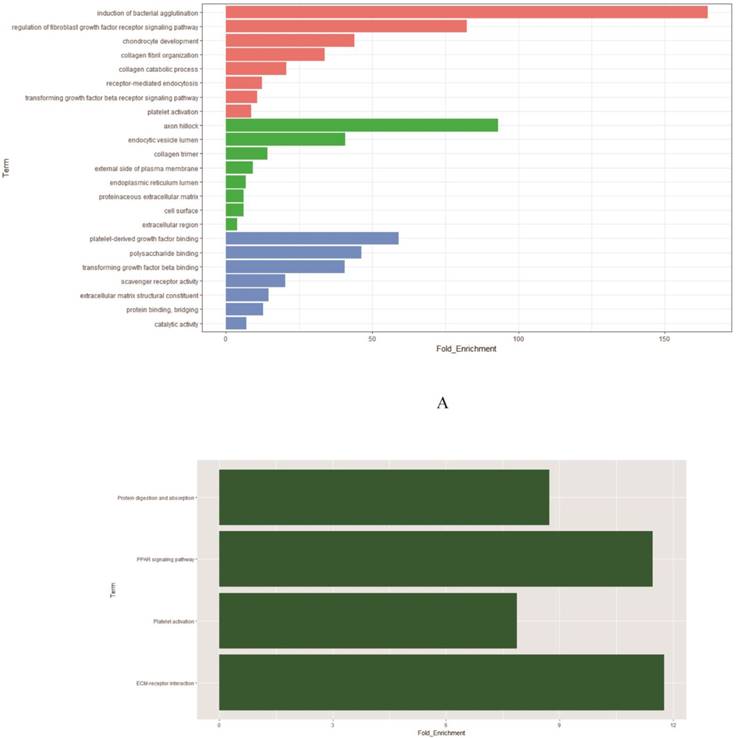
To determine biological functions of the 58 DEGs (Supplementary Table S1), we implemented GO analysis. The results showed that the identified genes were mainly involved in induction of bacterial agglutination and regulation of fibroblast growth factor receptor signaling pathway. The most significantly enriched molecular function concentrated on platelet-derived growth factor binding and polysaccharide binding while axon hillock and endocytic vesicle lumen were the most enriched cellular components (Figure 2A, Supplementary Table S2). Further KEGG analysis was performed to investigate the significance of DEGs in the development of smoking related lung adenocarcinoma. The result showed that 58 DEGs were enriched in four KEGG pathways. Among the four KEGG pathways, ECM-receptor interaction was the most significant one (P=4.06× 10⁻³), followed by platelet activation (P=1.23 × 10⁻²) and PPAR signaling pathway (P=2.59 × 10⁻²) (Figure 2B, Supplementary Table S3). According to the functional enrichment of DEGs, we found that cell cycle were extremely related to the incidence and development of smoking related lung cancer. Thus in our study, we focused on AURKA, CDC20 and TPX2, three critical mitotic checkpoint genes in the mitotic process, which also repeatedly involved in the enriched GO and KEGG pathways for the further study.
Functional enrichment analysis of 58 DEGs. A: The significantly enriched GO categories were calculated. Blue: Molecular function; Green: Cellular component; Red: Biological process. B: Gene networks identified through KEGG analysis of the DEGs.
AURKA, CDC20 and TPX2 were over expressed in lung adenocarcinoma and smoking related lung adenocarcinoma
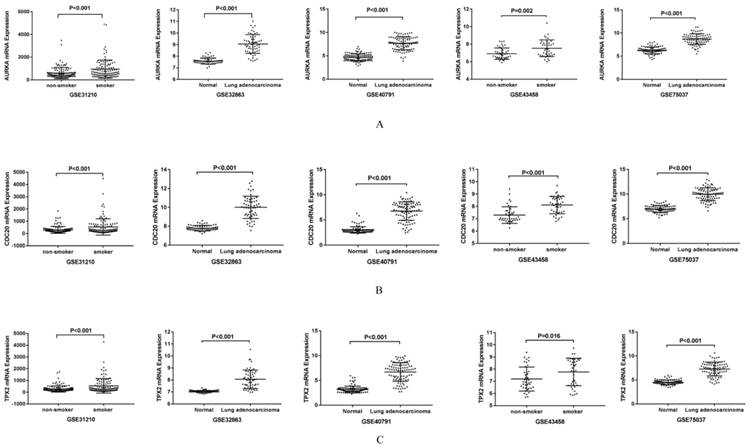
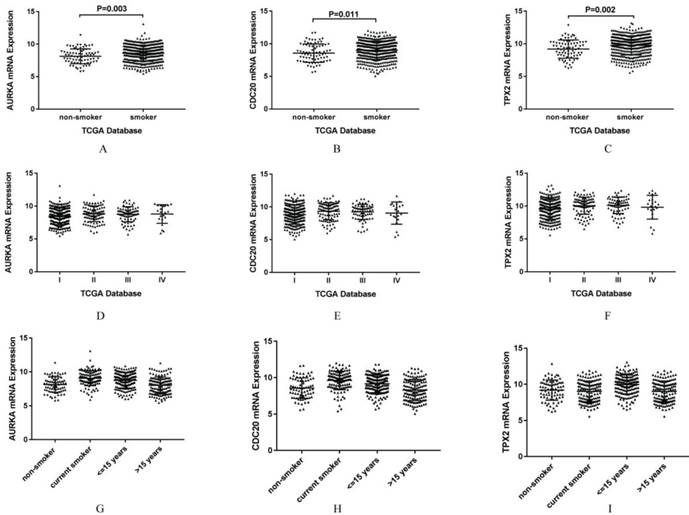
AURKA, CDC20 and TPX2 were selected for further study due to their roles in regulating tumor cell cycle and cell division. The increased expressions of AURKA, CDC20 and TPX2 were identified in all the five GEO datasets (Figure 3). We validated their over expression using an independent cohort with a total of 497 lung adenocarcinoma tissues (75 non-smokers and 422 smokers) retrieved from TCGA database. The mRNA expression levels of AURKA, CDC20 and TPX2 were significant higher in smoker lung adenocarcinoma compared with non-smoker lung adenocarcinoma (P=0.003, 0.002 and 0.011 respectively) (Figure 4A-C). In addition, we found that the mRNA expression levels of these three genes have no significant relationship with clinical stage (Figure 4D-F).
Validation of the gene expression in five GEO datasets. A: Validation of mRNA expression of AURKA in five GEO datasets. B: Validation of mRNA expression of CDC20 in five GEO datasets. C: Validation of mRNA expression of TPX2 in five GEO datasets.
A-C. Validation of the gene expression between non-smoker lung adenocarcinoma and smoker lung adenocarcinoma. A: Validation of mRNA expression of AURKA in TCGA database. B: Validation of mRNA expression of CDC20 in TCGA database. C: Validation of mRNA expression of TPX2 in TCGA database. D-F. Gene expression of smoking related lung adenocarcinoma according to clinical stage in TCGA database. D: AURKA mRNA expression of smoking related lung adenocarcinoma according to clinical stage of TCGA database. E: CDC20 mRNA expression of smoking related lung adenocarcinoma according to clinical stage in TCGA database. F: TPX2 mRNA expression of smoking related lung adenocarcinoma according to clinical stage in TCGA database. G-I. Gene expression of smoking related lung adenocarcinoma according to smoking history in TCGA database. G: AURKA mRNA expression of smoking related lung adenocarcinoma according to smoking history in TCGA database. H: CDC20 mRNA expression of smoking related lung adenocarcinoma according to smoking history in TCGA database. I: TPX2 mRNA expression of smoking related lung adenocarcinoma according to smoking history in TCGA database.
Associations of AURKA, CDC20 and TPX2 expression levels with clinicopathological variables
Clinicopathological characteristics of the smoking related lung adenocarcinoma patients are listed in Table 1. As Table 1 showed, AURKA expression was remarkably positively associated with age (P=0.043), gender (P<0.001), smoking history (P=0.002) and treatment outcome (P=0.002). No significant difference of AURKA mRNA levels was found in patients with pathological T stage (P=0.062) and new tumor event (P=0.114); the elevated CDC20 expression was closely related with age (P<0.001), gender (P=0.005), smoking history (P=0.004), new tumor event (P=0.013), pathological T stage (P=0.001) and therapy outcome (P=0.014); a high expression level of TPX2 was significantly correlated with age (P=0.029), gender (P=0.005), smoking history (P=0.008), new tumor event (P=0.008), pathological T stage (P=0.001) and treatment outcome (P<0.001).
Association of AURKA, CDC20 and TPX2 expression levels with smoking history
We found that the expression levels of AURKA, CDC20 and TPX2 were related to smoking history, so we further analyzed the smoking history (Figure 4G-I). According to smoking history, we divided the lung adenocarcinoma patients into four groups. Group 1 was set as non-smokers, and group 2 as current smokers, group 3 as short reformed smokers (≤ 15 years), as well as group 4 as long reformed smokers (> 15 years). We found that patients with highest expression of AURKA was group 2 (P<0.001 vs group 1; P=0.022 vs group 3; P<0.001 vs group 4), as well as CDC20 (P<0.001 vs group 1; P=0.002 vs group 3; P<0.001 vs group 4), the highest expression level was group 2, while patients with the highest expression of TPX2 was group 3 (P<0.001 vs group 1, 2 and 4).
Association of AURKA, CDC20 and TPX2 expression levels with OS and RFS
To explore whether AURKA, CDC20 and TPX2 expression levels will affect the clinical outcomes, we constructed a prognostic classifier using Kaplan-Meier analysis in the TCGA database. As shown in the Figure 5A-F, AURKA expression was significantly associated with OS (P=0.009) among the smoking related lung adenocarcinoma patients. The median OS in AURKA low expression group was 53.33 months whereas in high expression group was 39.80 months.
Kaplan-Meier survival curves by different mRNA expression levels of AURKA, CDC20 and TPX2 of 497 smoking related lung adenocarcinoma in TCGA database. A: OS between low and high AURKA mRNA expression. B: OS between low and high CDC20 mRNA expression. C: OS between low and high TPX2 mRNA expression. D: RFS between low and high AURKA mRNA expression. E: RFS between low and high CDC20 mRNA expression. F: RFS between low and high TPX2 mRNA expression.
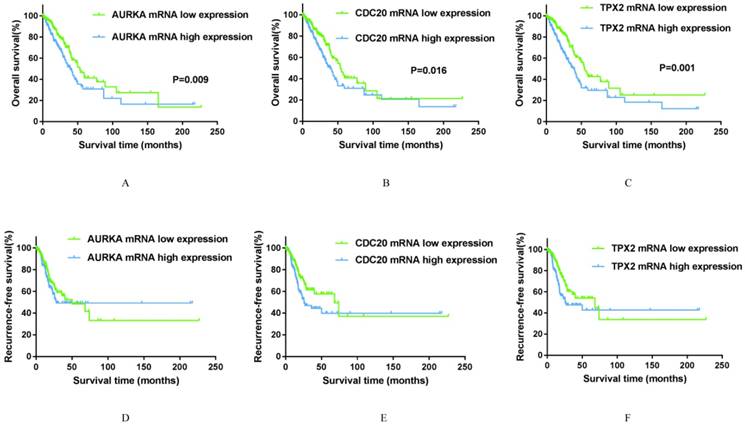
Similarly, higher expression of CDC20 is associated with a shorter overall survival time (P=0.027) among the smoking related lung adenocarcinoma patients. The median OS was 54.07 months in low expression group and 39.03 months in high expression group. As for TPX2, its high expression was remarkably related to both decreased overall survival time (P=0.001). The median OS in low expression group was 53.10 months, while in high expression group was 39.03 months. As for RFS, the expression levels of all these three genes have no significance with RFS statistically. The median RFS in AURKA low expression group was 50.00 months, in CDC20 and TPX2 low expression groups were both 68.17 months. With respect to RFS, it was showed that maybe there are many factors affect RFS in addition to the level of gene expression in statistically. While the median RFS in high expression groups of AURKA, CDC20 and TPX2 were 28.30 months, 25.73 months and 25.73 months respectively, were much shorter than the median RFS in low expression group.
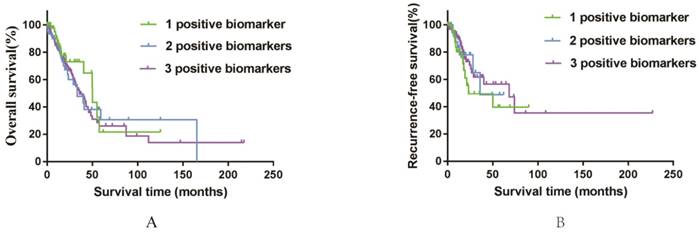
Furthermore, to assess the integrated effects of the three genes expression on the prognosis, we divided all these 497 patients (from the TCGA database) into three groups according to the numbers of positive biomarkers among the high expression of AURKA, TPX2 and CDC20. Group 1 have any one positive biomarker of three genes, group 2 have any two positive biomarkers of three genes and group 3 have all these three biomarkers. According to the divided groups, we performed Kaplan-Meier analysis (Figure 6). Finally, the results showed that the numbers of biomarkers have no direct relations with both OS and RFS for all of the P values > 0.05. While we still could grab that the median OS of group 3 (36.03) was shorter than group 1 (50.03) and group 2 (39.80). It was interesting that the median RFS of group 3 (68.17) was longer than group 1 (23.07) and group 2 (36.70), which maybe indicated that united of these three genes could forecast the RFS of smoking related lung adenocarcinoma to some extent. In conclusion, the elevated expression of AURKA, CDC20 and TPX2 can be used as potential predictive biomarkers in prognostic and recurrence among smoking related lung adenocarcinoma patients.
Kaplan-Meier survival curves by different groups of 497 smoking related lung adenocarcinoma in TCGA database. A: OS among three different groups. B: RFS among three different groups.
Discussion
In the current study, we integrated expression profiles of 782 lung adenocarcinoma patients in five datasets from the GEO database and identified a panel of 58 DEGs. Functional enrichment analysis stressed that these genes were closely related to the carcinogenesis of smoking related lung adenocarcinoma, such as cell cycle, ECM-receptor interaction and cell division. Elevated expression of AURKA, CDC20 and TPX2 were validated via an independent smoking related lung adenocarcinoma cohort from TCGA database. The results showed that the high expression levels of AURKA, CDC20 and TPX2 were related with age, gender, smoking history and therapy outcome. For smoking history, we found current smokers have the highest expression of AURKA and CDC20, while those short reformed smokers (<= 15 years) have the highest expression of TPX2. Kaplan-Meier analysis indicated that AURKA, CDC20 and TPX2 were correlated with OS. As regard to RFS, the results showed that it was affected by many factors in addition to the amount of gene expression.
Cell cycle is controlled by numerous mechanisms and the deregulation of cell cycle is a common feature of human cancer [17]. AURKA, CDC20 and TPX2 were related to the process of cell cycle. AURKA is a putative low-penetrance tumor susceptibility gene in cell cycle regulation and centrosomal function [18]. It have been reported that AURKA was associated with mitosis and related to the development and progression of cancer [19]. CDC20 appears to act as a regulatory protein interacting with several other proteins at multiple points in the cell cycle and it is required for two microtubule-dependent processes, nuclear movement prior to anaphase and chromosome separation as it was annotated in gene database (https://www.ncbi.nlm.nih.gov/gene/). TPX2 has been extensively studied as a mitotic factor critical for organization of microtubule, spindle formation, and Aurora A kinase regulation [20], which plays a critical role in multiple steps of mitotic progression, including microtubule stability during the G1 phase of the cell cycle, chromosome alignment and segregation, and cytokinesis and is aberrantly expressed in various types of human cancers [21]. Recently, many researches have explored the biomarkers in smoking related lung cancer patients; such as Kang et al reported that the three SNPs may contribute to lung cancer susceptibility in never-smoking females [22]. Another study found that high level of cytoplasmic CXCR2 expression is associated with a poor outcome in smoking lung lung adenocarcinoma patients [23]. Xie et al found that cigarette smoking and p53/p21 over-expression are associated with the poor prognosis of non-small cell lung cancer patients [24]. These results suggested that people between smokers and non-smokers have different cancer possibility. So we were concentrated on the smoking related lung adenocarcinoma and identified a total of 58 DEGs between smokers and non-smokers.
With the development of high throughput technology, there are plenty of studies about lung cancer. In our study, we identified 58 DEGs and selected three genes (AURKA, CDC20 and TPX2). We validated their high expression were related to the worse prognosis of smoking related lung adenocarcinoma. There also have many researchers suggested that AURKA, CDC20 and TPX2 were related to lung cancers. For example, Ma et al have reported that non-small cell lung cancer can be inhibited by suppressing AURKA [25]. The interplay between epidermal growth factor receptor (EGFR) and AURKA maybe could provide a new treatment target for lung cancer patients carrying EGFR mutations [26]. The inhibitor of AURKA can suppress the cell proliferation in lung cancer cells [27] and the elevated expression of CDC20 can predict the poor prognosis in lung cancer patients, or even in lung adenocarcinoma patients [28,29]. High level of CDC20 expression was associated with poor prognosis in many cancers in addition to lung cancer [30-32], and it was correlated with tumor grade and stage [33]. Another study suggested that TPX2, the mitosis-associated genes, its high expression was related to a poor prognostic in non-small cell lung cancer [34]. There also have one study according to RNA-seq to found specific dysregulated genes in lung adenocarcinoma [35]. These three genes are not only related to lung cancer but also to other cancers, such as the expression of glioma pathogenesis-related protein 1 (GLIPR1) can regulated AURKA and TPX2 to induced the prostate cancer cell death [36]. The increased level of CDC20 expression could predict poor prognosis of urothelial bladder cancer [37]. Pan et al found the high level of TPX2 expression in prostate cancer [38].
With the development of epigenetic, there are a lot of studies to identify the biomarkers in many cancers. For example, there were many biomarkers can be used in colorectal cancer and bladder cancer [39,40]. Based on the relationships between AURKA, CDC20 and TPX2 and variety of cancers, we have already queried other biomarkers in smoking related lung adenocarcinoma and found that AURKA, CDC20 and TPX2 were closely related to the carcinogenesis of lung adenocarcinoma. In our study, we found that those have high expression levels of these three genes have a worse OS than low expression group. As for RFS, it seemed the high expression group indeed have a worse RFS than low expression group, but there are still many other factors affecting RFS. It suggested that elevated expression of these three genes were associated with poor OS among the smoking related lung adenocarcinoma patients. However, there is a puzzle that the identified genes in training cohorts could not easily be validated in external cohorts [41]. One reason might be the effects of genes have broad confidence intervals so that it is difficult to identified using a single validation database. Another reason is the fact that most of the studies are from single cohort with relative small number, rather than large sample cohorts. To address these issues, validation of the signature genes in several independent cohorts or larger sample cohorts is necessary.
In conclusion, our study indicated that AURKA, CDC20 and TPX2 are over-expressed in smoking related lung adenocarcinoma tissues and their higher mRNA expression levels have a worse prognosis. However, it is vital to conduct more in-depth studies to explore the molecular mechanisms of AURKA, CDC20 and TPX2 contributing to smoking related lung adenocarcinoma in the future.
Supplementary Material
Supplementary figures and tables.
Acknowledgements
This work was supported by grants from the National Natural Science Foundation of China (81372333) and Science and Technology Foundation of Shandong Province (2014GSF118084, 2016GGB14156).
Competing Interests
The authors have declared that no competing interest exists.
References
1. Siegel RL, Miller KD, Jemal A. Cancer statistics. CA Cancer J Clin. 2016;66:7-30
2. Siegel RL, Miller KD, Jemal A. Cancer statistics. CA Cancer J Clin. 2017;67:7-30
3. Zappa C, Mousa SA. Non-small cell lung cancer: current treatment and future advances. Transl Lung Cancer Res. 2016;5:288-300
4. Tanner NT, Kanodra NM, Gebregziabher M. et al. The association between smoking abstinence and mortality in the National Lung Screening Trial. Am J Respir Crit Care Med. 2016;193:534-41
5. Govindan R, Ding L, Griffith M. et al. Genomic landscape of non-small cell lung cancer in smokers and never-smokers. Cell. 2012;150:1121-34
6. Imielinski M, Berger AH, Hammerman PS. et al. Mapping the hallmarks of lung adenocarcinoma with massively parallel sequencing. Cell. 2012;150:1107-20
7. Mao XY, Lee MJ, Zhu J. et al. Genome-wide screen identifies a novel prognostic signature for breast cancer survival. Oncotarget. 2017;8:14003-14016
8. Tabas-Madrid D, Nogales-Cadenas R, Pascual-Montano A. GeneCodis3: a non-redundant and modular enrichment analysis tool for functional genomics. Nucleic Acids Res. 2012;40:W478-83
9. Okayama H, Kohno T, Ishii Y. et al. Identification of genes upregulated in ALK-positive and EGFR/KRAS/ALK-negative lung adenocarcinomas. Cancer Res. 2012;72:100-11
10. Liu Y, Ni R, Zhang H. et al. Identification of feature genes for smoking-related lung adenocarcinoma based on gene expression profile data. Onco Targets Ther. 2016;9:7397-7407
11. Hu Y, Chen G. Pathogenic mechanisms of lung adenocarcinoma in smokers and non-smokers determined by gene expression interrogation. Oncol Lett. 2015;10:1350-1370
12. Landi MT, Dracheva T, Rotunno M. et al. Gene expression signature of cigarette smoking and its role in lung adenocarcinoma development and survival. PLoS One. 2008;3:e1651
13. Selamat SA, Chung BS, Girard L. et al. Genome-scale analysis of DNA methylation in lung adenocarcinoma and integration with mRNA expression. Genome Res. 2012;22:1197-211
14. Zhang Y, Foreman O, Wigle DA. et al. USP44 regulates centrosome positioning to prevent aneuploidy and suppress tumorigenesis. J Clin Invest. 2012;122:4362-74
15. Kabbout M, Garcia MM, Fujimoto J. et al. ETS2 mediated tumor suppressive function and MET oncogene inhibition in human non-smallcell lung cancer. Clin Cancer Res. 2013;19:3383-95
16. Girard L, Rodriguez-Canales J, Behrens C. et al. An expression signature as an aid to the histologic classification of non-small cell lung cancer. Clin Cancer Res. 2016;22:4880-4889
17. Malumbres M, Barbacid M. Cell cycle, CDKs and cancer: a changing paradigm. Nat Rev Cancer. 2009;9:153-66
18. Taylor NJ, Bensen JT, Poole C. et al. Genetic variation in cell cycle regulatory gene AURKA and association with intrinsic breastcancer subtype. Mol Carcinog. 2015;54:1668-77
19. Goldenson B, Crispino JD. The aurora kinases in cell cycle and leukemia. Oncogene. 2015;34:537-45
20. Neumayer G, Nguyen MD. TPX2 impacts acetylation of histone H4 at lysine 16: implications for DNA damage response. PloS one. 2014;9:e110994
21. Li M, Gao K, Chu L. et al. The role of Aurora-A in cancer stem cells. Int J Biochem Cell Biol. 2018;98:89-92
22. Kang HG, Lee SY, Jeon HS. et al. A functional polymorphism in CSF1R gene is a novel susceptibility marker for lung cancer among never-smoking females. J Thorac Oncol. 2014;9:1647-55
23. Saintigny P, Massarelli E, Lin S. et al. CXCR2 expression in tumor cells is a poor prognostic factor and promotes invasion and metastasis in lung adenocarcinoma. Cancer Res. 2013;73:571-82
24. Xie D, Lan L, Huang K. et al. Association of p53/p21 expression and cigarette smoking with tumor progression and poor prognosis in non-small cell lung cancer patients. Oncol Rep. 2014;32:2517-26
25. Ma ZL, Zhang BJ, Wang DT. et al. Tanshinones suppress AURKA through up-regulation of miR-32 expression in non-small cell lung cancer. Oncotarget. 2015;6:20111-20
26. Chen TC, Liu YW, Huang YH. et al. Protein phosphorylation profiling using an in situ proximity ligation assay: phosphorylation of AURKA-elicited EGFR-Thr654 and EGFR-Ser1046 in lung cancer cells. PLoS One. 2013;8:e55657
27. Min YH, Kim W, Kim JE. The Aurora kinase A inhibitor TC-A2317 disrupts mitotic progression and inhibits cancer cell proliferation. Oncotarget. 2016;7:84718-84735
28. Kato T, Daigo Y, Aragaki M. et al. Overexpression of CDC20 predicts poor prognosis in primary non-small cell lung cancer patients. J Surg Oncol. 2012;106:423-30
29. Shi R, Sun Q, Sun J. et al. Cell division cycle 20 overexpression predicts poor prognosis for patients with lung adenocarcinoma. Tumour Biol. 2017;39:1010428317692233
30. Moura IM, Delgado ML, Silva PM. et al. High CDC20 expression is associated with poor prognosis in oral squamous cell carcinoma. J Oral Pathol Med. 2014;43:225-31
31. Chang DZ, Ma Y, Ji B. et al. Increased CDC20 expression is associated with pancreatic ductal adenocarcinoma differentiation and progression. J Hematol Oncol. 2012;5:15
32. Li J, Gao JZ, Du JL. et al. Increased CDC20 expression is associated with development and progression of hepatocellular carcinoma. Int J Oncol. 2014;45:1547-55
33. Gayyed MF, El-Maqsoud NM, Tawfiek ER. et al. A comprehensive analysis of CDC20 overexpression in common malignant tumors from multiple organs: its correlation with tumor grade and stage. Tumour Biol. 2016;37:749-62
34. Schneider MA, Christopoulos P, Muley T. et al. AURKA, DLGAP5, TPX2, KIF11 and CKAP5: five specific mitosis-associated genes correlate with poor prognosis for non-small cell lung cancer patients. Int J Oncol. 2017;50:365-372
35. Shang J, Song Q, Yang Z. et al. Identification of lung adenocarcinoma specific dysregulated genes with diagnostic and prognostic value across 27 TCGA cancer types. Oncotarget. 2017;8:87292-87306
36. Li L, Yang G, Ren C. et al. Glioma pathogenesis-related protein 1 induces prostate cancer cell death through Hsc70-mediated suppression of AURKA and TPX2. Mol Oncol. 2013;7:484-96
37. Choi JW, Kim Y, Lee JH. et al. High expression of spindle assembly checkpoint proteins CDC20 and MAD2 is associated with poor prognosis in urothelial bladder cancer. Virchows Arch. 2013;463:681-7
38. Pan HW, Su HH, Hsu CW. et al. Targeted TPX2 increases chromosome missegregation and suppresses tumor cell growth in human prostate cancer. Onco Targets Ther. 2017;10:3531-3543
39. Okugawa Y, Grady WM, Goel A. Epigenetic alterations in colorectal cancer: emerging biomarkers. Gastroenterology. 2015;149:1204-1225
40. Shariat SF, Lotan Y, Vickers A. et al. Statistical consideration for clinical biomarker research in bladder cancer. Urol Oncol. 2010;28:389-400
41. Lohr M, Kollmann C, Freis E. et al. Optimal strategies for sequential validation of significant features from high-dimensional genomic data. J Toxicol Environ Health A. 2012;75:447-60
Author contact
![]() Corresponding author: Yi-Qing Qu, Department of Respiratory Medicine, Qilu Hospital of Shandong University, Wenhuaxi Road 107#, Jinan 250012, China. E-mail: quyiqingedu.cn; Tel: +86 531 8216 9335
Corresponding author: Yi-Qing Qu, Department of Respiratory Medicine, Qilu Hospital of Shandong University, Wenhuaxi Road 107#, Jinan 250012, China. E-mail: quyiqingedu.cn; Tel: +86 531 8216 9335