Impact Factor ISSN: 1449-1907

 Global reach, higher impact
Int J Med Sci 2018; 15(11):1129-1142. doi:10.7150/ijms.27056 This issue Cite
Research Paper
Systematic Analysis of Differential Expression Profile in Rheumatoid Arthritis Chondrocytes Using Next-Generation Sequencing and Bioinformatics Approaches
Yi-Jen Chen1,2, Wei-An Chang1,3, Ling-Yu Wu1, Ya-Ling Hsu4, Chia-Hsin Chen2,5,6, ![]() , Po-Lin Kuo1,7,
, Po-Lin Kuo1,7, ![]()
1. Graduate Institute of Clinical Medicine, College of Medicine, Kaohsiung Medical University, Kaohsiung 807, Taiwan
2. Department of Physical Medicine and Rehabilitation, Kaohsiung Medical University Hospital, Kaohsiung 807, Taiwan
3. Division of Pulmonary and Critical Care Medicine, Kaohsiung Medical University Hospital, Kaohsiung 807, Taiwan
4. Graduate Institute of Medicine, College of Medicine, Kaohsiung Medical University, Kaohsiung 807, Taiwan
5. Department of Physical Medicine and Rehabilitation, School of Medicine, College of Medicine, Kaohsiung Medical University, Kaohsiung 807, Taiwan
6. Orthopaedic Research Center, Kaohsiung Medical University, Kaohsiung 807, Taiwan
7. Center for Infectious Disease and Cancer Research, Kaohsiung Medical University, Kaohsiung 807, Taiwan
Received 2018-5-4; Accepted 2018-6-8; Published 2018-7-13
Abstract
Cartilage destruction in rheumatoid arthritis (RA) occurs primarily in the pannus-cartilage interface. The close contact of the synovium-cartilage interface implicates crosstalk between synovial fibroblasts and chondrocytes. The aim of this study is to explore the differentially expressed genes and novel microRNA regulations potentially implicated in the dysregulated cartilage homeostasis in joint destruction of RA. Total RNAs were extracted from human primary cultured normal and RA chondrocytes for RNA and small RNA expression profiling using next-generation sequencing. Using systematic bioinformatics analyses, we identified 463 differentially expressed genes in RA chondrocytes were enriched in biological functions related to altered cell cycle process, inflammatory response and hypoxic stimulation. Moreover, fibroblast growth factor 9 (FGF9), kynureninase (KYNU), and regulator of cell cycle (RGCC) were among the top dysregulated genes identified to be potentially affected in the RA joint microenvironment, having similar expression patterns observed in arrays of clinical RA synovial tissues from the Gene Expression Omnibus database. Additionally, among the 31 differentially expressed microRNAs and 10 candidate genes with potential microRNA-mRNA interactions in RA chondrocytes, the novel miR-140-3p-FGF9 interaction was validated in different microRNA prediction databases, and proposed to participate in the pathogenesis of joint destruction through dysregulated cell growth in RA. The findings provide new perspectives for target genes in the management of cartilage destruction in RA.
Keywords: rheumatoid arthritis, chondrocytes, cell cycle, next-generation sequencing, bioinformatics.
Introduction
Rheumatoid arthritis (RA) is a chronic systemic inflammatory disease primarily affecting the articular joints, with articular and periarticular manifestations of painful swollen joint and limited joint range of motion that will ultimately affect mobility [1]. In normal articular joint, the thin synovial lining contains synovial fibroblasts and macrophages, and provides nutrient to cartilage. In RA, thickening of the synovial lining with increased infiltrates of inflammatory cells are hallmarks of the inflamed joint, and synovial fibroblasts are suggested to regulate inflammation and mediate cartilage and bone destruction [2]. Studies have demonstrated that activated RA synovial fibroblasts transform into tumor-like behavior with invasive behavior mediated by up-regulation of adhesion molecules, and show defective apoptosis leading to synovial hyperplasia [3].
The activation of highly metabolic synovial fibroblasts and local hypoxic microenvironment have been proposed to facilitate angiogenesis and inflammation, leading to joint destruction [4]. The migratory and invasive behavior of synovial fibroblasts stimulated by inflammatory cytokines, together with pro-angiogenic factors that trigger macrophages and T cells, form the pannus tissue at interface of synovium, bone and cartilage [2,3,5]. Cartilage destruction primarily occurs in the pannus-cartilage interface, where proliferating synovial fibroblasts penetrate the extracellular matrix (ECM) of the cartilage, and release proteinases like matrix metalloproteinases (MMPs) that degrade cartilage matrix [6,7]. In vitro studies have shown the imbalanced expressions of catabolic and anabolic related genes in RA synovial fibroblast supernatant stimulated chondrocytes [8], and animal model also indicates early loss of ECM in cartilage facilitates the attachment of inflamed synovial tissue to cartilage interface [9], suggesting the autocrine and paracrine effects of chondrocytes to increased tissue catabolism and suppressed repair process [7]. This may contribute to the facilitated loss of cartilage ECM in RA joint.
Apoptosis of chondrocytes occur in RA cartilage through activated p53 and c-myc, and decreased expression of Bcl-2, and the degree of chondrocyte apoptosis is related to cartilage destruction [10,11]. In the RA joint microenvironment, activated immune cells produce immunoglobulins, and form immune complexes that is in high abundance in the RA synovial fluid, and deposit at the surface of cartilage that mediate chondrocyte apoptosis and accelerate cartilage breakdown [12]. As different types of tissues within the articular joint are affected by altered joint microenvironment in RA, such as increased levels of tumor necrosis factor (TNF)-α and interleukin (IL)-6, and immune complexes, a thorough understanding of the interaction and influence between cells of articular linings is important. The close contact of the synovium-cartilage interface within the inflamed RA joint gives rise to interest in understanding the crosstalk between synovial fibroblasts and chondrocytes [13,14].
While the important contribution of genetic factors to a disease is well accepted, the role of epigenetic regulations in the susceptibility of a disease is receiving much attention in the past decade [15]. MicroRNA (miRNA) regulation is among one of the epigenetic regulatory circuits in response to environmental stimuli. MiRNAs are single-strand non-coding RNAs of 20-22 nucleotides, and act predominantly as negative regulators to repress the expression of target genes post-transcriptionally [15,16]. Investigations on the role of miRNA regulation in rheumatic and autoimmune diseases have evolved since the initial findings of linkage between cytoplasmic structure for mRNA processing and miRNA complex in patients with RA [17]. Research on the discovery of miRNAs as biomarkers of disease activity and therapeutic targets in RA is ongoing [16,18,19]. Recent advance in the technique of whole genome sequencing using next-generation sequencing (NGS) method provides unbiased detection of both coding and non-coding transcripts [20]. The advanced technology of sequencing combined with the use of bioinformatics tools enables broader investigation and deeper understanding of the pathogenesis and disease variants in RA [20,21]. The interactions between synovial fibroblasts and chondrocytes and the proposed autocrine and paracrine effects of chondrocytes in RA cartilage destruction suggest the important role of chondrocytes in the pathogenesis of RA. While investigations of miRNAs in RA mostly focus on synovial fibroblasts and peripheral blood mononuclear cells (PBMCs) [22], the role of miRNA regulation in cartilage destruction of RA is less discussed. In the current study, we aim to explore the differentially expressed genes and novel miRNA regulations potentially implicated in the dysregulated cartilage homeostasis in joint destruction of RA.
Materials and Methods
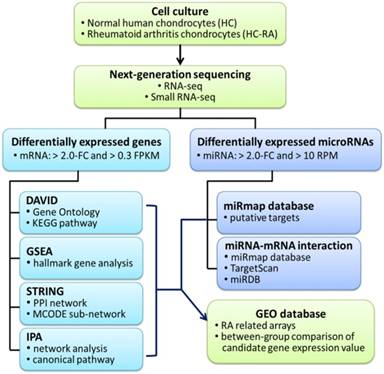
The current study aimed to identify differential expression profile in human RA chondrocytes through NGS and bioinformatics approaches. The flowchart of our study design is shown in Figure 1.
Flowchart of study design. The primary human chondrocytes of normal (HC) and rheumatoid arthritis (HC-RA) knee cartilages were cultured and harvasted for RNA sequencing and expression profiling. Differentially expressed genes with > 2.0 fold change and > 0.3 fragments per kilobase of transcript million (FPKM) were selected for further enrichment analyses using different bioinforatmics resources. In addition, differentially expressed microRNAs with > 2.0 fold change and > 10 reads per million (RPM) were selected for further putative targets using miRmap target prediction database. The identified potential miRNA-mRNA interactions were systematically validated in different miRNA target prediction databases. Finally, rheumatoid arthritis (RA) related arrays from clinical RA joint tissue specimen were searched in the Gene Expression Omnibus (GEO) database, and the expression patterns of candidate genes of interest in these arrays were analyzed.
Cell culture of primary human chondrocytes
Primary human chondrocytes isolated from normal (HC) and RA (HC-RA) knee cartilages were obtained from Cell Applications, Inc. (San Diego, CA, USA). The purchased primary human chondrocytes were cryopreserved at the first passage. Chondrocytes of first passage were grown in Chondrocyte Growth Medium (Cell Applications, Inc. San Diego, CA, USA) and kept in 5% CO2 humidified incubator at 37°C until confluence. After grown to confluence, the HC and HC-RA cells were harvested for total RNA extraction and expression profiling.
RNA sequencing and expression profiling
Total RNAs of HC and HC-RA cells were extracted using Trizol® Reagent (Invitrogen, Carlsbad, CA, USA), following the manufacturer's instructions. The quality of extracted RNAs were confirmed by OD260/OD280 absorbance ratio detection (1.95 for HC and 1.96 for HC-RA) and RNA integrity number (RIN, 9.8 for HC and 8.7 for HC-RA), using the ND-1000 spectrophotometer (Nanodrop Technology, Wilmington, DE, USA) and Agilent Bioanalyzer (Agilent Technology, Santa Clara, CA, USA), respectively. After RNA extraction, the RNA and small RNA sequencing were carried out by Welgene Biotechnology Company (Welgene, Taipei, Taiwan). In brief, the deep sequencing was performed using the Solexa platform, with read length of 75 nucleotides single-end sequencing, which was sufficient for differential expression analysis [23]. The sequencing was expected to generate 30 million reads for each sample, which was reported to yield a relatively stable detection of protein-coding genes [24]. The raw sequences were trimmed for qualified reads, followed by the analysis of gene expression estimation using TopHat/Cufflinks. The differentially expressed mRNAs and miRNAs of HC and HC-RA cells were set at fold change > 2.0, fragments per kilobase of transcript per million (FPKM) > 0.3 for mRNA, and reads per million (RPM) > 10 for miRNA. The threshold of > 0.3 FPKM for RNA-seq was determined since this yielded a balance in numbers of false positive and false negative detection, and higher confidence in measured expression level [25,26]. The threshold of > 10 RPM for small RNA-seq was determined to identify functional miRNAs [27].
Database for Annotation, Visualization and Integrated Discovery (DAVID) Bioinformatics Resources
The updated DAVID Bioinformatics Resources is a public resource that integrates numerous major public bioinformatics resources, and offers researchers various powerful tools for analysis of large gene lists derived from genomic studies. For a gene list uploaded, researchers can obtain not only gene-term enrichment analysis, but also to search for related genes or terms of interest and research relevance, and gain an overall concept of the biological functions associated with the gene list of interest [28].
Gene Set Enrichment Analysis (GSEA)
The Gene Set Enrichment Analysis (GSEA) tool provides an analytical method to interpret large gene expression data by focusing on biologically defined gene sets, groups of genes sharing common biological function, regulation or chromosomal location, instead of merely focusing on single genes. In addition to gene set analysis, the GSEA analytical method also provides leading-edge subset analysis which further extracts the core genes that represent biological importance within the gene set [29].
Search Tool for the Retrieval of Interacting Genes (STRING)
The STRING database (version 10.5) covers more than 2000 organisms, 9.6 million of proteins and 1380 million of interactions that provides analysis and integration of direct and indirect protein-protein interactions (PPI), and focuses on functional association. The differentially expressed genes identified were uploaded, and interactions with at least medium confidence (interaction score > 0.4) were selected [30]. The achieved large PPI network was further analyzed for primary clusters of sub-networks using Cytoscape software package (version 3.6.1) [31] with Molecular Complex Detection (MCODE) plugin for primary clusters of PPI network. The MCODE identified densely connected regions and clusters of genes in large PPI networks that are crucial [32,33].
Ingenuity Pathway Analysis (IPA)
The IPA software (Ingenuity Systems Inc., Redwood City, CA, USA) provides “Core Analysis” for a set of genes and/or proteins of interest, based on curated literature searches reviewed and updated by experts. The network analysis and canonical pathways are among the two powerful tools obtained from Core Analysis results, and the network graphics can be generated in the software, with further overlay analysis on a specific network selected by users [34]. Additionally, the IPA software provides implemented causal analytics tools, including “Causal Network Analysis”, “Mechanistic Networks”, “Upstream Regulator Analysis” and “Downstream Effector Analysis” that enable users to generate mechanistic hypotheses according to the directional information observed within the gene expression datasets [35].
Gene Expression Omnibus (GEO)
The GEO database is a public repository that collects and provides free access to high-throughput genomics datasets. The GEO also offers Web-based tools and graphic gene expression for quick data interpretation, and the raw expression data of the candidate genes within a dataset can be downloaded for further analysis [36,37]. In this study, the three arrays of synovial tissues from RA patients were used for analysis (GSE55235, GSE55457 and GSE77298).
MiRmap Database
The miRmap software library ranks potential targets of a specific miRNA by miRmap score, which indicates the repression strength of a miRNA target. The higher miRmap score suggests higher repression strength. The repression strength was estimated through a comprehensive computational approach, including thermodynamic, evolutionary, probabilistic and sequence-based features [38]. The miRmap web interface offers miRNA target prediction for different organisms, and for multiple queries, users can sort, filter and export the results easily [39]. In this study, the 31 differentially expressed miRNAs were sequentially inputted to obtain abundant miRNA targets, and targets with miRmap scores higher than 99.0 were selected for further analysis.
Statistical Analysis
The expression values of specific genes were obtained from selected arrays of GEO database, and the between-group differences in the expression values of specific genes were analyzed using non-parametric analysis with Mann-Whitney U test. The IBM SPSS Statistics for Windows, version 19 (IBM Corp., Armonk, NY, USA) was used for statistical analysis. A p-value < 0.05 was determined as statistically significant between-group difference.
Results
Identification of differentially expressed genes among normal and rheumatoid arthritis (RA) chondrocytes
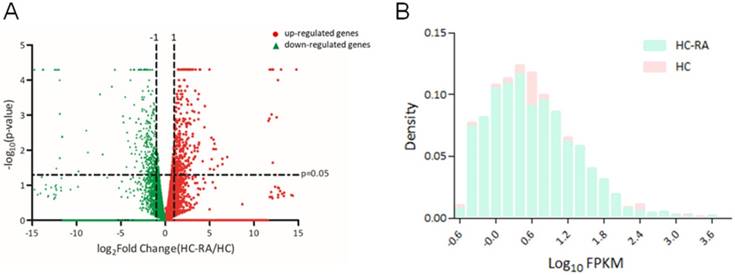
The expression profiling of normal and RA chondrocytes was obtained from RNA sequencing using NGS approach. The differentially expressed genes in HC and HC-RA were displayed as volcano plot in Figure 2A. Screening for differentially expressed protein-coding genes was performed with a threshold setting of > 0.3 fragments per kilobase of transcript per million (FPKM) and > 2.0-fold-change between HC and HC-RA. The density plot of deep sequencing results of HC and HC-RA after screening was shown in Figure 2B to compare the difference in FPKM performance between the two samples. After screening, there were total 463 significant differentially expressed genes identified, with 249 genes up-regulated and 214 genes down-regulated in RA chondrocytes.
Display of differential expression patterns of normal and rheumatoid arthritis (RA) chondrocytes from deep sequencing. (A) The RNA sequencing result of differential gene expression in normal (HC) and RA chondrocytes (HC-RA) were plotted by volcano plot. The x-axis indicated the logarithm to the base 2 of expression fold-change (HC-RA/HC) and the y-axis indicated the negative logarithm to the base 10 of the p-values. Red circular marks represented up-regulated genes in HC-RA, and green triangular marks represented down-regulated genes in HC-RA. Vertical lines reflected the filtering thresholds of 2.0-fold-change, and horizontal line reflected filtering threshold of p-value = 0.05. A total of 249 significantly up-regulated and 214 significantly down-regulated genes in HC-RA were identified. (B) The comparison of the difference in fragments per kilobase of transcript per million (FPKM) performance between HC and HC-RA after screening (threshold setting: > 0.3 FPKM and > 2.0-fold-change) were displayed as density plot. The x-axis indicated the logarithm to the base 10 of FPKM, and the y-axis indicated read density.
Enrichment analysis of significant differentially expressed genes revealed involvement in hypoxia and cell cycle gene sets
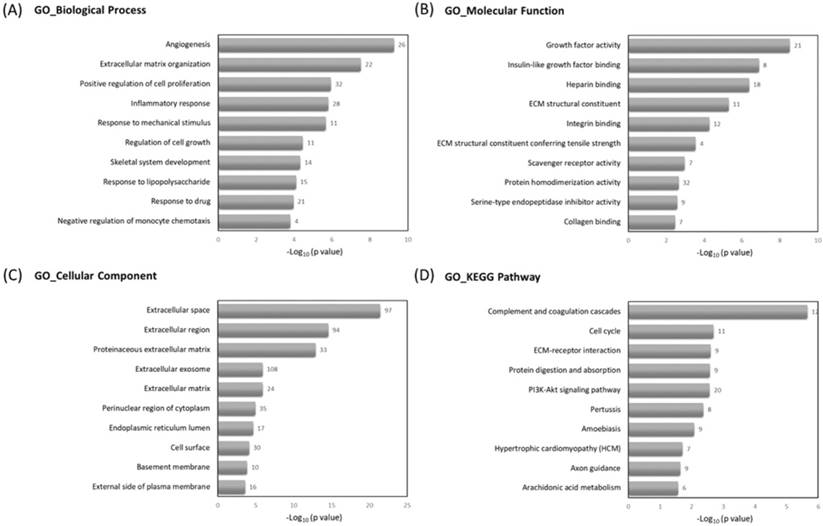
To understand the related biological functions of the 463 differentially expressed genes in RA chondrocytes, these genes were firstly input into the Database for Annotation, Visualization and Integrated Discovery (DAVID) database for enrichment analysis, using the Gene Ontology (GO) and Kyoto Encyclopedia of Genes and Genomes (KEGG) pathway. The top 10 enriched terms of GO and KEGG pathway were shown in Figure 3. Angiogenesis, ECM organization and positive regulation of cell proliferation were among the top enriched biological processes, these genes were enriched in molecular functions like growth factor activity and ECM structural constituent, and potentially located in the extracellular level. The mostly enriched KEGG pathways included complement and coagulation cascades, cell cycle and ECM receptor interaction.
The Gene Ontology (GO) and Kyoto Encyclopedia of Genes and Genomes (KEGG) pathway enrichment analysis of differentially expressed genes in DAVID database. The 463 differentially expressed genes in RA chondrocytes were uploaded into DAVID database for enrichment analysis. The top 10 GO and KEGG pathway analysis results of these dysregulated genes in RA chondrocytes were displayed in bar chart. The bars indicated the -Log10(p value) of each GO and KEGG term, and the numbers shown at the right side of each bar indicated the number of genes involved in each term.
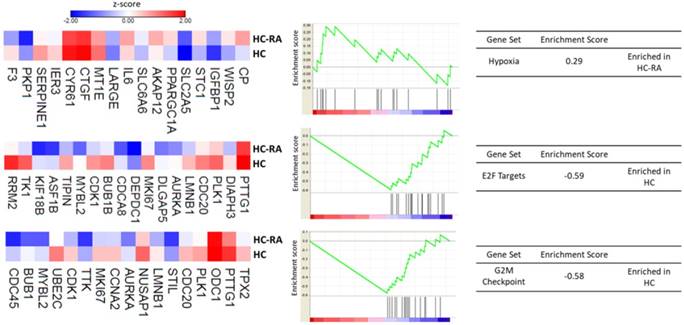
Further enrichment analysis using Gene Set Enrichment Analysis (GSEA) for hallmark gene database identified hypoxia related gene set was enriched in RA chondrocytes, while gene sets related to cell cycle function, including G2/M checkpoint and cell cycle related targets of E2F transcription factors were significantly enriched in normal chondrocytes. The heat maps of the potentially involved genes in our normal and RA chondrocyte datasets were shown in Figure 4. Combining the two database enrichment analysis results, we therefore generated the hypothesis that normal and RA chondrocytes possess differential gene expression profiles related to altered joint microenvironment such as angiogenesis and hypoxia, and dysregulated cell cycle process of chondrocytes in arthritic condition.
The Gene Set Enrichment Analysis (GSEA) result of differentially expressed genes. The 463 differentially expressed genes in RA chondrocytes were uploaded into GSEA for enrichment analysis. The h.all.v5.1.symbols.gmt [Hallmarks] gene sets database was used as the gene set collection for analysis. GSEA performed 1000 permutations. The maximum and minimum sizes for gene sets were 500 and 15, respectively. Cutoff for significant gene sets was false discovery rate < 25%.
Clusters of gene networks were involved in cell division, chemokine signaling and collagen change
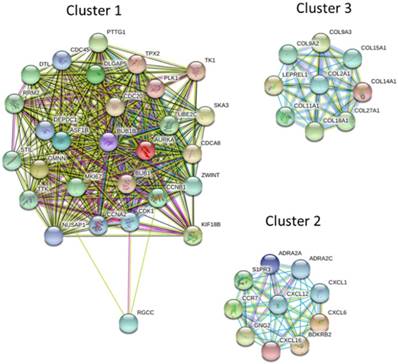
The protein-protein interaction (PPI) network analysis through Search Tool for the Retrieval of Interacting Genes (STRING) database identified a total of 460 nodes and 1180 edges, with PPI enrichment p-value < 1.0 x 10⁻¹⁶. Further sub-network analysis of all indicated nodes and edges by plug-in Molecular Complex Detection (MCODE) in Cytoscape was then performed, and the top 10 ranked clusters of networks were listed in Table 1, indicating the score and number of nodes and edges in each cluster. The top 3 clusters of PPI sub-networks were drawn in Figure 5. The genes in the top 3 clusters were input into DAVID database for GO and KEGG pathway enrichment analysis, and the results were shown in Table 2. Cluster 1 sub-network was related to cell cycle and cell division, cluster 2 sub-network linking to chemotaxis, inflammatory response and chemokine signaling, and cluster 3 involved in ECM organization and protein digestion related pathways.
Ranked clusters of networks analyzed by MCODE
| Cluster | Score (Density*#Nodes) | Nodes | Edges | Node IDs |
|---|---|---|---|---|
| 1 | 24.846 | 27 | 323 | CDK1, CDC45, NUSAP1, BUB1B, BUB1, DEPDC1, CDCA8, DTL, DLGAP5, SKA3, ZWINT, TTK, PTTG1, KIF18B, AURKA, TPX2, STIL, ASF1B, CCNA2, PLK1, CCNB1, CDC20, UBE2C, RRM2, GMNN, TK1, MKI67 |
| 2 | 10 | 10 | 45 | S1PR3, CCR7, ADRA2C, CXCL6, CXCL12, CXCL16, GNG2, BDKRB2, CXCL1, ADRA2A |
| 3 | 9 | 9 | 36 | COL27A1, COL14A1, LEPREL1, COL9A3, COL15A1, COL9A2, COL2A1, COL18A1, COL11A1 |
| 4 | 6 | 21 | 60 | IL7R, IL6, PTGS2, BDNF, PTGIR, RAMP1, ADRB2, PTGER4, PTHLH, GFAP, MMP2, CTGF, SRGN, CSF1, CFD, APOE, PPARG, SERPINA3, A2M, CD40, SERPING1 |
| 5 | 3.5 | 5 | 7 | HBEGF, UCP2, IGF1, PPARGC1A, ANGPT1 |
| 6 | 3.333 | 4 | 5 | SEMA3A, SLIT3, EFNB2, SLIT2 |
| 7 | 3 | 3 | 3 | TUBB2A, TUBA1B, TUBB4B |
| 8 | 3 | 3 | 3 | SNX9, STON2, CD4 |
| 9 | 3 | 3 | 3 | CECR1, TYMP, PNP |
| 10 | 2.75 | 9 | 11 | FGF10, FGF9, F3, ITGA6, PLAU, ITGA3, ITGB8, EPHA2, TLR4 |
Enrichment analysis of top 3 clusters of sub-network analyzed from MCODE
| Sub-network | Count | P value | Fold Enrichment | |
|---|---|---|---|---|
| Biological process | ||||
| Cluster 1 | Cell division | 14 | 8.98x10⁻¹⁶ | 24.88 |
| Anaphase-promoting complex-dependent catabolic process | 8 | 2.38x10⁻¹¹ | 62.98 | |
| Mitotic nuclear division | 10 | 7.26x10⁻¹¹ | 25.08 | |
| Cluster 2 | G-protein coupled receptor signaling pathway | 9 | 5.62x10⁻¹⁰ | 16.81 |
| Chemotaxis | 5 | 3.25x10⁻⁷ | 68.82 | |
| Inflammatory response | 6 | 6.67x10⁻⁷ | 26.58 | |
| Cluster 3 | Extracellular matrix organization | 7 | 1.62x10⁻¹¹ | 74.96 |
| Collagen catabolic process | 4 | 1.83x10⁻⁶ | 131.19 | |
| Collagen fibril organization | 3 | 1.10x10⁻⁴ | 161.46 | |
| KEGG pathway | ||||
| Cluster 1 | Cell cycle | 10 | 9.70x10⁻¹⁴ | 39.80 |
| Oocyte meiosis | 6 | 1.04x10⁻⁶ | 27.17 | |
| Progesterone-mediated oocyte maturation | 5 | 1.54x10⁻⁵ | 28.37 | |
| Cluster 2 | Chemokine signaling pathway | 6 | 1.5 x10⁻⁶ | 22.29 |
| Neuroactive ligand-receptor interaction | 4 | 0.004 | 9.98 | |
| cGMP-PKG signaling pathway | 3 | 0.018 | 12.49 | |
| Cluster 3 | Protein digestion and absorption | 8 | 4.27x10⁻¹⁴ | 78.52 |
| ECM-receptor interaction | 3 | 0.003 | 29.78 | |
| Amoebiasis | 3 | 0.005 | 24.45 |
The protein-protein interaction (PPI) network analysis of differentially expressed genes using STRING database. The 463 differentially expressed genes were input into STRING database for PPI network analysis, and achieved a PPI network of 460 nodes and 1180 edges, with PPI enrichment p-value < 1.0 x 10⁻¹⁶. The three primary clusters of subnetworks were analyzed by plug-in MCODE in Cytoscape, and the nodes in each cluster were input into STRING database to obtain the PPI subnetworks.
The top dysregulated genes in RA chondrocytes with consistent expression pattern in RA synovial tissue arrays were associated with cell cycle progression
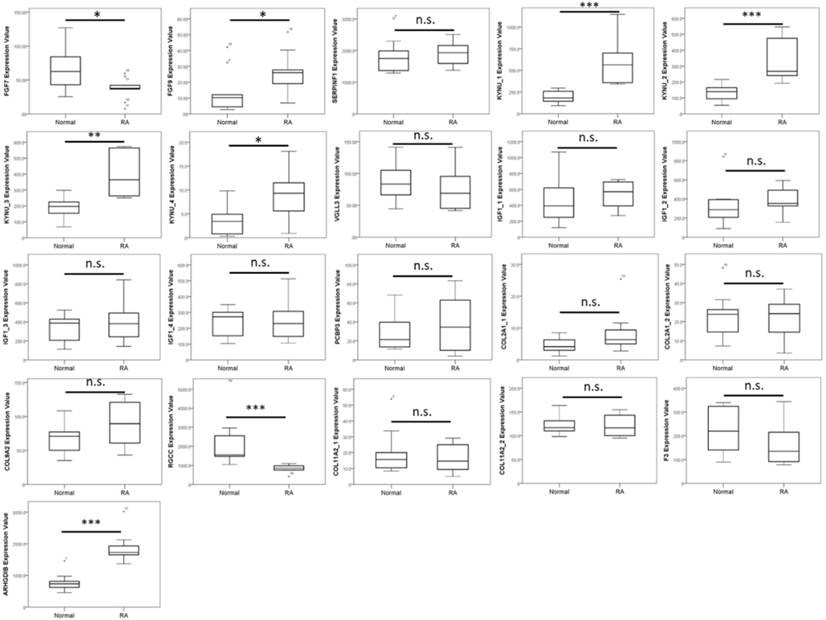
The IPA identified top upstream regulators for the 463 dysregulated genes included transforming growth factor beta 1 (TGFB1), tumor necrosis factor (TNF), triggering receptor expressed on myeloid cells 1 (TREM1), forkhead box protein O1 (FOXO1) and amphiregulin (AREG). Additionally, the top 10 up-regulated and down-regulated genes in RA chondrocytes were identified, as listed in Table 3. Investigations on RA cartilages and chondrocytes largely derived from in vitro and in vivo results, and direct analysis from clinical specimen of patients with RA are limited. To determine the expression patterns of these genes in the RA joint microenvironment and correlate to clinical specimen of RA patients, we searched for related arrays in the Gene Expression Omnibus (GEO) database. The arrays comparing normal and RA chondrocytes were not available in the database. Since the altered joint microenvironment in RA may affect not merely the cartilage but also other tissues of the joint structure [14], we also searched for arrays of RA synovium and subchondral bone. The three representative arrays comparing synovial tissues of normal and RA patients were selected (GSE55235, GSE55457 and GSE77298), and the expression patterns of the top 20 dysregulated genes in our RA chondrocytes dataset were sequentially analyzed in these 3 arrays to identify genes consistently dysregulated in the RA microenvironment. As shown in Table 4, the up-regulated fibroblast growth factor 9 (FGF9) and kynureninase (KYNU), and down-regulated regulator of cell cycle (RGCC) in our RA chondrocytes were also found to be expressed in the similar pattern in at least 2 of the 3 RA synovial tissue arrays. The expression values of each gene in one of the representative array datasets (GSE55235) were shown in Figure 6.
Top 10 up-regulated and down-regulated genes in rheumatoid arthritis chondrocytes
| Gene symbol | Gene name | HC-RA FPKM | HC FPKM | Fold-change (HC-RA/HC) |
|---|---|---|---|---|
| FGF10 | fibroblast growth factor 10 | 13.39 | 0.43 | 31.28 |
| PODN | podocan | 65.90 | 4.55 | 14.48 |
| FGF7 | fibroblast growth factor 7 | 117.32 | 8.52 | 13.77 |
| FGF9 | fibroblast growth factor 9 | 11.42 | 0.84 | 13.67 |
| ADGRD1 | adhesion G protein-coupled receptor D1 | 12.11 | 0.95 | 12.73 |
| SERPINF1 | serpin peptidase inhibitor, clade F, member 1 | 210.56 | 19.80 | 10.63 |
| KYNU | kynureninase | 26.72 | 2.53 | 10.57 |
| VGLL3 | vestigial like family member 3 | 56.74 | 5.46 | 10.39 |
| IGF1 | insulin like growth factor 1 | 5.18 | 0.51 | 10.17 |
| PCBP3 | poly(rC) binding protein 3 | 3.51 | 0.37 | 9.57 |
| SUSD3 | sushi domain containing 3 | 0.42 | 2.72 | 0.15 |
| ARHGDIB | Rho GDP dissociation inhibitor beta | 0.48 | 3.21 | 0.15 |
| ITIH6 | inter-alpha-trypsin inhibitor heavy chain family member 6 | 0.54 | 3.72 | 0.15 |
| F3 | coagulation factor III | 5.53 | 41.27 | 0.13 |
| COL11A2 | collagen, type XI, alpha 2 | 2.77 | 22.52 | 0.12 |
| RGCC | regulator of cell cycle | 0.37 | 3.41 | 0.11 |
| COL9A2 | collagen, type IX, alpha 2 | 0.81 | 9.16 | 0.09 |
| FAT3 | FAT atypical cadherin 3 | 0.34 | 3.91 | 0.09 |
| CCDC85A | coiled-coil domain containing 85A | 0.63 | 7.49 | 0.08 |
| COL2A1 | collagen, type II, alpha 1 | 15.05 | 225.63 | 0.07 |
Analysis of top dys-regulated genes in RA synovial tissue arrays from GEO datasets
| GEO Accession # | GSE55235 | GSE55457 | GSE77298 | ||
|---|---|---|---|---|---|
| No. of specimen | Normal / RA | Normal / RA | Normal / RA | ||
| 10 / 10 | 10 / 13 | 7 / 16 | |||
| Up-regulated mRNA | |||||
| FGF10 | -- | -- | n.s. | ||
| PODN | -- | -- | n.s. | ||
| FGF7 | DOWN | n.s. | n.s. | ||
| FGF9 | UP | UP | n.s. | ||
| ADGRD1 | -- | -- | n.s. | ||
| SERPINF1 | n.s. | n.s. | n.s. | ||
| KYNU | UP | UP | UP | ||
| VGLL3 | n.s. | n.s. | n.s. | ||
| IGF1 | n.s. | n.s. | n.s. | ||
| PCBP3 | n.s. | n.s. | n.s. | ||
| Down-regulated mRNA | |||||
| SUSD3 | -- | -- | n.s. (UP)† | ||
| ARHGDIB | UP | UP | n.s. | ||
| ITIH6 | -- | -- | n.s. | ||
| F3 | n.s. | n.s. | n.s. | ||
| COL11A2 | n.s. | n.s. | n.s. | ||
| RGCC | DOWN | DOWN | n.s. | ||
| COL9A2 | n.s. | n.s. | n.s. | ||
| FAT3 | -- | -- | n.s. (DOWN)† | ||
| CCDC85A | -- | -- | n.s. (DOWN)† | ||
| COL2A1 | n.s. | n.s. | n.s. |
UP, up-regulated in RA (if more than one probe, at least 2 probes significant); DOWN, down-regulated in RA; n.s., non-significant between normal and RA.
† indicated only one of the probes was significant
-- indicated no identical probe for the gene in the array
Expression patterns of top 10 up-regulated and 10 down-regulated genes identified from RA chondrocytes in a representative RA synovial tissue array in the Gene Expression Omnibus (GEO) database. The expression values of the top 20 dysregulated genes in RA chondrocytes were analyzed in a representative array of clinical specimen of normal and RA synovial tissues from the GEO database (GSE55235). Significant up-regulation of FGF9 and KYNU, and down-regulation of RGCC were observed to have similar expression pattern in the RA synovial tissues, compared to the normal synovium. * indicated p < 0.05, ** indicated p < 0.01, *** indicated p < 0.001, and n.s. indicated no statistical significance. (Probe ID reference: FGF7, 205782_at; FGF9, 206404_at; SERPINF1, 202283_at; KYNU_1, 217388_s_at; KYNU_2, 210663_s_at; KYNU_3, 204385_at; KYNU_4, 210662_at; VGLL3, 220327_at; IGF1_1, 209541_at; IGF1_2, 209540_at; IGF1_3, 209542_x_at; IGF1_4, 211577_s_at; PCBP3, 205663_at; COL2A1_1, 217404_s_at; COL2A1_2, 213492_at; COL9A2, 213622_at; RGCC, 218723_s_at; COL11A2_1, 213870_at; COL11A2_2, 216993_s_at; F3, 204363_at and ARHGDIB, 201288_at). Some genes did not have identical probes in the array data.
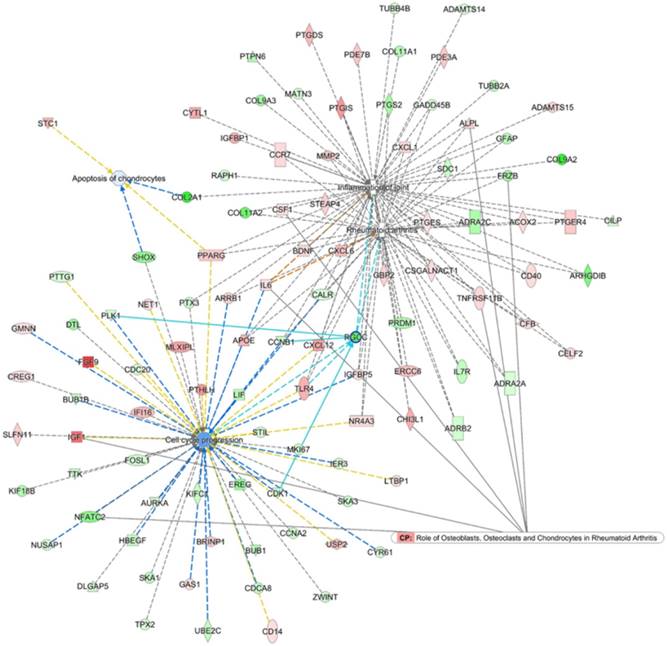
To search for the potential interactions between cell cycle process related genes and altered joint microenvironment in RA, we first selected genes related to “Rheumatoid arthritis”, “Inflammation of joint”, “Apoptosis of chondrocytes” and “Cell cycle progression” that were categorized in the Ingenuity Pathway Analysis (IPA) software, and the four networks of genes were merged to form a gene network shown in Figure 7. Among the merged network, the previously identified down-regulated RGCC in RA chondrocytes was also found to participate simultaneously in the network of RA, inflammation of joint and cell cycle process, with connection to Cyclin B1 (CCNB1), Toll-like receptor 4 (TLR4), cyclin-dependent kinase 1 (CDK1) and polo-like kinase 1 (PLK1), as shown in light blue lines in Figure 7. Additionally, the PPI network also indicated the involvement of RGCC in cluster 1 network enriched in cell cycle and cell division, with predicted interaction between RGCC and transcriptional regulation of CDK1, Geminin (GMNN) and CCNB1 (Figure 5).
Merged network analysis from Ingenuity Pathway Analysis (IPA) software for associations among molecules related to rheumatoid arthritis, inflammation of joint, cell cycle and apoptosis. The merged network of “Rheumatoid arthritis”, “Inflammation of joint”, “Apoptosis of chondrocytes” and “Cell cycle progression” categorized in the IPA software was obtained from IPA software. The overlay canonical pathway of “Role of osteoblasts, osteoclasts and chondrocytes in rheumatoid arthritis” identified 7 molecules interconnected to networks of RA and cell cycle progress. Among the merged network, the down-regulated RGCC in RA chondrocytes participated simultaneously in the network of RA, inflammation of joint and cell cycle progression, with additional connection to Cyclin B1 (CCNB1), Toll-like receptor 4 (TLR4), cyclin-dependent kinase 1 (CDK1) and polo-like kinase 1 (PLK1), as shown in light blue lines.
Identification of potential miR-140-3p-FGF9 interaction in RA chondrocytes
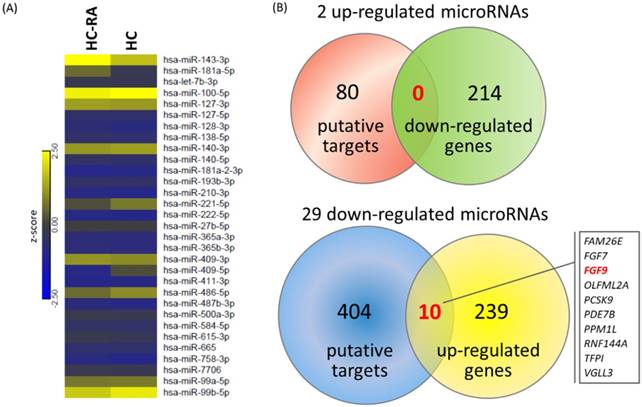
To explore the potential miRNA-mRNA interactions in RA chondrocytes, we also performed small RNA sequencing by NGS to determine the differential expression profile of miRNAs between normal and RA chondrocytes. A total of 31 differentially expressed miRNAs were identified in RA chondrocytes, 2 up-regulated and 29 down-regulated (selection criteria of > 2.0-fold change and > 10 RPM). The heat map with z-score values of these 31 miRNAs was illustrated in Figure 8A. Using the miRmap database to predict putative targets of these differentially expressed miRNAs, we obtained 80 putative targets for 2 up-regulated miRNAs and 404 putative targets for 29 down-regulated miRNAs, selecting those targets with miRmap score > 99.0. These putative targets were then matched to our 214 down-regulated genes and 249 up-regulated genes identified from the NGS sequencing results, and the matched result was illustrated in Venn diagram in Figure 8B, showing 10 matched up-regulated genes with potential miRNA regulations in RA chondrocytes.
Differentially expressed microRNAs with potential microRNA-mRNA interactions identified in primary RA chondrocytes. (A) A total of 31 differentially expressed microRNAs (selection criteria of > 2.0-fold change and reads per million (RPM) > 10) from next generation sequencing method were identified, and the heat map according to z-score value is illustrated. (B) Using the miRmap database for microRNA target prediction, there were 80 putative targets of 2 up-regulated microRNAs and 404 putative targets of 29 down-regulated microRNAs obtained (selection criteria of miRmap score ≥ 99.0). Matching to the 214 down-regulated genes and 249 up-regulated genes identified in the RA chondrocytes, the Venn diagram analysis identified 10 up-regulated genes with potential microRNA-mRNA interactions.
The 10 up-regulated genes were analyzed in the IPA software for gene network analysis. The results indicated 5 of the 10 genes were grouped into one network associated with cell cycle and connective tissue development and function, including FGF7, FGF9, OLFML2A, PCSK9 and TFPI, with signal transducer and activator of transcription 3 (STAT3) being the connecting hub, as shown in Table 5 and network analysis.
Networks associated with candidate genes differentially expressed in RA chondrocytes
| Top diseases and functions | Score | Molecules in network | |
|---|---|---|---|
| 1 | Cell Cycle, Connective Tissue Development and Function, Tissue Development | 12 | AHR, AR, BAX, CAV1, CCND1, CDKN1B, CTNNB1, EHF, F3, FGF2, ↑FGF7, ↑FGF9, FGFR1, HGF, HPRT1, IL2, IL7, IRF1, LDL, MAPK1, MAPK3, MAPK8, miR-16-5p, MMP2, MMP9, MTOR, ↑OLFML2A, ↑PCSK9, SMARCA4, SREBF1, SREBF2, STAT1, STAT3, ↑TFPI, VCAN |
| 2 | Developmental Disorder, Hereditary Disorder, Neurological Disease | 3 | NONO, ↑PDE7B |
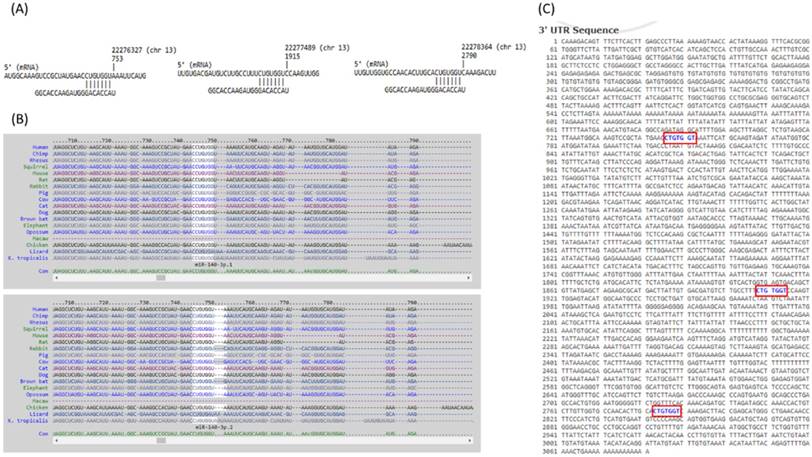
The 10 genes with potential miRNA regulations were then sequentially explored in the previously selected representative RA arrays to determine the expression pattern of these genes in clinical specimen. The analysis result showed similar expression pattern only for FGF9 in two of the three RA synovial tissue arrays. Therefore, FGF9 was input into miRmap database to predict potential miRNA regulation. Setting the selection criterion of miRmap score > 99.0 as high miRNA target repression strength, two potential miRNA-mRNA interactions were identified, including potential miR-603 and miR-140-3p regulations for FGF9, where down-regulated miR-140-3p was one of the 31 differentially expressed miRNAs identified in our RA chondrocytes. The putative 3'UTR binding sites were validated in miRDB and TargetScan, two commonly used databases for miRNA prediction. The consistently predicted putative binding site at position of 746-752 was validated in all three databases, while binding at positions of 1908-1914 and 2783-2789 were validated in miRmap and miRDB databases (Figure 9).
The putative binding site of miR-140-3p on FGF9. The sequence and putative binding sites of miR-140-3p on the 3′UTR of FGF9 at the positions of 746-752, 1908-1914 and 2783-2789 were validated in miRmap (A); TargetScan (B); and miRDB (C).
Discussion
Our current study identified differentially expressed genes in RA chondrocytes were potentially related to altered cell cycle process, inflammatory response and hypoxic stimulation, through systematic analysis with bioinformatics approaches. Additionally, FGF9, KYNU and RGCC were among the top dysregulated genes identified to be potentially affected in the changed joint microenvironment in RA, having similar expression patterns in primary RA chondrocytes and arrays of clinical RA synovial tissues. Among the 10 candidate genes with potential miRNA interactions, the novel miR-140-3p-FGF9 interaction was validated in different miRNA prediction databases, and proposed to participate in the pathogenesis of joint destruction through accelerated ECM degradation in RA.
Synovitis with joint destruction is the characteristics of affected articular joints in RA [1,3]. Pannus formation within the joint gives rise to direct contact of synovial fibroblasts with bone and cartilage tissues, and leads to cartilage destruction and bone erosion [2,5]. Tissue hypoxia, particularly takes place in synovium at the pre-arthritic stage [40], is a relevant feature in RA, and induces inflammation, angiogenesis and cartilage damage, affecting the entire joint structure. The proposed theories of synovial hypoxia underlie increased metabolic demand in enhanced cell proliferation with reduced tissue oxygenation and higher intra-articular pressure related to synovial hyperplasia resulting in collapsed vascular network to supply blood flow [41]. Research has shown that hypoxia-inducible factor-2α (HIF-2α) critically mediated the crosstalk between synovial fibroblasts and chondrocytes in RA, and increased secretion of chemokines and cytokines by chondrocytes facilitated synovial fibroblast invasion, leading to progressed cartilage erosion and joint destruction in RA [13,14,42]. The results from GSEA of the significantly dysregulated genes in RA chondrocytes of our dataset also identified 10 of the 17 genes related to hypoxia gene set up-regulated, as indicated in Figure 4. In addition, one of the primary clusters of potential PPI networks identified was also enriched in chemokine signaling and inflammatory response (Table 2). Thus, within the RA hypoxic joint microenvironment, crosstalk between different cell types confers important signals in disease pathogenesis and molecular signatures. We therefore attempted to explore the expression patterns of the top 20 dysregulated genes (10 up-regulated and 10 down-regulated genes) in clinical specimen from GEO database.
Among the top 20 dysregulated genes, we identified three genes, FGF9, KYNU and RGCC, having similar expression patterns in clinical RA synovial tissues. Analyzing the role of these genes of interest in related networks of all dysregulated genes in RA chondrocytes using IPA software, we observed the involvement of RGCC in the merged networks of diseases and functions related to rheumatoid arthritis, inflammation of joint, apoptosis of chondrocytes and cell cycle progression (Figure 7). The selection of cell cycle progression among the network was based on the consistent enrichment in DAVID database, GSEA and MCODE analyses. The coordination of chondrocyte proliferation and differentiation relies partly on the regulation of cell cycle proteins, particularly D-type cyclins that take place in the G1 phase determining the fate of progression through or withdraw from the cell cycle [43]. In normal articular cartilages, most chondrocytes are in quiescent G0 phase, and in diseased conditions like RA and osteoarthritis, chondrocytes tend to proliferate and enter S phase or G2 phase; RA cartilages showed higher percentage of S and G2 phase cells than osteoarthritis (OA) [44].
Regulator of cell cycle (RGCC), also known as response gene to complement 32 (RGC-32), complexes with cyclin-dependent kinase cdc2 to induce cell entry into S-phase; however, the regulatory pattern of RGCC in diseases differ [45-47]. An et al. reported increased expression of RGCC in hypoxic endothelial cells; however, RGCC overexpression reduced cell proliferation and inhibited angiogenesis through attenuating the expression of fibroblast growth factor 2, while RGCC silencing resulted in enhanced angiogenesis [48]. The results indicated the homeostatic role of RGCC in hypoxic endothelial cells. Another study by Tegla et al. suggested the inhibitory role of RGCC in cell cycle activation of T cells through FOXO1 suppression, using RGCC knockout mice [49]. The interaction between RGCC and Toll-like receptor 4 (TLR4) was also highlighted in the merged network shown in Figure 7. Increasing evidence supported the contribution of Toll-like receptors (TLRs) in stimulating innate immune response to facilitate inflammatory response in RA joints, and hypoxia-provoked increased expression of TLRs were observed in RA synovial tissues and synovial fluid macrophages [50,51]. The similarly down-regulated expression patterns of RGCC were also observed in our RA chondrocytes and in array datasets of clinical RA synovial tissues. Together with the enrichment analysis results, we proposed the important role of RGCC in regulating cell cycle progression of chondrocytes in hypoxic RA hypoxic joint microenvironment. The down-regulated RGCC may potentially propagate quiescent chondrocytes into cell cycle activation in RA, leading to cartilage tissue damage.
Kynureninase is a catalytic enzyme encoded by KYNU gene, acting within the kynurenine pathway of tryptophan metabolism that is related to immunomodulation and inflammation [52]. In murine macrophages and microglial cells, kynureninase activity and expression was activated by IFN-γ [53,54]. In patients with inflammatory skin diseases, the levels of mRNA and protein expression for KYNU were found up-regulated in skin lesions compared to non-involved skins, and positively correlated to disease severity [55,56]. In patients with RA, increased degradation of tryptophan in blood was observed [57,58]; however, the role of KYNU in arthritis is still undetermined. A recent study explored the interplay between metabolites of tryptophan and inflammatory arthritis using collagen-induced arthritis (CIA), an animal model of RA. The results suggested an increased rate of tryptophan catabolism through the kynurenine pathway, as observed in other chronic inflammatory diseases. The study also observed increased mRNA expression of KYNU in lymph nodes in the pre-arthritic stage but not in the established CIA stage, suggesting the potential metabolic regulation of KYNU gene during inflammation [59]. Research on the expressions of KYNU and tryptophan catabolism related metabolites in tissues of articular joint is lacking, while the increased expression of KYNU in RA chondrocytes and synovium were observed in our data and synovial tissue arrays from GEO database. Future research on the role of kynurenine pathway and its downstream genes in inflammatory arthritis may provide deeper understanding of the pathogenesis and therapeutic target development of joint destruction in RA.
The role of miRNA regulation in RA disease progression has gain much attention, and more widely discussed in RA were miR-146 and miR-155, which are stimulated by inflammatory stimuli such as IL-1, TNF-α and TLRs [60]. Most studies investigated the miRNA expressions in RA synovial tissue. MiR-146a was found more highly expressed in synovial tissues of RA patients than in OA, particularly macrophages [61], and regulate genes related to inflammation and apoptosis; however, whether the level of miR-146a correlates to RA disease activity remains conflicting [16]. We are interested in the expression profiling of miRNA in RA chondrocytes, and a 9-fold up-regulation in miR-146a-5p was also observed in our RA chondrocytes. Further miRNA expression profiling identified 31 dysregulated miRNAs in RA chondrocytes, mostly down-regulated. Using miRNA prediction database with systematic validation, we identified the potential interaction of miR-140-3p-FGF9 in RA chondrocytes.
In chondrocytes, miR-140 has been reported to regulate cartilage homeostasis [62]. In RA, lower expression levels of miR-140-3p and miR-140-5p were observed in synovial tissues of RA patients and autoimmune arthritis animal model, and miR-140 transfection in synovial fibroblast led to reduced proliferation and migration, and increased apoptosis [63]. Li et al. also reported miR-140-5p suppressed the proliferation and inflammatory cytokines secretion of RA synovial fibroblasts through targeting TLR4 [64]. The expression of miR-140-3p was 3.48-fold decreased in RA chondrocytes compared to normal chondrocytes, while the putative target of FGF9 was validated by miRNA prediction database. While fibroblast growth factor 2 was reported to promote angiogenesis through inflammatory cytokine mediation and accelerate matrix degradation in chondrocytes, the role of FGF9 in arthritis is less reported [65,66]. Physiologically, human FGF9 is expressed in relatively low level, and FGF9 is considered a potent mitogen that may lead to uncontrolled cell proliferation when overexpressed [67]. In primary synovial chondromatosis, a rare condition with the growth of cartilage nodule within synovial lining, elevated levels of FGF9 were observed in the synovial fluids and synoviocytes [68]. In colon cancer cells, hypoxia-induced translational activation triggered FGF9 protein expression [69]. Through NGS and bioinformatics analysis, we identified the potential miR-140-3p-FGF9 regulation in RA chondrocytes, which was also associated to cell cycle progression, as indicated in Figure 7. Whether post-transcriptional regulation of miR-140-3p on FGF9 take place in the hypoxic RA joint microenvironment and affect cell cycle progression of chondrocytes merits further investigation.
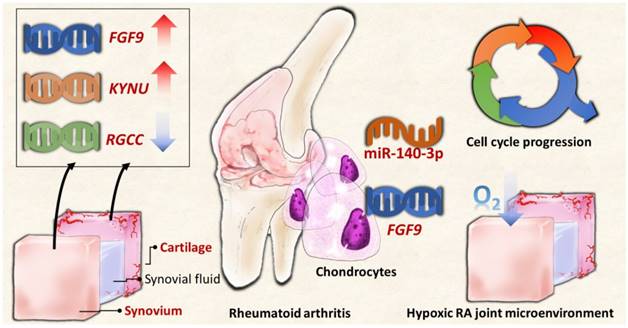
In summary, the current study identified novel genes and miRNA regulation in RA chondrocytes potentially affected in the changed joint microenvironment, showing similar expression patterns in clinical RA synovial tissues from GEO database. The proposed molecular signatures are presented in schematic summary in Figure 10. The findings implicate novel genes for targeted management in RA cartilage destruction.
The schematic summary of proposed molecular signatures in RA joint microenvironment.
Conclusions
The current study identified RGCC, FGF9 and KYNU potentially participate in the changed RA joint microenvironment and interrupt cell cycle progression of RA chondrocytes. Moreover, the novel miR-140-3p-FGF9 regulation is potentially involved in the pathogenesis of cartilage destruction through dysregulated cell growth in RA. The findings implicate novel genes for targeted management in RA cartilage destruction.
Acknowledgements
The authors gratefully acknowledge the support of research grants from the Ministry of Science and Technology (MOST 104-2320-B-037-014-MY3; MOST 105-2314-B-037-012), Ministry of Health and Welfare (MOHW107-TDU-B-212-123006), Kaohsiung Medical University Hospital Research Foundation (KMUHS10601; KMUH105-5M54; KMUH105-5R66), the Kaohsiung Medical University Research Foundation (105KMUOR05), and the “KMU-KMUH Co-Project of Key Research” (Grant No. KMU-DK 107009 from Kaohsiung Medical University).
Competing Interests
The authors have declared that no competing interest exists.
References
1. Grassi W, De Angelis R, Lamanna G. et al. The clinical features of rheumatoid arthritis. Eur J Radiol. 1998;27(Suppl 1):S18-24
2. Lipsky PE. Why does rheumatoid arthritis involve the joints? N Engl J Med. 2007;356:2419-2420
3. Huber LC, Distler O, Tarner I. et al. Synovial fibroblasts: Key players in rheumatoid arthritis. Rheumatology. 2006;45:669-675
4. Falconer J, Murphy AN, Young S. et al. Synovial cell metabolism and chronic inflammation in rheumatoid arthritis. Arthritis Rheumatol. 2018 doi: 10.1002/art.40504
5. Choy E. Understanding the dynamics: Pathways involved in the pathogenesis of rheumatoid arthritis. Rheumatology. 2012;51(Suppl 5):v3-11
6. Choy EH, Panayi GS. Cytokine pathways and joint inflammation in rheumatoid arthritis. N Engl J Med. 2001;344:907-916
7. Otero M, Goldring MB. Cells of the synovium in rheumatoid arthritis. Chondrocytes. Arthritis Res Ther. 2007;9:220
8. Andreas K, Lubke C, Haupl T. et al. Key regulatory molecules of cartilage destruction in rheumatoid arthritis: An in vitro study. Arthritis Res Ther. 2008;10:R9
9. Korb-Pap A, Stratis A, Muhlenberg K. et al. Early structural changes in cartilage and bone are required for the attachment and invasion of inflamed synovial tissue during destructive inflammatory arthritis. Ann Rheum Dis. 2012;71:1004-1011
10. Kim HA, Song YW. Apoptotic chondrocyte death in rheumatoid arthritis. Arthritis Rheum. 1999;42:1528-1537
11. Yatsugi N, Tsukazaki T, Osaki M. et al. Apoptosis of articular chondrocytes in rheumatoid arthritis and osteoarthritis: Correlation of apoptosis with degree of cartilage destruction and expression of apoptosis-related proteins of p53 and c-myc. J Orthop Sci. 2000;5:150-156
12. Schuerwegh AJ, Dombrecht EJ, Stevens WJ. et al. Synovial fluid and peripheral blood immune complexes of patients with rheumatoid arthritis induce apoptosis in cytokine-activated chondrocytes. Rheumatol Int. 2007;27:901-909
13. Huh YH, Lee G, Lee KB. et al. HIF-2α-induced chemokines stimulate motility of fibroblast-like synoviocytes and chondrocytes into the cartilage-pannus interface in experimental rheumatoid arthritis mouse models. Arthritis Res Ther. 2015;17:302
14. Huh YH, Lee G, Song WH. et al. Crosstalk between FLS and chondrocytes is regulated by HIF-2α-mediated cytokines in arthritis. Exp Mol Med. 2015;47:e197
15. Sato F, Tsuchiya S, Meltzer SJ. et al. MicroRNAs and epigenetics. FEBS J. 2011;278:1598-1609
16. Churov AV, Oleinik EK, Knip M. MicroRNAs in rheumatoid arthritis: Altered expression and diagnostic potential. Autoimmun Rev. 2015;14:1029-1037
17. Bhanji RA, Eystathioy T, Chan EK. et al. Clinical and serological features of patients with autoantibodies to GW/P bodies. Clin Immunol. 2007;125:247-256
18. Vicente R, Noel D, Pers YM. et al. Deregulation and therapeutic potential of microRNAs in arthritic diseases. Nat Rev Rheumatol. 2016;12:211-220
19. Withrow J, Murphy C, Liu Y. et al. Extracellular vesicles in the pathogenesis of rheumatoid arthritis and osteoarthritis. Arthritis Res Ther. 2016;18:286
20. Giannopoulou EG, Elemento O, Ivashkiv LB. Use of RNA sequencing to evaluate rheumatic disease patients. Arthritis Res Ther. 2015;17:167
21. Goulielmos GN, Zervou MI, Myrthianou E. et al. Genetic data: The new challenge of personalized medicine, insights for rheumatoid arthritis patients. Gene. 2016;583:90-101
22. Ammari M, Jorgensen C, Apparailly F. Impact of microRNAs on the understanding and treatment of rheumatoid arthritis. Curr Opin Rheumatol. 2013;25:225-233
23. Chhangawala S, Rudy G, Mason CE. et al. The impact of read length on quantification of differentially expressed genes and splice junction detection. Genome Biol. 2015;16:131
24. Tarazona S, Garcia-Alcalde F, Dopazo J. et al. Differential expression in RNA-seq: A matter of depth. Genome Res. 2011;21:2213-2223
25. Ramskold D, Wang ET, Burge CB. et al. An abundance of ubiquitously expressed genes revealed by tissue transcriptome sequence data. PLoS Comput Biol. 2009;5:e1000598
26. Hart T, Komori HK, LaMere S. et al. Finding the active genes in deep RNA-seq gene expression studies. BMC Genomics. 2013;14:778
27. Baras AS, Mitchell CJ, Myers JR. et al. miRge - a multiplexed method of processing small RNA-seq data to determine microRNA entropy. PloS One. 2015;10:e0143066
28. Huang DW, Sherman BT, Tan Q. et al. DAVID bioinformatics resources: Expanded annotation database and novel algorithms to better extract biology from large gene lists. Nucleic Acids Res. 2007;35:W169-175
29. Subramanian A, Tamayo P, Mootha VK. et al. Gene set enrichment analysis: A knowledge-based approach for interpreting genome-wide expression profiles. Proc Natl Acad Sci. 2005;102:15545-15550
30. Szklarczyk D, Franceschini A, Wyder S. et al. STRING v10: Protein-protein interaction networks, integrated over the tree of life. Nucleic Acids Res. 2015;43:D447-452
31. Isserlin R, Merico D, Voisin V. et al. Enrichment map - a Cytoscape app to visualize and explore OMICs pathway enrichment results. F1000Res. 2014;3:141
32. Bader GD, Hogue CW. An automated method for finding molecular complexes in large protein interaction networks. BMC Bioinformatics. 2003;4:2
33. Islam MF, Hoque MM, Banik RS. et al. Comparative analysis of differential network modularity in tissue specific normal and cancer protein interaction networks. J Clin Bioinforma. 2013;3:19
34. Thomas S, Bonchev D. A survey of current software for network analysis in molecular biology. Hum Genomics. 2010;4:353-360
35. Krämer A, Green J, Pollard J Jr. et al. Causal analysis approaches in ingenuity pathway analysis. Bioinformatics. 2014;30:523-530
36. Clough E, Barrett T. The gene expression omnibus database. Methods Mol Biol. 2016;1418:93-110
37. Barrett T, Wilhite SE, Ledoux P. et al. NCBI GEO: Archive for functional genomics data sets-update. Nucleic Acids Res. 2013;41:D991-995
38. Vejnar CE, Zdobnov EM. Mirmap: Comprehensive prediction of microRNA target repression strength. Nucleic Acids Res. 2012;40:11673-11683
39. Vejnar CE, Blum M Zdobnov EM. miRmap web: Comprehensive microRNA target prediction online. Nucleic Acids Res. 2013;41:W165-168
40. Jeon CH, Ahn JK, Chai JY. et al. Hypoxia appears at pre-arthritic stage and shows co-localization with early synovial inflammation in collagen induced arthritis. Clin Exp Rheumatol. 2008;26:646-648
41. Quinonez-Flores CM, Gonzalez-Chavez SA, Pacheco-Tena C. Hypoxia and its implications in rheumatoid arthritis. J Biomed Sci. 2016;23:62
42. Iwamoto T, Okamoto H, Iikuni N. et al. Monocyte chemoattractant protein-4 (MCP-4)/CCL13 is highly expressed in cartilage from patients with rheumatoid arthritis. Rheumatology. 2006;45:421-424
43. Beier F, Leask TA, Haque S. et al. Cell cycle genes in chondrocyte proliferation and differentiation. Matrix Biol. 1999;18:109-120
44. Kusuzaki K, Sugimoto S, Takeshita H. et al. DNA cytofluorometric analysis of chondrocytes in human articular cartilages under normal aging or arthritic conditions. Osteoarthritis Cartilage. 2001;9:664-670
45. Badea T, Niculescu F, Soane L. et al. RGC-32 increases p34CDC2 kinase activity and entry of aortic smooth muscle cells into S-phase. J Biol Chem. 2002;277:502-508
46. Vlaicu SI, Cudrici C, Ito T. et al. Role of response gene to complement 32 in diseases. Arch Immunol Ther Exp. 2008;56:115-122
47. Counts SE, Mufson EJ. Regulator of cell cycle (RGCC) expression during the progression of alzheimer's disease. Cell Transplant. 2017;26:693-702
48. An X, Jin Y, Guo H. et al. Response gene to complement 32, a novel hypoxia-regulated angiogenic inhibitor. Circulation. 2009;120:617-627
49. Tegla CA, Cudrici CD, Nguyen V. et al. RGC-32 is a novel regulator of the T-lymphocyte cell cycle. Exp Mol Pathol. 2015;98:328-337
50. Huang QQ, Pope RM. The role of toll-like receptors in rheumatoid arthritis. Curr Rheumatol Rep. 2009;11:357-364
51. Hu F, Mu R, Zhu J. et al. Hypoxia and hypoxia-inducible factor-1α provoke toll-like receptor signalling-induced inflammation in rheumatoid arthritis. Ann Rheum Dis. 2014;73:928-936
52. Wang Q, Liu D, Song P. et al. Tryptophan-kynurenine pathway is dysregulated in inflammation, and immune activation. Front Biosci. 2015;20:1116-1143
53. Alberati-Giani D, Ricciardi-Castagnoli P, Kohler C. et al. Regulation of the kynurenine metabolic pathway by interferon-gamma in murine cloned macrophages and microglial cells. J Neurochem. 1996;66:996-1004
54. O'Farrell K, Fagan E, Connor TJ. et al. Inhibition of the kynurenine pathway protects against reactive microglial-associated reductions in the complexity of primary cortical neurons. Eur J Pharmacol. 2017;810:163-173
55. Ito M, Ogawa K, Takeuchi K. et al. Gene expression of enzymes for tryptophan degradation pathway is upregulated in the skin lesions of patients with atopic dermatitis or psoriasis. J Dermatol Sci. 2004;36:157-164
56. Harden JL, Lewis SM, Lish SR. et al. The tryptophan metabolism enzyme L-kynureninase is a novel inflammatory factor in psoriasis and other inflammatory diseases. J Allergy Clin Immunol. 2016;137:1830-1840
57. Schroecksnadel K, Winkler C, Duftner C. et al. Tryptophan degradation increases with stage in patients with rheumatoid arthritis. Clin Rheumatol. 2006;25:334-337
58. Schroecksnadel K, Kaser S, Ledochowski M. et al. Increased degradation of tryptophan in blood of patients with rheumatoid arthritis. J Rheumatol. 2003;30:1935-1939
59. Kolodziej L. An exploratory study of the interplay between decreased concentration of tryptophan, accumulation of kynurenines, and inflammatory arthritis. IUBMB Life. 2012;64:983-987
60. Sheedy FJ, O'Neill LA. Adding fuel to fire: microRNAs as a new class of mediators of inflammation. Ann Rheum Dis. 2008;67(Suppl 3):iii50-55
61. Nakasa T, Miyaki S, Okubo A. et al. Expression of microRNA-146 in rheumatoid arthritis synovial tissue. Arthritis Rheum. 2008;58:1284-1292
62. Miyaki S, Sato T, Inoue A. et al. MicroRNA-140 plays dual roles in both cartilage development and homeostasis. Genes Dev. 2010;24:1173-1185
63. Peng JS, Chen SY, Wu CL. et al. Amelioration of experimental autoimmune arthritis through targeting of synovial fibroblasts by intraarticular delivery of microRNAs 140-3p and 140-5p. Arthritis Rheum. 2016;68:370-381
64. Li H, Guan SB, Lu Y. et al. MiR-140-5p inhibits synovial fibroblasts proliferation and inflammatory cytokines secretion through targeting TLR4. Biomed Pharmacother. 2017;96:208-214
65. Chien SY, Huang CY, Tsai CH. et al. Interleukin-1β induces fibroblast growth factor 2 expression and subsequently promotes endothelial progenitor cell angiogenesis in chondrocytes. Clin Sci. 2016;130:667-681
66. Im HJ, Li X, Muddasani P. et al. Basic fibroblast growth factor accelerates matrix degradation via a neuro-endocrine pathway in human adult articular chondrocytes. J Cell Physiol. 2008;215:452-463
67. Hendrix ND, Wu R, Kuick R. et al. Fibroblast growth factor 9 has oncogenic activity and is a downstream target of Wnt signaling in ovarian endometrioid adenocarcinomas. Cancer Res. 2006;66:1354-1362
68. Robinson D, Hasharoni A, Evron Z. et al. Synovial chondromatosis: The possible role of FGF9 and FGF receptor 3 in its pathology. Int J Exp Pathol. 2000;81:183-189
69. Chen TM, Shih YH, Tseng JT. et al. Overexpression of FGF9 in colon cancer cells is mediated by hypoxia-induced translational activation. Nucleic Acids Res. 2014;42:2932-2944
Author contact
![]() Corresponding authors: Chia-Hsin Chen; chchenedu.tw; Tel.: +886-7-312-1101 ext. 5962 and Po-Lin Kuo; kuopolinnet.tw; Tel.: +886-7-312-1101 ext. 2512-33
Corresponding authors: Chia-Hsin Chen; chchenedu.tw; Tel.: +886-7-312-1101 ext. 5962 and Po-Lin Kuo; kuopolinnet.tw; Tel.: +886-7-312-1101 ext. 2512-33