Impact Factor ISSN: 1449-1907
- Issue 9; 2026
- Issue 8; 2026
- Issue 7; 2026
- Issue 6; 2026
- Issue 5; 2026
- Volume 23; 2026
- Past Issues
- Editorial Board
- Cover Images
- Index & Coverage
- Cover Suggestion
- Special Issues
Introduction
Materials and Methods
Results
Discussion
Abbreviations
Supplementary Material
Compliance with Ethical Standards
References

 Global reach, higher impact
Int J Med Sci 2018; 15(5):447-455. doi:10.7150/ijms.22410 This issue Cite
Research Paper
Downregulation of MiR-203a Disinhibits Bmi1 and Promotes Growth and Proliferation of Keratinocytes in Cholesteatoma
Jian Zang, Lian Hui, Ning Yang, Bo Yang, Xuejun Jiang ![]()
Department of Otolaryngology, The First Affiliated Hospital of China Medical University, Shenyang 110001, China.
Received 2017-8-16; Accepted 2018-2-4; Published 2018-3-8
Abstract
Background: Keratinocytes are the predominant cell type in a cholesteatoma, and microRNA (miR)-203a has been shown to be essential for the growth and differentiation of keratinocytes. The regulatory mechanisms of miR-203a and Bmi1—the predicted target of miR-203a that is associated with cholesteatoma—have not been clarified.
Methods: Real-time PCR and western blot were carried out for the detection of miRNAs, mRNAs, and proteins, including miR-203a, Bmi1, and phosphorylated (p-)Akt. Immunohistochemical staining was applied to observe the expression and distribution of Bmi1 and of p-Akt in cholesteatoma and in control retroauricular skin. The dual luciferase reporter assay was used to analyze the relationship between miR-203a and Bmi1. Ectopic miR-203a and Bmi1 were transfected into an immortalized line of human keratinocytes (HaCaT cells), and the roles of these molecules in cell proliferation, apoptosis, and migration were explored.
Results: Cholesteatoma tissues were characterized by downregulation of miR-203a and concomitant upregulation of Bmi1. Results of the dual-luciferase reporter assay indicated that Bmi1 was a direct target gene of miR-203a. Silencing of miR-203a increased Bmi1 expression; promoted proliferation, colony formation, and migration of HaCaT cells; and inhibited apoptosis. Moreover, p-Akt was significantly increased in cholesteatoma tissues and was positively correlated with Bmi1. Suppression of Bmi1 reduced p-Akt expression in HaCaT cells; subsequent inhibition of miR-203a reversed this phenomenon.
Conclusions: Our results reveal that miR-203a may regulate cholesteatoma growth and proliferation by targeting Bmi1. These findings provide insight for the development of novel nonsurgical options for cholesteatoma.
Keywords: cholesteatoma, microRNA, microRNA-203a, B-cell specific moloney murine leukemia virus insertion site 1 (Bmi1), p-Akt
Introduction
Middle ear cholesteatoma is a well-circumscribed cystic lesion that occurs when a keratinizing squamous epithelium grows abnormally in the temporal bone [1]. Cholesteatoma keratinocytes exhibit proliferation and migration characteristics akin to a tumor [2, 3], and numerous researchers have demonstrated upregulation of tumor-related genes and markers of proliferation in cholesteatoma specimens [4-7]. Cholesteatoma-associated otitis media is a common disease in otolaryngology, and the pathogenesis of cholesteatoma is a topic of intense research. However, cholesteatoma still is not understood fully, and a feasible nonsurgical treatment is lacking for this condition.
Micro (mi)RNAs are small noncoding RNA molecules that regulate post-transcriptional expression by intervening in the degradation of mRNA and/or by inhibiting translation; miRNAs primarily are negative regulators [8]. MiRNAs play crucial roles in diverse biological processes, including proliferation, differentiation, apoptosis, and migration [9, 10]. Investigators previously have demonstrated that miR-203a is specific to epithelial tissue; affects the growth, differentiation, and function of keratinocytes; and is an important contributor to skin development [11-13]. In many tumors, miR-203a has been shown to prevent or suppress cancer [14-17]. Like the skin, a cholesteatoma is composed primarily of keratinocytes; like a tumor, the keratinocytes of a cholesteatoma exhibit abnormal proliferation and migration. However, no studies have addressed the putative contributions of miR-203a and its predicted target gene in cholesteatoma.
To identify the predicted gene target of miR-203a, we probed for a stem-associated factor that was regulated by miR-203a and closely related to cell proliferation. The B-cell specific moloney murine leukemia virus insertion site 1 (Bmi1) is vital for maintaining stemness and self-renewal in normal and cancerous cells [18, 19]. Bmi1 belongs to the polycomb-group (PCG) family of proteins. As a transcriptional inhibitor, Bmi1 can silence gene expression [19, 20], and results of several studies have indicated that Bmi1 is an important regulator of keratinocytes [21, 22]. In the human epidermis, Bmi1 promotes proliferation of keratinocytes and prevents premature aging and death of these cells [22]. Disorders that affect Bmi1 expression often are associated with the occurrence and development of malignant tumors [23]. Overexpression of Bmi1 can promote abnormal proliferation, invasion, and metastasis of tumor cells by increasing the level of phosphorylated (p-)Akt [24-27]. Notably, p-Akt also is essential in cholesteatoma pathogenesis [28, 29]. The expression level of Bmi1 in cholesteatoma and the potential relationship between Bmi1 and p-Akt in cholesteatoma have not been examined.
In the current study, we found that the expression levels of miR-203a and Bmi1 are inversely correlated in cholesteatoma, with miR-203a downregulated and Bmi1 upregulated. Furthermore, we demonstrated that Bmi1 is a direct target of miR-203a. Reduced expression of miR-203a promoted abnormal proliferation and migration of HaCaT cells and inhibited apoptosis; silencing of Bmi1 rescued these functions. We also determined that Bmi1 positively regulates p-Akt in cholesteatoma. Low expression of miR‑203a is essential for the development of cholesteatoma; this finding may provide insight regarding nonsurgical therapies for patients with cholesteatoma.
Materials and Methods
Clinical samples
Cholesteatoma and retroauricular skin specimens that served as control tissues were obtained from patients (mean age, 45.84 years; age range, 8-76 years) who had undergone middle ear surgery at the First Affiliated Hospital of China Medical University (Shenyang, China) from July 2015 to July 2016. Clinical histories were reviewed for all patients included in this study. A total of 56 cholesteatoma specimens and 28 retroauricular skin specimens were collected. These specimens included 20 pairs in which 1 patient provided both a cholesteatoma and a retroauricular skin sample. This study was approved by the Ethics Committee of the First Affiliated Hospital of China Medical University, and all patients (or the parents of patients younger than 18 years old) provided written informed consent prior to surgery.
Polymerase chain reaction
Total RNA was extracted from tissues and cells using RNAiso plus (Takara Biotechnology, Dalian, China), according to the manufacturer's instructions. To examine the expression of miRNAs and mRNA, total RNA (including miRNAs) was polyadenylated by means of E. coli Poly(A) Polymerase (New England Biolabs, Ipswich, MA) and then was reverse-transcribed (RT) into cDNA using a PrimeScript RT Reagent Kit with gDNA Eraser (Takara). Amplification of cDNAs was achieved by quantitative real-time polymerase chain reaction (qPCR) with SYBR Premix Ex Taq II (Takara) on a 7500 Real-Time PCR System (Applied Biosystems, Foster City, CA). U6 and GAPDH were applied as endogenous controls. Relative gene expression was calculated in terms of threshold cycle (CT) values, using the 2-ΔΔCT method.
The primer sequences were as follows: miR-203a: 5'-GCGTGAAATGTTTAGGACCACT-3';
miR-reverse: 5'-GCTGTCAACGATACGCTACG-3'; miR-RT primer: 5'-GCTGTCAACGATACGCTACGTAACGGCATGACAGTGTTTTTTTTTTTTTTTTTTTTTTT-3'; U6 forward: 5'-CTCGCTTCGGCAGCACA-3' and
reverse: 5'-AACGCTTCACGAATTTGCGT-3'; Bmi1 forward: 5'-CTGCAGCTCGCTTCAAGATG-3' and
reverse: 5'-TTAGCTCAGTGATCTTGATTCTCGT-3'; GAPDH forward: 5'-GTCTCCTCTGACTTCAACAGCG-3' and reverse: 5'-ACCACCCTGTTGCTGTAGCCAA-3'.
Cell culture and transfection
An experimental line of human immortalized keratinocytes (HaCaT) was obtained from the Dermatology Key Laboratory of China Medical University. Cells were cultured in high-glucose Dulbecco's Modified Eagle Media (DMEM) (HyClone, Thermo Fisher, Beijing, China) with 10% fetal bovine serum (FBS) (Corning, Thermo Fisher, Waltham, MA). HaCaT cells were grown under sterile, humidified conditions at 37℃ and 5% CO2. The miR-203a inhibitor, control miRNA, Bmi1 small interfering (si)RNA, and control siRNA were synthesized by RiboBio (Guangzhou, China). They were transiently transfected into cells using Lipofectamine 3000 reagent (Invitrogen, Carlsbad, CA), according to the manufacturer's instructions.
Western blot and immunohistochemistry
Tissues or cells were lysed with RIPA (radioimmunoprecipitation assay) lysis buffer containing 1 mM of phenylmethylsulfonyl fluoride (PMSF). The proteins were separated through a 10% sodium dodecyl sulfate (SDS) polyacrylamide gel electrophoresis (PAGE) and were transferred to polyvinylidene fluoride (PVDF) membranes (Millipore, Danvers, MA). After blocking, the membranes were incubated with primary antibody (anti-Bmi1 and anti-GAPDH [both, Proteintech, Rosemont, IL]; anti-Akt and anti-p-Akt [both, Santa Cruz Biotechnology, Santa Cruz, CA]). The results were visualized using an enhanced chemiluminescence (ECL) detection system (Thermo Fisher).
For immunohistochemistry, sections were incubated overnight with primary antibody and subsequently with biotin-labeled secondary antibody. The specimens were photographed under an inverted light microscope (Olympus, Tokyo, Japan). Immunostaining was evaluated in terms of the product of staining intensity and the percentage of positive stained cells, as described previously [28]. Staining intensity was scored as follows: 0, no staining; 1, weak staining; 2, moderate staining; 3, strong staining. The percentage of positively stained cells was scored as follows: 0, no staining (negative); 1, <10% stained; 2, 10% to 50% stained; 3, >50% stained. Both staining intensity and the positivity rate of staining were analyzed independently by 2 experienced researchers under double-blind conditions. The results were regarded as negative if the overall score was ≤2 and as positive if the overall score was ≥3.
Dual luciferase reporter assay
Luciferase reporter vectors containing the wild-type or mutant Bmi1 3ʹ untranslated region (UTR) were prepared by RiboBio Co. Ltd. (Guangzhou, China). For the luciferase reporter assay, HaCaT cells were seeded in 96-well plates at a density of 1.5 × 10⁴ cells per well. Following culture for 48 hours, the cells were transiently cotransfected with miR‑203a mimics/control miRNA and with Bmi1-3ʹUTR‑wild/Bmi1-3ʹUTR‑mutant reporter vectors using Lipofectamine 3000 (Invitrogen), according to the manufacturer's instructions. At 48 hours post-transfection, luciferase activity was evaluated using the Dual-Glo Luciferase Assay System (Promega, Madison, WI).
Cell proliferation and colony formation
Cells were transfected with a negative-control miR inhibitor or a miR-203a inhibitor or were cotransfected with a miR-203a inhibitor and Bmi1 siRNA and were collected 24 hours later. A single-cell suspension then was prepared and transferred to a 96-well plate. The density was adjusted to 3000 cells per well, and 5 wells corresponded to each experimental group. Cell proliferation was detected using an Infinite M200 Pro Microplate Reader (Tecan, Männedorf, Switzerland) and a CellTiter 96 AQueous Single Solution Cell Proliferation Assay Kit (MTS, Promega). Absorbance was determined at 490 nm (OD490) daily for 3 consecutive days, and a cell growth curve was plotted. To assess cell colony formation, cells were transfected and at 24 hours were seeded into 6‑well plates at a density of 400 cells per well. Cells then were incubated for 10 to 14 days with high-glucose DMEM. When macroscopic colonies could be discerned, the colonies were counted.
Cell cycle analysis
Cells were transfected and maintained in culture for 48 hours. Cells then were fixed with 70% ethanol overnight at 4°C and were incubated with RNaseA at 37°C for 30 minutes. Staining with propidium iodide (PI) (KeyGen Biotech, Nanjing, China) was carried out for 30 minutes at 4℃, and cells were analyzed in an aliquot of 1 × 10⁶ cells by means of flow cytometry (FACSCalibur, BD Biosciences, Franklin Lakes, NJ). Cell cycle distribution was expressed as a percentage of the cells.
Apoptosis assay
Cells were transfected, cultured for 48 hours, and collected. Cell density was adjusted to 1 × 10⁶ cells/mL. An Alexa Fluor 488 Annexin V/Dead Cell Apoptosis Kit (Invitrogen) then was applied, according to the manufacturer's instructions. The level of apoptosis was evaluated by flow cytometry (FACSCalibur, BD Biosciences).
Cell migration assay
Cells were transfected and cultured for 24 hours. Cells then were collected and plated in serum-free medium (cell density, 2 × 10⁵) in the upper layer of a transwell insert (Corning). In the bottom layer, DMEM containing 20% FBS was added, and cells were incubated for 24 hours. The nonmigratory cells were scraped from the upper surface with a cotton swab and discarded. The cells on the lower surface were fixed with 100% methanol and were stained with hematoxylin. Migratory cells then were counted under a microscope (Olympus).
Statistical analysis
Data were expressed as mean ± standard deviation (SD) from 3 independent experiments. Statistical significance was determined by a 2‑tailed Student's t test or by 1-way analysis of variance (ANOVA) using GraphPad Prism 7.0 software (San Diego, CA). Correlations were ascertained by means of Pearson and Spearman correlation analyses. The enumeration data were compared by the χ2 test. Statistical significance was defined as P < 0.05.
Results
Low expression of miR-203a is negatively correlated with that of Bmi1 in cholesteatoma
We selected and analyzed 3 miRNAs associated with cell proliferation in specimens from 56 cases of cholesteatoma and in 28 retroauricular skin tissue specimens (Supplementary Figure S1). The results of real-time PCR indicated that only the expression of miR-203a was significantly lower in cholesteatoma than in normal retroauricular skin (Figure 1A). However, the level of miR-203a in cholesteatoma was not correlated significantly with clinical findings (Supplementary Table S1).
In cholesteatoma, miR-203a expression is low and is negatively correlated with that of Bmi1. (A) Expression of miR-203a in 56 cases of cholesteatoma and in 28 normal retroauricular skin specimens was detected by real-time PCR. *P < 0.05. (B) Expression of miR-203a in 20 paired cholesteatoma and retroauricular skin specimens was ascertained by real-time PCR. (C) Statistical analysis of miR-203a expression (n = 20). *P < 0.05. (D) Western blot results of the expression of Bmi1 in 20 cases of cholesteatoma and in paired retroauricular skin specimens. (C, cholesteatoma; S, corresponding retroauricular skin). (E) Statistical analysis of Bmi1 protein (n = 20). *P < 0.05. (F) Results of Pearson correlation analysis of miR-203a and Bmi1 in 20 cases of cholesteatoma. (G) Immunohistochemical staining findings of Bmi1 in cholesteatoma and in corresponding retroauricular skin samples (original magnification, ×400).
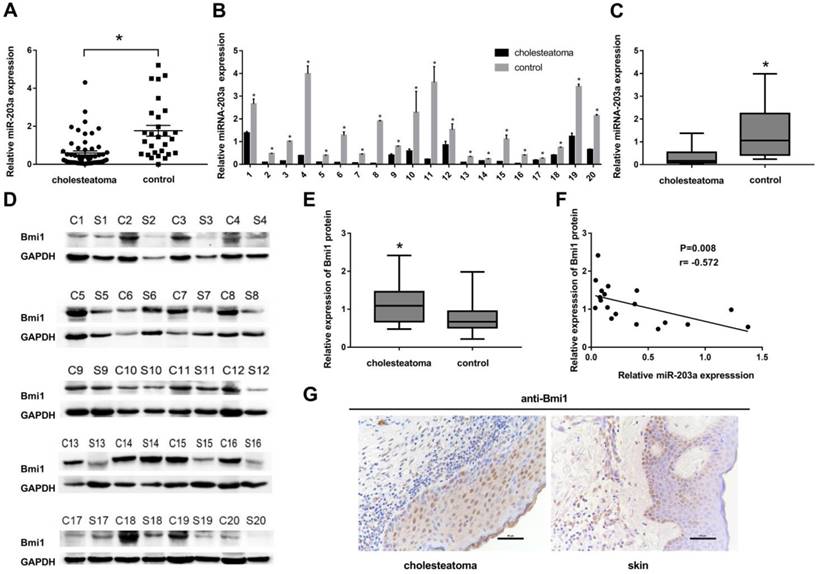
Twenty patients had provided paired cholesteatoma and retroauricular skin specimens. For all these cholesteatoma specimens, miR-203a was found to be significantly downregulated compared to the paired retroauricular skin sample (Figure 1B,C). In contrast, Bmi1 levels in paired samples were upregulated in cholesteatoma specimens (Figure 1D,E). Findings from Pearson correlation analysis revealed a strong negative correlation between the expression of miR-203a and that of Bmi1 in cholesteatoma (Figure 1F). Immunohistochemical evidence showed that Bmi1 was expressed primarily in the nuclei and populated nearly the full layer of cholesteatoma epithelium (Figure 1G). However, in retroauricular skin, Bmi1 mainly stained the basal-layer cells and occasionally the suprabasal layers (Figure 1G). The positivity rate of Bmi1 was 80% (16 of 20 specimens) in cholesteatoma and was 35% (7 of 20 specimens) in retroauricular skin (χ2 = 8.286, P = 0.004).
MiR-203a negatively regulates Bmi1 by directly binding to its 3ʹUTR
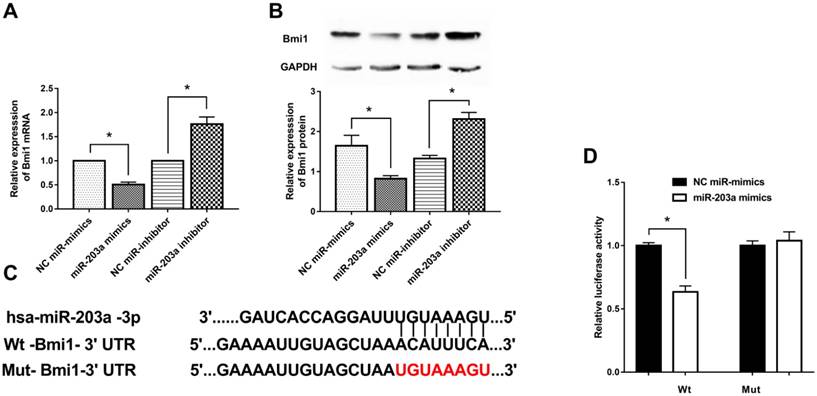
To investigate how Bmi1 expression is regulated by miR-203a, we transfected HaCaT cells with miR-203a mimics or a miR-203a inhibitor and measured Bmi1 levels. Bmi1 mRNA and protein levels in the miR-203a mimic group were significantly decreased; the opposite findings were obtained in the miR-203a inhibitor group (Figure 2A,B). To further verify whether miR-203a directly targets Bmi1, we prepared wild-type and mutant Bmi1-3ʹUTR reporter constructs (Figure 2C). We cotransfected negative-control miR-mimics/miR-203a mimics with these wild-type/mutant Bmi1-3ʹUTR reporter constructs into HaCaT cells and tested for luciferase activity. We determined that luciferase activity was significantly repressed in cells that had been cotransfected with the wild-type Bmi1-3ʹUTR reporter construct and miR-203a mimics (Figure 2D). In contrast, luciferase activity did not change significantly when cells were cotransfected with miR-203a mimics and the mutant Bmi1-3ʹUTR reporter constructs. Therefore, miR-203a directly interacts with the binding site of the Bmi1-3ʹUTR and negatively regulates the expression of Bmi1.
Bmi1 is a target gene of miR-203a and is inhibited by miR-203a. MiR-203a mimics, a miR-203a inhibitor, and corresponding negative controls were transfected into HaCaT cells. (A) Bmi1 mRNA levels were detected by real-time-PCR. *P < 0.05. (B) Bmi1 protein levels were examined by western blot. *P < 0.05. (C) Predicted binding sites of miR-203a with the 3ʹUTR of Bmi1 and the design of wild-type and mutant Bmi1-3ʹUTR reporter constructs. (D) Into HaCaT cells, wild-type or mutant Bmi1-3ʹUTR reporter constructs were cotransfected with negative-control miR mimics or miR-203a mimics. Luciferase activities was detected at 48 hours post-transfection. *P < 0.05.
Low levels of miR-203a disinhibit Bmi1 expression and result in proliferation, colony formation, migration, and reduced apoptosis of HaCaT cells
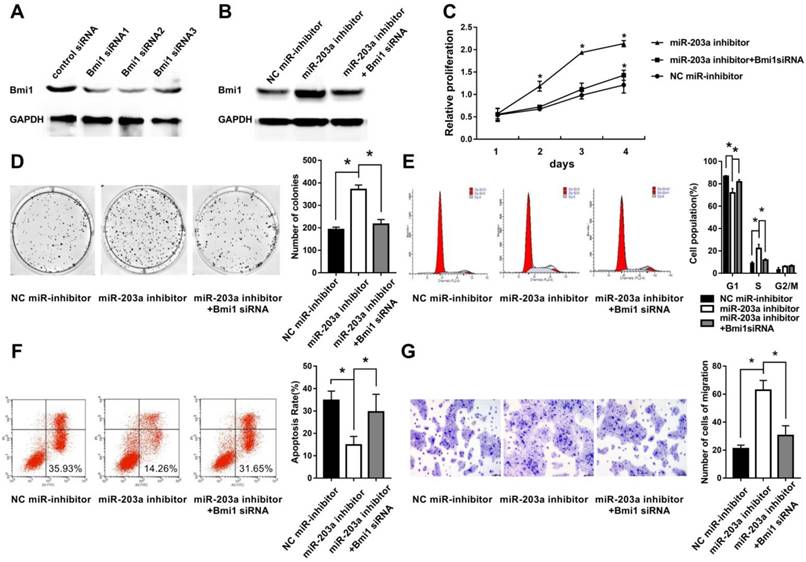
To simulate downregulation of miR-203a in cholesteatoma, we transfected HaCaT cells with a miR-203a inhibitor and evaluated Bmi1 levels and cell behaviors. We found significantly increased Bmi1 protein (Figure 3B); enhanced cell proliferation and clonogenic ability (Figure 3C,D); an increase in the percentage of cells in the S phase, and a decrease in the percentage of cells in the G0/G1 phase (Figure 3E); a decrease in the proportion of apoptotic cells (Figure 3F); and enhanced cell migratory ability (Figure 3G). All these changes were restored when HaCaT cells were cotransfected with a miR-203a inhibitor and Bmi1 siRNA (Figure 3).
Inhibition of miR-203a promotes cell proliferation, colony formation, migration, and evasion of apoptosis in HaCaT cells via upregulation of Bmi1. (A) The interference efficiency of Bmi1 siRNA in human keratinocytes. HaCaT cells were transfected with a negative-control miR inhibitor or a miR-203a inhibitor or were cotransfected with a miR-203a inhibitor and Bmi1 siRNA. (B) Bmi1 expression was detected by western blot. (C) Cell proliferation was analyzed by the MTS colorimetric method (Promega). (D) Clonogenic capacity was detected by the colony-forming assay. (E, F) Changes in cell cycle progression and apoptosis were examined by flow cytometry. (G) Cell migration ability was tested by the transwell cell migration assay. *P < 0.05.
Overexpression of p-Akt is positively correlated with that of Bmi1 in cholesteatoma
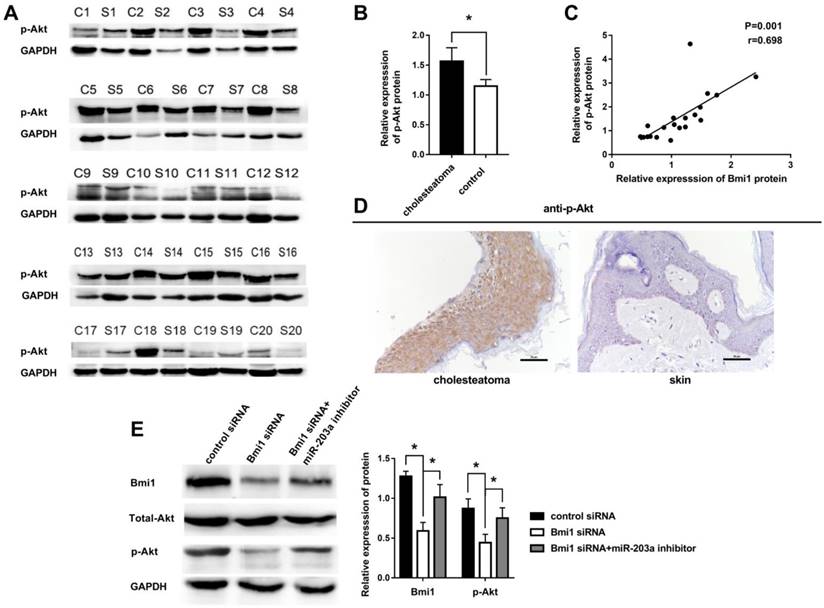
Other authors have noted that Bmi1 can elevate the level of p-Akt in many tumors. We hypothesized that this regulation also may occur in cholesteatoma. To test this hypothesis, we examined the expression of p-Akt in 20 paired cholesteatoma and retroauricular skin specimens. The expression of p-Akt was higher in cholesteatoma than in paired retroauricular skin (Figure 4A,B). Furthermore, results of Pearson correlation analysis showed a strong positive correlation between p-Akt and Bmi1 (Figure 4C). Immunohistochemistry findings were that p-Akt was expressed in almost the full layer of cholesteatoma epithelium and was found predominantly in the cytoplasm (Figure 4D). In contrast, p-Akt mainly was expressed in basal-layer cells of retroauricular skin. The positivity rate of p-Akt expression was 70% (14 of 20 specimens) in cholesteatoma and 25% (5 of 20 specimens) in retroauricular skin (χ2 = 8.120, P = 0.004). We also found a significant correlation in positive-staining scores for Bmi1 and p-Akt in 20 cases of cholesteatoma (Table 1).
Positive correlation between Bmi1 and p-Akt expression in 20 cases of cholesteatoma
| Bmi1 | p-Akt | r | P-value | |
|---|---|---|---|---|
| Positive | Negative | |||
| Positive | 13 | 3 | 0.491 | 0.028 |
| Negative | 1 | 3 | ||
The correlation between Bmi1 and p-Akt expression was ascertained by Spearman correlation analysis.
Overexpression of p-Akt is positively correlated with Bmi1 in cholesteatoma. (A) Western blot analysis of p-Akt, total Akt, and Bmi1 expression in 20 paired cholesteatoma and retroauricular skin specimens (C, cholesteatoma; S, retroauricular skin). (B) Statistical analysis of p-Akt expression from 20 paired cholesteatoma and retroauricular skin specimens. *P < 0.05. (C) Pearson correlation analysis of p-Akt and Bmi1 in 20 cases of cholesteatoma. (D) Immunohistochemical staining of p-Akt in cholesteatoma and retroauricular skin (original magnification, ×400). (E) Western blot analysis of Bmi1, total Akt, and p-Akt expression in HaCaT cells transfected with control siRNA, Bmi1 siRNA, or Bmi1 siRNA + miR-203a inhibitor. *P < 0.05.
MiR-203a regulates p-Akt via Bmi1 in HaCaT cells
We transfected control and Bmi1 siRNA into HaCaT cells and detected the expression of Bmi1, total Akt, and p-Akt by western blot. The results showed that the expression of Bmi1 protein and p-Akt protein in the Bmi1 siRNA group were significantly lower than in the control siRNA group (Figure 4E). When cells were cotransfected with Bmi1 siRNA and a miR-203a inhibitor, the expression of Bmi1 and p-Akt proteins were significantly recovered (Figure 4E). There were no significant differences in the expression of total Akt protein among the 3 groups.
Discussion
Investigators have demonstrated that miR-203a is a key regulator of proliferation and differentiation in keratinocytes of the skin [11-13]. In response to miR-203a expression, stemness of the cell is inhibited, and the cell exits the cell cycle, stops proliferating, and starts the process of directional differentiation [13]. Decreased miR-203a levels may yield an imbalance in proliferation and differentiation that may yield uncontrolled proliferation and tumor formation. This may explain why expression of miR-203a is diminished in bladder cancer, prostate cancer, esophageal squamous cell carcinoma, and human glioblastoma [14-17]. We demonstrated in the current study that the expression of miR-203a is significantly lower in cholesteatoma than in normal retroauricular skin (Figure 1A,B,C). This absence of negative regulation by miR-203a in cholesteatoma gives rise to excessive proliferation of keratinocytes, expanded migratory capacity, and decreased apoptosis.
We found that Bmi1 was expressed primarily in the basal layer of epithelium in normal retroauricular skin (Figure 1G); this is consistent with the findings of other researchers [30, 31]. In contrast, the expression of Bmi1 in cholesteatoma epithelium was found in nearly all layers, and the degree of staining was stronger (Figure 1G). Western blot results were consistent with immunohistochemical findings and confirmed that keratinocytes in cholesteatoma epithelium were of higher proliferative capacity than were keratinocytes in normal skin. Accordingly, Bmi1 is expressed at abnormally high levels in conditions involving excessive proliferation of keratinocytes, such as skin tumors and psoriasis [30-32]. A negative relationship was ascertained between miR-203a and Bmi1 in cholesteatoma tissues (Figure 1F). Furthermore, evidence from our bioinformatics analysis suggested the presence of a conserved binding site at which miR-203a could interact directly with the 3ʹUTR of Bmi1. The results of our dual-luciferase reporter assay further verified that Bmi1 was a downstream target of miR-203a and was negatively regulated by miR-203a (Figure 2). Hence, low expression of miR-203a directly disinhibits Bmi1, leading to a high Bmi1 level in cholesteatoma.
To simulate the downregulation of miR-203a in cholesteatoma, HaCaT cells were transfected with a miR-203a inhibitor. Transfected HaCaT cells displayed hyperproliferation, a low rate of apoptosis, and abnormal migration (Figure 3). Most notably, silencing Bmi1 was sufficient to rescue these events. Our results imply that a low level of miR-203a in cholesteatoma promotes the proliferation and migration of keratinocytes by disinhibiting Bmi1-associated pathways.
In malignant tumors, Bmi1 has been found to increase the level of p-Akt and ultimately enhance tumor cell proliferation, migration, and antiapoptotic abilities [24-27]. Some investigators have noted that an elevated level of p-Akt also is involved in the development of cholesteatoma [28, 29]. Consistently, in our current research the expression of p-Akt is significantly increased in cholesteatoma, compared with retroauricular skin, and is positively correlated with Bmi1. We also found that when the expression of Bmi1 is downregulated, p-Akt protein levels also are significantly downregulated in HaCaT cells. Both Bmi1 and p-Akt expression were restored when cells were cotransfected with Bmi1 siRNA and miR-203a inhibitors. Thus, miR-203a can affect the expression of p-Akt by targeting the expression of Bmi1. Results of the current study shed light on the expression of miR‑203a and its downstream target gene, Bmi1. However, the upstream mechanism by which expression of miR-203a is lowered in cholesteatoma remains unknown. We intend to explore this question in a future study.
In summary, we demonstrated herein that downregulation of miR-203a disinhibits Bmi1 and promotes cell proliferation, colony formation, migration, and evasion of apoptosis in cholesteatoma. Bmi1 also can enhance the expression of p-Akt in cholesteatoma. The miR-203a/Bmi1/p-Akt axis may be applied to advance knowledge regarding cholesteatoma pathogenesis and may have implications for the development of treatment strategies for cholesteatoma.
Abbreviations
miR-203a: microRNA-203a; Bmi1: B-cell specific moloney murine leukemia virus insertion site 1; p-Akt: phosphorylated protein kinase B.
Supplementary Material
Supplementary figure 1 and Supplementary table 1.
Compliance with Ethical Standards
All procedures performed in this study were in accordance with the ethical standards of the institutional research committee and with the 1964 Declaration of Helsinki.
Competing Interests
The authors declare that they have no conflicts of interest.
References
1. Semaan MT, Megerian CA. The pathophysiology of cholesteatoma. Otolaryngol Clin North Am. 2006;39:1143-59
2. Xie S, Xiang Y, Wang X, Ren H, Yin T, Ren J. et al. Acquired cholesteatoma epithelial hyperproliferation: Roles of cell proliferation signal pathways. Laryngoscope. 2016;126:1923-30
3. Karmody CS, Northrop C. The Pathogenesis of Acquired Cholesteatoma of the Human Middle Ear: Support for the Migration Hypothesis. Otology & Neurotology. 2012;33:42-7
4. Klenke C, Janowski S, Borck D, Widera D, Ebmeyer J, Kalinowski J. et al. Identification of novel cholesteatoma-related gene expression signatures using full-genome microarrays. PLoS One. 2012;7:e52718
5. Kim KH, Lim HJ, Kim YJ, Kim SW, Kim YS, Tian C. et al. The oncoprotein, gankyrin, is up-regulated in middle ear cholesteatoma. Acta Otolaryngol. 2014;134:238-43
6. Palko E, Poliska S, Csakanyi Z, Katona G, Karosi T, Helfferich F. et al. The c-MYC protooncogene expression in cholesteatoma. Biomed Res Int. 2014;2014:639896
7. Mette Bendixen T. Expression of the epidermal growth factor system in human middle ear cholesteatoma. Acta oto-laryngologica. 2014:2
8. Bartel DP. MicroRNAs: Genomics, biogenesis, mechanism, and function. Cell. 2004;116:281-97
9. Mahmoudian-sani MR, Mehri-Ghahfarrokhi A, Ahmadinejad F, Hashemzadeh-Chaleshtori M, Saidijam M, Jami MS. MicroRNAs: effective elements in ear-related diseases and hearing loss. European Archives of Oto-Rhino-Laryngology. 2017;274:2373-80
10. Li N, Qin Z-B. Inflammation-induced miR-802 promotes cell proliferation in cholesteatoma. Biotechnology Letters. 2014;36:1753-9
11. Yi R, Poy MN, Stoffel M, Fuchs E. A skin microRNA promotes differentiation by repressing 'stemness'. Nature. 2008;452:225-9
12. Wei T, Orfanidis K, Xu N, Janson P, Stahle M, Pivarcsi A. et al. The expression of microRNA-203 during human skin morphogenesis. Exp Dermatol. 2010;19:854-6
13. Nissan X, Denis JA, Saidani M, Lemaitre G, Peschanski M, Baldeschi C. miR-203 modulates epithelial differentiation of human embryonic stem cells towards epidermal stratification. Dev Biol. 2011;356:506-15
14. Bo J, Yang G, Huo K, Jiang H, Zhang L, Liu D. et al. microRNA-203 suppresses bladder cancer development by repressing bcl-w expression. FEBS J. 2011;278:786-92
15. Saini S, Majid S, Yamamura S, Tabatabai L, Suh SO, Shahryari V. et al. Regulatory Role of mir-203 in Prostate Cancer Progression and Metastasis. Clin Cancer Res. 2011;17:5287-98
16. Okumura T, Shimada Y, Moriyama M, Takei Y, Omura T, Sekine S. et al. MicroRNA-203 inhibits the progression of esophageal squamous cell carcinoma with restored epithelial tissue architecture in vivo. Int J Oncol. 2014;44:1923-32
17. Pal D, Mukhopadhyay D, Ramaiah MJ, Sarma P, Bhadra U, Bhadra MP. Regulation of Cell Proliferation and Migration by miR-203 via GAS41/miR-10b Axis in Human Glioblastoma Cells. PLoS One. 2016;11:e0159092
18. Park IK, Qian DL, Kiel M, Becker MW, Pihalja M, Weissman IL. et al. Bmi-1 is required for maintenance of adult self-renewing haematopoietic stem cells. Nature. 2003;423:302-5
19. Sauvageau M, Sauvageau G. Polycomb group proteins: multi-faceted regulators of somatic stem cells and cancer. Cell Stem Cell. 2010;7:299-313
20. Wang W, Qin JJ, Voruganti S, Nag S, Zhou J, Zhang R. Polycomb Group (PcG) Proteins and Human Cancers: Multifaceted Functions and Therapeutic Implications. Med Res Rev. 2015;35:1220-67
21. Eckert RL, Adhikary G, Rorke EA, Chew YC, Balasubramanian S. Polycomb group proteins are key regulators of keratinocyte function. J Invest Dermatol. 2011;131:295-301
22. Cordisco S, Maurelli R, Bondanza S, Stefanini M, Zambruno G, Guerra L. et al. Bmi-1 reduction plays a key role in physiological and premature aging of primary human keratinocytes. J Invest Dermatol. 2010;130:1048-62
23. Calao M, Sekyere EO, Cui HJ, Cheung BB, Thomas WD, Keating J. et al. Direct effects of Bmi1 on p53 protein stability inactivates oncoprotein stress responses in embryonal cancer precursor cells at tumor initiation. Oncogene. 2013;32:3616-26
24. Wang MC, Jiao M, Wu T, Jing L, Cui J, Guo H. et al. Polycomb complex protein BMI-1 promotes invasion and metastasis of pancreatic cancer stem cells by activating PI3K/AKT signaling, an ex vivo, in vitro, and in vivo study. Oncotarget. 2016;7:9587-600
25. Liu YL, Jiang SX, Yang YM, Xu H, Liu JL, Wang XS. USP22 acts as an oncogene by the activation of BMI-1-mediated INK4a/ARF pathway and Akt pathway. Cell Biochem Biophys. 2012;62:229-35
26. Xu Z, Liu H, Lv X, Liu Y, Li S, Li H. Knockdown of the Bmi-1 oncogene inhibits cell proliferation and induces cell apoptosis and is involved in the decrease of Akt phosphorylation in the human breast carcinoma cell line MCF-7. Oncol Rep. 2011;25:409-18
27. Chou CH, Yang NK, Liu TY, Tai SK, Hsu DS, Chen YW. et al. Chromosome instability modulated by BMI1-AURKA signaling drives progression in head and neck cancer. Cancer Res. 2013;73:953-66
28. Liu W, Yin T, Ren J, Li L, Xiao Z, Chen X. et al. Activation of the EGFR/Akt/NF-kappaB/cyclinD1 survival signaling pathway in human cholesteatoma epithelium. Eur Arch Otorhinolaryngol. 2014;271:265-73
29. Huisman MA, De Heer E, Grote JJ. Survival signaling and terminal differentiation in cholesteatoma epithelium. Acta Oto-Laryngologica. 2009;127:424-9
30. Reinisch CM, Uthman A, Erovic BM, Pammer J. Expression of BMI-1 in normal skin and inflammatory and neoplastic skin lesions. J Cutan Pathol. 2007;34:174-80
31. Lee K, Adhikary G, Balasubramanian S, Gopalakrishnan R, McCormick T, Dimri GP. et al. Expression of Bmi-1 in epidermis enhances cell survival by altering cell cycle regulatory protein expression and inhibiting apoptosis. J Invest Dermatol. 2008;128:9-17
32. Balasubramanian S, Adhikary G, Eckert RL. The Bmi-1 polycomb protein antagonizes the (-)-epigallocatechin-3-gallate-dependent suppression of skin cancer cell survival. Carcinogenesis. 2010;31:496-503
Author contact
![]() Corresponding author: Prof. Dr., Xuejun Jiang, MD, PhD, Department of Otolaryngology, The First Affiliated Hospital of China Medical University, No.155, Nanjing Street, Heping District, Shenyang 110001, China. E-mail: jiangxuejun1958com.
Corresponding author: Prof. Dr., Xuejun Jiang, MD, PhD, Department of Otolaryngology, The First Affiliated Hospital of China Medical University, No.155, Nanjing Street, Heping District, Shenyang 110001, China. E-mail: jiangxuejun1958com.