Impact Factor ISSN: 1449-1907

 Global reach, higher impact
Int J Med Sci 2018; 15(1):23-30. doi:10.7150/ijms.22002 This issue Cite
Research Paper
Effects of α-Mangostin on Viability, Growth and Cohesion of Multicellular Spheroids Derived from Human Breast Cancer Cell Lines
Giuseppe Scolamiero1, Claudia Pazzini1, Francesca Bonafè1, Carlo Guarnieri1, Claudio Muscari1,2 ![]()
1. Department of Biomedical and Neuromotor Sciences, University of Bologna, Via Irnerio 48, 40126 Bologna, Italy;
2. Health Sciences and Technologies, Interdepartmental Centre for Industrial Research, University of Bologna, 40064 Ozzano dell'Emilia (BO), Italy.
Received 2017-7-15; Accepted 2017-10-12; Published 2018-1-1
Abstract
Background: α-Mangostin (αMG) is extracted from Garcinia mangostana Linn and exerts antiproliferative activities. Although several researches on αMG were performed using cell monolayers, the in vitro pharmacological effects on 3D cancer models have never been investigated. Aim of the present study was to find new anticancer properties of αMG by evaluating the changes that this compound provokes in multicellular tumour spheroids (MCTSs).
Methods: MCTSs were generated from MDA-MB-231 and MCF-7 breast tumour cell lines and then treated with 0.1÷30 μg/ml αMG for 24 and 48 h. MCTS size, density, and cell migration were determined by software elaboration of phase contrast images captured by a digital camera. Cell viability was evaluated by resazurin and acid phosphatase assays, while cell apoptosis was assessed by a fluorescent assay of caspase activity. The distribution of living cells inside MCTSs was shown by live/dead fluorescence staining.
Results: A dose-dependent decrease in cell viability was obtained by treating MDA-MB-231 spheroids with αMG for 48 h (IC50 = 0.70-1.25 μg/ml). A significant reduction in spheroid volume, paralleled by its increased compactness, was observed only at concentration of 30 μg/ml, but not with lower doses of αMG. By contrast, αMG in the range of 5-15 μg/ml increased the size of MCTSs due to a parallel reduction in cell aggregation. The same window of concentrations was also able to stimulate cell apoptosis in a dose-dependent manner. Bimodal volumetric effects were also obtained by treating the spheroids generated from the MCF-7 cells with 0.1÷30 μg/ml αMG for 48 h. Finally, doses higher than 5 μg/ml caused a progressive impairment in cell migration from the edge of MDA-MB-231 MCTSs.
Conclusion: After exposure at doses of αMG just above IC50, MDA-MB-231 spheroids showed a significant reduction in cell adhesion that did not stimulate cell migration but, on the contrary, blunted cell motility. These findings suggest a novel anticancer feature of αMG that could be taken into consideration to improve conventional drug penetration into the tumour bulk.
Keywords: α-mangostin, multicellular tumour spheroid, breast cancer, cell viability, cell migration, cell aggregation.
Introduction
α-Mangostin (αMG) is a xanthone extracted from Garcinia mangostana Linn which exerts a wide range of therapeutic effects. This natural compound has been extensively investigated for its anticancer activity [1, 2], but it has also been considered for treating other diseases, including diabetes [3] and bacterial infections [4]. The principal mechanisms of action that have been attributed to αMG for counteracting tumour growth are: arrest of cell proliferation, induction of cell apoptosis, and suppression of angiogenesis and metastases [5, 6, 7]. For these reasons, αMG has been also proposed as a co-adjuvant in some protocol of anticancer therapy [8]. Indeed, the discovery of natural compounds with anticancer activities is an appealing theme of research, especially if the bioactive substances are not dangerous for healthy cells at therapeutic doses. Several natural compounds exerting antiproliferative effects in human cancer cells have been described, suggesting also a tool for tumour prevention [9, 10].
Multicellular tumour spheroids (MCTSs) have been using for cancer research since about fifty years ago as a three-dimensional (3D) alternative model to cell monolayers [11, 12]. One of the advantage provided by MCTSs is to simulate the solid tumours that grow more rapidly than their supporting vasculature, hence showing a decreasing oxygen/nutrient gradient from outside to inside [13]. The possibility to adopt MCTSs to perform high-throughput drug screening has been increasingly considered in recent times, but excessive simplifications of their measurements could lead to misleading conclusions. This is particularly true when spheroid size is determined automatically by dedicated instruments that do not provide further information on the internal morphology. Indeed, the mere data of volume reduction as an index of anticancer activity should require at least the supporting analysis of spheroid cell cohesion, since this latter parameter independently affects MCTS size.
Aim of the present study was to investigate the pharmacological effects of αMG on breast MCTSs, taking into account in a specific manner the changes in spheroid volume and density that cannot be evaluated using cell monolayers.
Materials and Methods
Cancer cell lines and culture conditions
Chemicals were purchased from Sigma-Aldrich (St. Louis, MO, USA), unless otherwise stated. The purity of αMG was > 98%. Highly invasive MDA-MB-231 triple negative breast cancer cell line (The European Collection of Authenticated Cell Cultures, ECACC, Sigma-Aldrich) was selected to perform both 2D and 3D assays. The less aggressive MCF-7 breast cancer cell line (ECACC) expressing estrogen and progesterone receptors was used to compare the relevant data obtained with MDA-MB-231 cells. Both tumour cell lines were grown in tissue culture flasks under standard conditions (37°C, 5% CO2, 95% humidity), using Dulbecco's modified Eagle medium (DMEM) supplemented with 10% fetal calf serum (FCS), 1% v/v L-glutamine, 100 U/ml penicillin, and 100 μg streptomycin. The medium was routinely changed twice weekly. When sub-confluent, cell monolayers were passaged using a detaching solution containing 0.05% trypsin in 0.53 mM EDTA.
MCTS generation
Both MDA-MB-231 and MCF-7 cells were re-suspended in serum-free DMEM/F12 (1:1) supplemented with 1% L-glutamine, 10 ng/mL basic fibroblast growth factor (b-FGF, Peprotech, St. Louis, MO, USA), 20 ng/mL epidermal growth factor (EGF, Peprotech), 100 U/ml penicillin, 100 μg/ml streptomycin, and 1% B27. For spheroid generation, 200 μl of cell suspensions at the density of 1.4 x 10³ cells per well were seeded in ultra-low attachment (ULA) 96-well round-bottomed plates (Corning B.V., Life Sciences, Amsterdam, The Netherlands). Plates with MCF-7 and MDA-MB-231 cells were centrifuged three times at 400 rpm for 3 min and then incubated at 37 °C, 5% CO2, 95% humidity for 3 and 4 days, respectively. At the end of these periods, the cell aggregates acquired the morphology of compact MCTSs; then, a 50% medium was replenished and MCTSs treated with αMG for 1 or 2 days as described in the following sections.
Volume measurement and fluorescent image acquisition of MCTSs
Phase-contrast images of MCTSs were captured using an inverted microscope (IX50, Olympus Italia, Segrate, Italy) equipped with a Canon G16 camera (Canon Europa, Amstelveen, The Netherlands) and imported into Image-J software (Fiji, http://fiji.sc/). The border of each spheroid was manually drawn to obtain the magnitude of the pseudo-circular area (A). The average radius was then calculated through the formula: r = √A/π and used to obtain the volume value of each MCTS: V = 4/3 π r3. The percentage of volume change due to αMG exposure for 24-48 h was calculated by comparing the same spheroid just before treatment (100%).
The degree of MCTS cohesion was then measured using the “Mean Grey” command of Image-J software applied to the 8-bit inverted images of each spheroid. This parameter provided the grey half-tone intensity-to-area ratio of the pseudo-circular images of MCTSs. After background subtraction, the final values were expressed as arbitrary units of spheroid density.
Zonal distribution of cell viability in MCTSs was determined by adding into each well 20 μg/ml carboxyfluorescein diacetate (CFDA) at 37 °C for 1 h. The dye was then washed-out three times with PBS and 50 μg/ml propidium iodide (PI) was incubated at 37 °C overnight. The day after, 100 μl of the medium were removed and MCTSs were washed three times with PBS. Fluorescent images were observed using the inverted microscope Olympus IX50 set with a wide band filter which allowed fluorescence to be simultaneously visible as green and red for CFDA and PI, respectively. The images were captured with the Canon G16 camera and imported into Image-J software using the 5D view application.
Viability assays for cell monolayers and MCTSs
For both cell monolayers and MCTSs, cell viability was measured using the Presto Blue assay (Invitrogen, Carlsbad, CA, USA) which indirectly quantifies living cells through the metabolically active reduction of resazurin to fluorescent resorufin. This assay allows to maintain cells viability and, therefore, to monitor cell growth with time. Cells were seeded into 96-well plates at the density of 2.0 x 10⁴ cells/ml and, at different time periods as indicated in the result section, the fluorescence was measured with 10% v/v Presto Blue buffer solution after 20-min incubation using a Victor2 multiwell plate reader (Perkin Elmer, Milan, Italy) set at ex. 540 nm and em. 590 nm.
For MCTSs, after removing the medium from each well containing the spheroid, 200 μl of 10% v/v Presto Blue buffer solution were added. The plate was incubated for 20 min at 37 °C and the fluorescence read as described for cell monolayers. Cell viability was also determined in MDA-MB-231 MCTSs by measuring the activity of acid phosphatase (APH), according to the method described by Friedrich et al. [14]. Briefly, after removing the medium, 100 μl PBS and 100 μl APH assay buffer, containing 2 mg/ml p-nitrophenylphosphate and 0.1% v/v TritonX in 0.1 M citrate buffer, were added in each well and the plate incubated for 90 min at 37 °C. The enzyme reaction was interrupted with 1 M NaOH and the absorbance read at 405 nm using the Victor2 multiwell plate reader.
Apoptosis assay
The activity of the main effector caspases 3, 6, and 7 was measured by the cleavage of the fluorogenic peptide substrate Ac-DEVD-AMC, as previously described [15]. Cell monolayers were scraped, centrifuged at 1,100 rpm, and the pellet resuspended in culture medium. Cell lysis was then obtained with three cycles of freezing/thawing followed by centrifugation at 12,000 rpm. The substrate Ac-DEVD-AMC was added to the surnatant for 15 min at 37 °C and the enzymatic reaction interrupted through the addition of 1 M HCl. Fluorescence was measured by setting the Victor2 multiwell plate reader at ex. 370 nm and em. 455 nm.
Cell migration from MCTSs
Migration activity of cells growing on the external surface of MCTSs was evaluated according to the method described by Vinci et al. [16] with some modifications. Flat-bottomed, 96-well plates (Corning B.V.) were coated with 15 μl of 0.2% gelatine in sterile water for 1 h at 37 °C (migration plate). A total of 100 μl/well of the culture medium that was used for MCTSs was then added. Afterwards, 100 μl of medium were removed from each well containing a 4-day spheroid and the remaining medium, including the spheroids, transferred into the prepared migration plate. Phase-contrast images of cell migration, occurring in the presence or absence of different concentrations of αMG, were obtained after 18 h at 37 °C using the abovementioned microscope. The propensity of cells to migrate was evaluated by measuring the pseudo-circular area covered by cells moving around the MCTS.
Statistical analysis
Statistical analysis was performed using the software GraphPad Prism version 4.0 (San Diego, CA, USA). Values are expressed as mean ± SEM. One-way analysis of variance (ANOVA) followed by Dunnett's post-hoc test was used for all comparisons. IC50 concentration of αMG was calculated using the nonlinear regression analysis of cell viability data and shown with the corresponding correlation coefficient (R2). P < 0.05 was considered statistically significant.
Results
Viability of MCTSs and monolayered cells
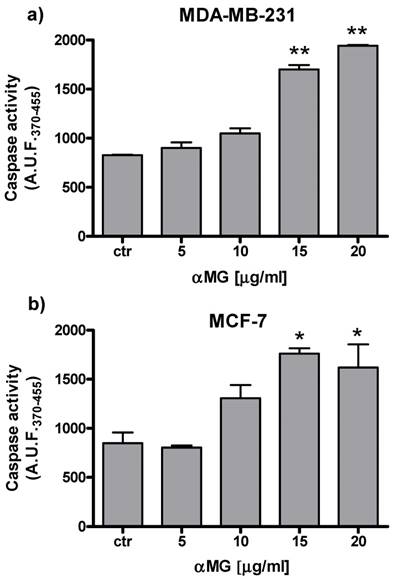
The viability of MDA-MB-231 MCTSs exposed to αMG was evaluated by measuring either resofulvin reduction or APH activity (Figure 1). Both assays showed a dose-dependent decrease in cell viability after treating the MCTSs with αMG in the range 0.1÷15 μg/ml for 48 h. The lowest concentrations that caused a significant cell death (20-30%) were 0.1-0.5 μg/ml. The IC50 calculated under these 3D conditions was similar to that obtained using MDA-MB-231 cell monolayers (Table 1). Higher IC50 values were calculated for MCF-7 than MDA-MB-231 cells growing onto plastic flasks up to 48 h (Table 1). A dose-dependent increase in cell apoptosis was also observed using both cell monolayers, reaching significant effects with 15 μg/ml αMG administered for 24 h (Figure 2).
IC50 of MDA-MB-231 and MCF-7 monolayered cells after treatment with αMG
| IC50 [µg/ml] | |||
|---|---|---|---|
| 4 h | 24 h | 48 h | |
| MDA-MB-231 | 1.55 (0.99) | 1.05 (0.99) | 1.03 (0.98) |
| MCF-7 | 2.22 (0.95) | 1.64 (0.98) | 1.60 (0.95) |
IC50 was obtained by the resazurin assay performed on monolayered cells after treatment with 0.1-30 mg/ml αMG (three independent experiments). The numbers in brackets are the corresponding R2 correlation coefficients. A decreasing trend of IC50 was observed from 4 to 48 h of treatment, independently of the cell line used. A greater susceptibility to αMG was shown by MDA-MB-231 cells with respect to MSC-7 cells.
Effect of αMG on the viability of MDA-MB-231 MCTSs. MDA-MB-231 MCTSs were exposed to 0.1-15 μg/ml αMG for 48 h and cell viability was evaluated by measuring (a) resofulvin reduction (two independent experiments) and (b) APH activity (three independent experiments). The corresponding values of IC50 are shown above the bars. A.U.F., arbitrary units of fluorescence. OD, optical density. **p < 0.01 vs untreated spheroids (ctr).

αMG-induced apoptosis of MDA-MB-231 and MCF-7 cells cultured under 2D conditions. The bar graphs show the dose-dependent increase in caspase activity after 24 h of treatment (three independent experiments). Values are expressed as arbitrary units of fluorescence (A.U.F.) emitted by the cleaved substrate. *p < 0.05, **p < 0.01 vs the corresponding control values (ctr).
Zonal distribution of life/dead cells
The distribution of cell viability in MDA-MB-231 spheroids treated with 15 μg/ml αMG for 48 h was assessed by capturing the images obtained using CFDA (green) as a fluorescent vital dye and PI (red) for dead cells (Figure 3). Three sections of each hemispheroid were analysed to obtain the zonal distribution of cell viability. The ratio of the red/green intensity in all three sections of treated MCTSs was higher than in the corresponding regions of the untreated MCTSs and maximal in the middle of the spheroid. A dead (red) region inside the untreated MCTSs was not expected because the mean radius was enough short (see next paragraph) to allow a reliable passage of oxygen and nutrients. However, we cannot exclude that the permeability of plasma membranes could be partially increased in the inner layers of the spheroids allowing PI to enter the cells.
Representative live/dead images of MDA-MB-231 MCTSs exposed to αMG. Three sections of each MCTSs, corresponding to middle (A), intermediate (B), and peripheral (C) regions of a hemispheroid, were analysed to obtain the spatial distribution of viable (green) and dead (red) cells. The intensity of red fluorescence due to PI staining increased from the periphery to the centre of the spheroid, while the CFDA-dependent fluorescence decreased along the same direction. The bar graph shows that the ratio of the red/green intensity was higher in all three sections of the MCTS exposed to 15 μg/ml αMG for 48 h with respect to the corresponding regions of the untreated spheroid.

Changes in volume and cohesion of MCTSs
The mean size of spheroids measured before αMG treatment (time zero, t0) was for (i) MDA-MB-231 MCTSs: radius 0.150 ± 0.040 mm and volume 0.014 ± 0.001 mm3; (ii) MCF-7 MCTSs: radius 0.126 ± 0.002 mm and volume 0.0085 ± 0.0005 mm3 (data not shown). Since the radius of the spheroids did not exceed 0.15 mm, oxygen diffusion through the untreated MCTSs was expected to be adequate [17].
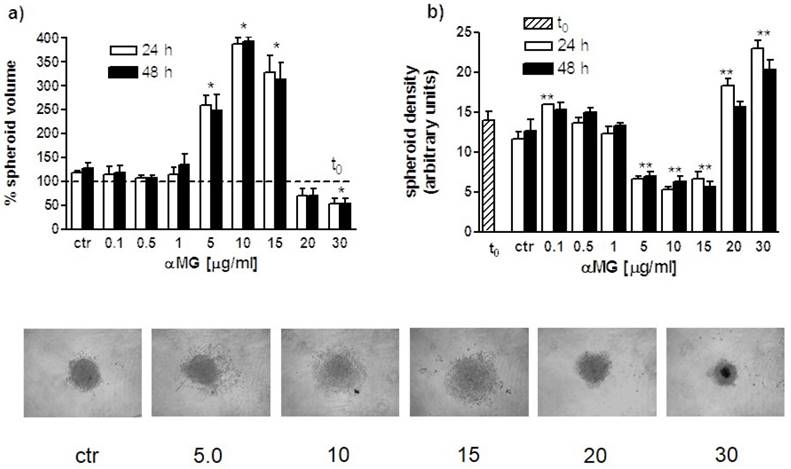
The size of MDA-MB-231 MCTSs was clearly affected by the treatment with αMG (Figure 4). A significant reduction in spheroid volume with respect to control was observed after administration of 30 μg/ml αMG for 24 or 48 h. At this concentration spheroids were smaller and more compact than untreated MCTSs. A consistent modification in volume was also induced by concentrations of αMG in the range of 5-15 μg/ml, but resulting in an increase rather than decrease in size. Using these intermediate doses, a lower cohesion between cells was observed, as attested by the reduction in mean grey density of MCTSs.
Volume and density modifications of MDA-MB-231 MCTSs induced by αMG. (a) The bar graph shows the percent changes of MCTS volumes (three independent experiments) after treatment with αMG for 24 and 48 h (t0 = 100 %). A threefold increase in size was observed in the range of 5-15 μg/ml αMG, irrespective of the duration of treatment, while a significant reduction was obtained using the highest doses of 30 μg/ml. (b) The bar graph represents the corresponding modifications in MCTS adhesiveness due to αMG treatment for 24 and 48 h. It can be noted the opposite trend of spheroid density with respect to volume changes, showing the lowest mean grey values in the range of 5-15 μg/ml αMG and the highest at 20-30 μg/ml. The images at the bottom are representative of MCTSs after treatment with αMG for 48 h. Numbers represent the doses expressed as μg/ml. MCTSs became larger, but less aggregated, after treatment with 5-15 μg/ml αMG with respect to control, while they were smaller and denser in relation to the highest concentrations of αMG. *p < 0.05, **p < 0.01 vs control values of untreated spheroids at the corresponding time (ctr). The asterisk centred above a couple of bars shows that both mean values are significantly different with respect to control.
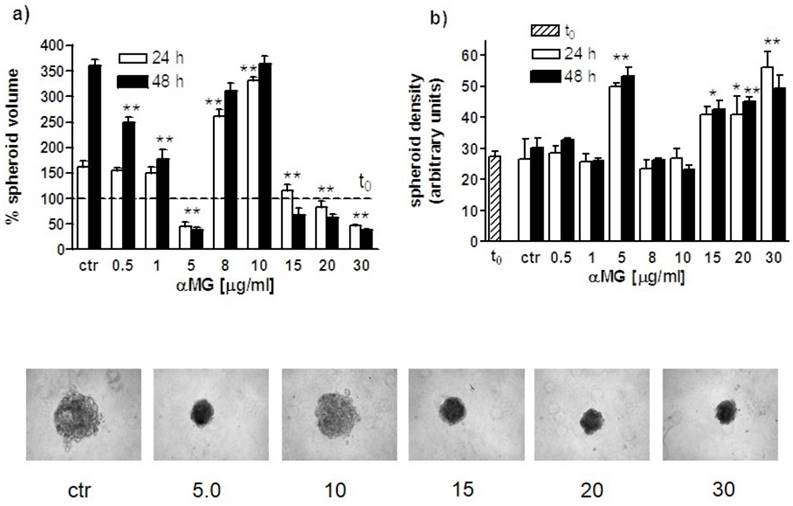
Biphasic effects on spheroid size were also obtained using MCF-7 MCTSs (Figure 5). Indeed, the exposure of 8-10 μg/ml αMG for 24 h led to a twofold increase in volume relative to the corresponding control value. Like MDA-MB-231 MCTSs, MCF-7 spheroids decreased in size and increased in consistence after exposure to the highest doses of αMG (15-30 μg/ml).
Volume and density modifications of MCF-7 MCTSs induced by αMG. (a) Like MDA-MB-231 MCTSs, the treatment with αMG of MCF-7 MCTSs (three independent experiments) led to biphasic size modifications. MCF-7 MCTSs, whose volumes are expressed as percentage relative to t0 (100 %), grew more rapidly than MDA-MB-231 MCTSs. Therefore, at low αMG concentrations up to 1 μg/ml, the volume was greater than the corresponding control value, although it decreased in a dose-dependent manner. The volume was significantly lower than the control at 5 μg/ml αMG. This latter concentration represents the limit over that the MCTSs started to increase in size. In the range of 15-30 μg/ml, αMG MCTSs reduced again their volume. (b) The trend of MCTS density was opposite to volume changes as also shown in the images at the bottom representing spheroids treated for 48 h with increasing doses of αMG (μg/ml). *p < 0.05, **p < 0.01 vs control values of untreated spheroids at the corresponding time (ctr). The asterisk centred above a couple of bars shows that both mean values are significantly different with respect to control.
MDA-MB-231 cell migration
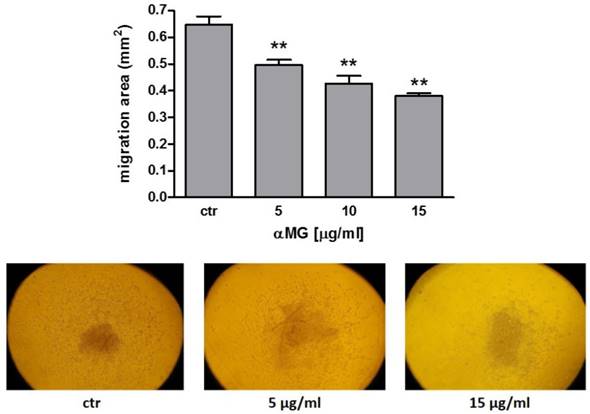
Cells moved toward a radial direction when MDA-MB-231 MCTSs were supported by a layer of gelatine. Dose-dependent concentrations of αMG from 5 μg/ml were effective in reducing cell motility (Figure 6). No cell migration was observed from MCF-7 spheroids (data not shown), because of the lower invasiveness of this breast cancer cells.
Reduction in cell migration from MDA-MB-231 MCTSs induced by αMG. The treatment of MDA-MB-231 MCTSs with αMG was effective in reducing cell motility starting from 5 μg/ml. Cells moved in a radial direction as shown in the representative images. The bar graph shows the dose-dependent reduction in the migration area after 18 h of exposure to αMG (three independent experiments). **p < 0.01 vs control (ctr).
Discussion
The main finding of the present study is the biphasic changes in MCTS size, paralleled by an inverse effect on cell cohesion, due to the treatment with αMG at increasing doses. This condition was particularly evident at concentrations of αMG tenfold higher than the IC50. In order to evaluate whether the changes in MCTS size were sufficient to appreciate the anticancer effect of αMG, both variations in spheroid volume and viability were compared. Both resazurin and APH assays coherently showed that a gradual and constant decrease in vital cells occurred with doses of αMG from 0.1 to 15 μg/ml. We adopted this range of concentrations because was similarly used in other studies focusing on the anti-proliferative effects exerted by αMG against breast cancer cells lines grown on plastic plates [18, 19]. The live/dead fluorescent images of MDA-MB-231 MCTSs treated with 15 μg/ml αMG confirmed that this concentration provokes a damage almost homogeneously distributed in the inner regions of the spheroid. By contrast, lower doses of αMG ranging from 5 to 15 μg/ml caused a significant volume increase in MDA-MB-231 MCTSs, regardless of the duration of the treatment. The discrepancy between the increased volume and the decreased viability of the MCTSs observed under this condition was explained by a parallel reduction in density of the same spheroids. At intermediate doses, αMG provoked a MCTS expansion that was not related to an increase in cell proliferation but to the presence of cells that were not more able to adequately adhere one to each other. The phase-contrast images of the low-density MCTSs showed that the cells were not in tight contact but discretely distanced, maintaining anyway the spheroids an irregular circular shape with additional small ramifications.
The volume of MDA-MB-231 MCTSs began to decrease again at the highest doses of 20-30 μg/ml, hence larger amounts of αMG significantly reduced the development of the spheroids. MCTS density was significantly increased under these conditions and phase-contrast images assumed an intense grey tonality that makes difficult to recognize cell contours. This was probably due to a necrotic process paralleled by cell apoptosis, as suggested by the increased caspase activity observed in cell monolayers treated with high doses of αMG.
MDA-MB-231 MCTSs were compared with spheroids generated by MCF-7 cells, a less aggressive breast cancer cell line [20], in response to αMG treatment. Similarly, MCF-7 spheroids did not show a dose-dependent decrease in size in the overall range of 0.5-30 μg/ml αMG, but only in the windows of 0.5-5 μg/ml and 15-30 μg/ml. Moreover, intermediate concentrations (8-10 μg/ml) produced a volume increase while a greater density was obtained with the highest doses of αMG.
Reduced cell cohesion induced by αMG in MDA-MB-231 MCTSs did not correspond to increased cell motility. Indeed, cell migration from these spheroids was not stimulated by αMG but, on the contrary, was inhibited in a dose-dependent manner. The underlying molecular mechanism seems to be referred to a reduction in NF-kB nuclear translocation which down-regulates MMP2 e MMP9 matrix metalloproteinases (gelatinase) [21]. A parallel inhibition of cell adhesion and migration was similarly described in a study where lycopene, a natural product of tomato, was suggested to reduce the risk of prostate cancer through these specific combined actions [22].
In conclusion, thanks to the combined evaluation of spheroid volume, density and cell migration, a novel anticancer effect of αMG has been demonstrated leading to a reduction in cell adhesion without increasing the metastatic potential. The knowledge of this mechanism can also suggest using αMG together with conventional drugs to increase their penetration into the bulk of solid tumours.
Abbreviations
αMG: α-mangostin; APH: acid phosphatase; b-FGF: basic fibroblast growth factor; CFDA: carboxyfluorescein diacetate; DMEM: Dulbecco's modified Eagle medium; ECACC: The European Collection of Authenticated Cell Culture; EGF: epidermal growth factor; FCS: fetal calf serum; MCTS: multicellular tumour spheroid; PI: propidium iodide; ULA: ultra-low attachment.
Acknowledgements
This study was financially supported by: 1) Fondazione del Monte di Bologna e Ravenna (Italy), “Selective destruction of hypoxic cancer stem cells by bifunctional nanoparticles” and 2) University of Bologna (Italy), “Ricerca Fondamentale Orientata”.
Authors' contributions
G. Scolamiero, C. Pazzini, F. Bonafè: concept/design/acquisition of data, data analysis/interpretation, approval of the article.
C. Guarnieri: critical revision of the manuscript, approval of the article.
C. Muscari (principal investigator): concept/design/acquisition of data, data analysis/interpretation, drafting of the manuscript, critical revision of the manuscript, approval of the article.
Competing Interests
The authors have declared that no competing interest exists.
References
1. Matsumoto K, Akao Y, Kobayashi E. et al. Induction of apoptosis by xanthones from mangosteen in human leukemia cell lines. J Nat Prod. 2003;66:1124-7
2. Zhang KJ, Gu QL, Yang K. et al. Anticarcinogenic effects of α-mangostin: A review. Planta Med. 2017;83:188-202
3. Fatmawati S, Ersam T, Shimizu K. The inhibitory activity of aldose reductase in vitro by constituents of Garcinia mangostana Linn. Phytomedicine. 2014;22:49-51
4. Sakagami Y, Iinuma M, Piyasena KG. et al. Antibacterial activity of alpha-mangostin against vancomycin resistant Enterococci (VRE) and synergism with antibiotics. Phytomedicine. 2005;12:203-8
5. Kurose H, Shibata MA, Iinuma M. et al. Alterations in cell cycle and induction of apoptotic cell death in breast cancer cells treated with α-mangostin extracted from mangosteen pericarp. J Biomed Biotechnol. 2012 doi: 10.1155/2012/672428
6. Li P, Tian W, Ma X. Alpha-mangostin inhibits intracellular fatty acid synthase and induces apoptosis in breast cancer cells. Mol Cancer. 2014;13:138. doi: 10.1186/1476-4598-13-138
7. Kritsanawong S, Innajak S, Imoto M. et al. Antiproliferative and apoptosis induction of α-mangostin in T47D breast cancer cells. Int J Oncol. 2016;48:2155-65
8. Matsumoto K, Akao Y, Yi H. et al. Preferential target is mitochondria in α-mangostin-induced apoptosis in human leukemia HL60 cells. Bioorg Med Chem. 2004;12:5799-806
9. Guo CH, Hsia S, Shih MY. et al. Effects of Selenium Yeast on Oxidative Stress, Growth Inhibition, and Apoptosis in Human Breast Cancer Cells. Int J Med Sci. 2015;12:748-58
10. Suh SS, Yang EJ, Lee SG. et al. Bioactivities of ethanol extract from the Antarctic freshwater microalga, Chloromonas sp. Int J Med Sci. 2017;14:560-9
11. Sutherland RM, MacDonald HR, Howell RL. Multicellular spheroids: a new model target for in vitro studies of immunity to solid tumor allografts. J Natl Cancer Inst. 1977;58:1849-53
12. Zanoni M, Piccinini F, Arienti C. et al. 3D tumor spheroid models for in vitro therapeutic screening: A systematic approach to enhance the biological relevance of data obtained. Sci Rep. 2016;6:19103. doi: 10.1038/srep19103
13. Jamieson LE, Harrison DJ, Campbell CJ. Chemical analysis of multicellular tumour spheroids. Analyst. 2015;21:3910-20
14. Friedrich J, Eder W, Castaneda J. et al. A reliable tool to determine cell viability in complex 3-d culture: The acid phosphatase assay. J Biomol Screen. 2007;12:925-37
15. Muscari C, Bonafé F, Stanic I. et al. Polyamine depletion reduces TNFalpha/MG132-induced apoptosis in bone marrow stromal cells. Stem Cells. 2005;23:983-91
16. Vinci M, Gowan S, Boxall F. et al. Advances in establishment and analysis of three-dimensional tumor spheroid-based functional assays for target validation and drug evaluation. BMC Biol. 2012 doi: 10.1186/1741-7007-10-29
17. Lin RZ, Chang HY. Recent advances in three-dimensional multicellular spheroid culture for biomedical research. Biotechnol J. 2008;3:1172-84
18. Benjakul R, Kongkaneramit L, Sarisuta N. et al. Cytotoxic effect and mechanism inducing cell death of α-mangostin liposomes in various human carcinoma and normal cells. Anticancer Drugs. 2015;26:824-34
19. Lei J, Huo X, Duan W. et al. α-Mangostin inhibits hypoxia-driven ROS-induced PSC activation and pancreatic cancer cell invasion. Cancer Lett. 2014;28:129-38
20. Froehlich K, Haeger JD, Heger J. et al. Generation of multicellular breast cancer tumor spheroids: Comparison of different protocols. J Mammary Gland Biol Neoplasia. 2016;21:89-98
21. Lee YB, Ko KC, Shi MD. et al. alpha-Mangostin, a novel dietary xanthone, suppresses TPA-mediated MMP-2 and MMP-9 expressions through the ERK signaling pathway in MCF-7 human breast adenocarcinoma cells. J Food Sci. 2010;75:H13-23
22. Elgass S, Cooper A, Chopra M. Lycopene treatment of prostate cancer cell lines inhibits adhesion and migration properties of the cells. Int J Med Sci. 2014;11:948-54
Author contact
![]() Corresponding author: Claudio Muscari, Department of Biomedical and Neuromotor Sciences, University of Bologna, Via Irnerio 48, 40126 Bologna, Italy Tel: +39 051 2091245 Fax: +39 051 2091224 e-mail address: claudio.muscariit
Corresponding author: Claudio Muscari, Department of Biomedical and Neuromotor Sciences, University of Bologna, Via Irnerio 48, 40126 Bologna, Italy Tel: +39 051 2091245 Fax: +39 051 2091224 e-mail address: claudio.muscariit