Impact Factor ISSN: 1449-1907

 Global reach, higher impact
Int J Med Sci 2017; 14(9):853-861. doi:10.7150/ijms.19638 This issue Cite
Research Paper
β2 Adrenoceptors are underexpressed in peripheral blood mononuclear cells and associated with a better metabolic profile in central obesity
Fernanda Leite1,2,3, Margarida Lima2,3, Franca Marino4, Marco Cosentino4, Laura Ribeiro1,5,6 ![]()
1. Department of Biomedicine, Faculty of Medicine, University of Porto, Portugal
2. Department of Clinical Haematology, Centro Hospitalar of Porto, Portugal
3. UMIB/ICBAS - Unit for Multidisciplinary Investigation in Biomedicine- Instituto de Ciências Biomédicas Abel Salazar, Porto, Portugal
4. Center of Research in Medical Pharmacology, University of Insubria, Varese, Italy
5. Department of Public Health Sciences, Forensic and Medical Education, Faculty of Medicine, University of Porto, Portugal
6. I3S-Instituto de Investigação e Inovação em Saúde, University of Porto, Portugal
Received 2017-2-13; Accepted 2017-5-17; Published 2017-7-19
Abstract
Background: Central obesity (CO) is an inflammatory disease. Because immune cells and adipocytes are catecholamines(CA)-producing cells, we studied the expression of adrenoceptors (AR) in peripheral blood mononuclear cells (PBMCs) hypothesizing a distinct adrenergic pattern in inflammatory obesity.
Methods: AR expression was assessed in blood donors categorized by waist circumference (WC) (CO: WC≥0.80 m in women and ≥0.94 m in men). Following a pilot study for all AR subtypes, we measured β2AR expression in fifty-seven individuals and correlated this result with anthropometric, metabolic and inflammatory parameters. A ratio (R) between AR mRNA of CO and non-CO<0.5 was considered under and >2.0 over expression.
Results: The pilot study revealed no differences between groups, except for β2AR mRNA. CO individuals showed underexpression of β2AR relatively to those without CO (R=0.08; p=0.009). β2AR expression inversely correlated with triacylglycerol (r=-0.271; p=0.041), very low-density lipoprotein-cholesterol (r=-0.313; p=0.018) and leptin (r=-0.392; p=0.012) and positively with high-density lipoprotein-cholesterol (r=0.310: p=0.045) plasma levels. Multiple logistic regression analysis showed a protective effect of β2AR expression (≥2x10⁻⁶) [odds ratio (OR) 0.177 with respective confidence interval of 95% (95% CI) (0.040- 0.796)] for the occurrence of CO. A higher association was found for women as compared to men (Ξ9:1) [OR 8.972 (95% CI) (1.679-47.949)].
Conclusion: PBMCs β2AR, underexpressed in centrally obese, are associated with a better metabolic profile and showed a protective role for the development of CO. The discovery of β2AR as a new molecular marker of obesity subphenotypes in PBMCs might contribute to clarify the adrenergic immunomodulation of inflammatory obesity.
Keywords: beta2-adrenoceptor, immune cells, central obesity, inflammation, catecholamines.
Introduction
Obesity, notably visceral or central, is a major risk factor for cardiovascular disease (CVD) increasing the incidence of hypertension, type 2 diabetes and dyslipidemia [1] which are linked to reduced life expectancy and premature death.
Central adiposity, as measured by waist circumference (WC), is highly correlated with visceral fat, as measured by computed tomography [2]. Visceral obesity and its comorbidities are characterized by increased concentrations of a large panel of cytokines, chemokines and acute-phase proteins in circulation, which are in turn closely associated with low-grade chronic inflammation, although the pathophysiological mechanisms underlying this association are not completely understood [3].
Remarkably, immune cells, neurons and adipocytes share common signalling pathways. These pathways are mediated by the catecholamines (CA), adrenaline (AD) and noradrenaline (NA), through the activation of adrenoceptors (AR) [4, 5]. There are three major types of AR (α1, α2, β), each of which is further divided into three subtypes. These receptors are involved in essential metabolic and central nervous system functions. There is ample evidence that AR, and more specifically adrenoceptor β2 (β2AR), have a role in immunomodulation. Endogenous CA produced by immune cells regulate, through autocrine/paracrine mechanisms, several immune cell functions [6], modulating inflammatory responses in monocytes and lymphocytes, among other immune cells, during health and disease [5, 6]. The global outcome of β2AR triggering in inflammation seems to be beneficial [6].
In obesity, visceral adipose tissue (AT) becomes infiltrated by a large number of immune cells, namely, macrophages [7] and lymphocytes [8]. Most of these originate from circulating peripheral blood mononuclear cells (PBMCs) [9]. These cells seem to possess the full cellular machinery for de novo synthesis, release, and inactivation of CA [6] and are referred as potential sources of biomarkers of early homeostatic imbalance that would be useful for the study and prevention of metabolic disorders as obesity [10]. Recent studies have reported that adipocytes are likewise capable of CA de novo synthesis suggesting a role of adipocyte CA in metabolic processes [11]. Our group demonstrated that CA release is differently affected by dietary unsaturated fatty acids [12].
Adrenergic modulation of immunity remains a non-appreciated issue in obesity. We recently described for the first time that tyrosine hydroxylase, the rate limiting step of CA synthesis, and dopamine receptors in PBMCs are underexpressed in central obesity (CO) [13]. We hypothesize that the adrenergic signature is distinct under these conditions, because AD and NA, important metabolic and immune regulators, may mediate inflammatory obesity.
In the present study, we looked for the expression of AR in circulatory immune cells and its correlation with anthropometric, endocrine/metabolic and inflammatory parameters in a well-defined group of blood donors (BD) to establish: i) whether central obesity, a surrogate marker of abdominal fat mass [14], is associated with variable AR expression in PBMCs and ii) the extent to which this association is explained by anthropometric/metabolic/endocrine/inflammatory factors.
This study may give rise to new therapeutic interventions to manage inflammatory central obesity and its co-morbidities.
Methods
Participants and experimental design
This study was conducted in 57 blood donors from the Blood Bank of Clinical Haematology Department of Centro Hospitalar of Porto (CHP), Portugal; it meets the standards of the Declaration of Helsinki in its revised version of 1975 and its amendments of 1983, 1989, and 1996 [JAMA 1997;277:925-926], and was approved by the Ethical Committee and Research Office, and authorized by the administration board of CHP, being registered with the identifier 072/09 (047-DEFI/065-CES). All participants signed a written informed consent, after being aware about the objectives of the study and the confidentiality of the data. The individuals met the selection criteria for blood donation and were not under any medicines during the previous month. Systolic blood pressure (SBP) and diastolic blood pressure (DBP) were measured twice and the mean values were calculated. The total sample was studied for anthropometric, metabolic/endocrine and inflammatory parameters and PBMCs AR expression. The characteristics of the enrolled subjects are shown in Table 1.
Characteristics of the study participants (n=57)
| Parameter | Unit | Reference values (range) | mean± SEM/* | Min-Max |
|---|---|---|---|---|
| Age | years | 40±2 | 20-63 | |
| Weight | Kg | 77±2 | 51-120 | |
| Height | m | 1.67±0.01 | 1.50-1.87 | |
| BMI | Kgm-2 | 27.6±0.6 | 19.6-40.1 | |
| WC | m | 0.97±0.02 | 0.75-1.24 | |
| SBP | mmHg | <130 | 134±2 | 103-177 |
| DBP | mmHg | <85 | 80±1 | 61-107 |
| Glycemia | mg/dL | 70 - 105 | 85±1 | 67-115 |
| HbA1c | % | 3.8 - 5.6 | 5.2±0.1 | 4.5-5.8 |
| TC | mg/dL | 0 - 200 | 194±5 | 117-283 |
| LDL-C | mg/dL | 0 - 130 | 123±4 | 60-209 |
| HDL-C | mg/dL | 35 - 55 | 50±2 | 25-91 |
| VLDL-C | mg/dL | 3 - 56 | 21±2 | 6-58 |
| TAG | mg/dL | 40 - 160 | 109±10 | 32-475 |
| hsCRP* | mg/L | < 1.0 low risk 1.0 <3.0 intermediate risk >3.0 high risk | 1.38 (0.66- 3.01) | 0.0-17.8 |
| Noradrenaline* | pmoL/L | 709 - 4019 | 684 (395-1552) | 40-3760 |
| Adrenaline* | pmoL/L | <328 | 151 (81-225) | 55-473 |
| Cortisol* | μg/dL | 6.2 - 19.4 | 15.0 (12.6-17.3) | 6.4-28.4 |
| Leptin* | ng/mL | 2.0 - 5.6 | 0.615 (0.245-1.075) | 0.003-5.300 |
| Leucocytes | cells/μL | 4500 - 13000 | 6432±216 | 3500-11600 |
| Monocytes | cells/μL | 400 - 500 | 440±22 | 82-964 |
| Lymphocytes* | cells/μL | 1000-4800 | 1898 (1538-2299) | 1007-5069 |
BMI, Body Mass Index; WC, waist circumference; SBP, systolic blood pressure; DBP, diastolic blood pressure; HbA1c, glycosylated hemoglobin; TC, total cholesterol; LDL-C, low-density lipoprotein cholesterol; HDL-C, high-density lipoprotein-cholesterol; VLDL-C, very low-density lipoprotein-cholesterol; TAG, triacylglycerol; hsCRP, high-sensitivity C reactive protein; Min, minimum; Max, maximum. Data are presented as mean ± standard error of the mean (SEM), unless otherwise indicated by * corresponding to data presented as median, 25th and 75th percentiles.
Anthropometrics
Body mass index (BMI) was calculated by dividing weight by squared height, expressed in kg.m-2. BMI categories were defined according to the guidelines of the World Health Organization [15]. WC was measured at the level midway between the lowest rib and the iliac crest. Height (in m) was confirmed by medical record. The participants, all Caucasians, were divided in two groups, according to the International Diabetes Federation criteria of CO defined as WC ≥0.80 m in women and ≥0.94 m in men [16].
Biochemical analysis
Blood samples were taken from all subjects under standardized conditions. Fasting plasma glucose, triacylglycerol (TAG), total cholesterol (TC), high-density lipoprotein-cholesterol (HDL-C), low-density lipoprotein-cholesterol (LDL-C), and very low-density lipoprotein-cholesterol (VLDL-C), were measured with turbidometry and spectrophotometry methodology using the Cobas® 8000 autoanalyzer (Roche, Rotkreuz, Switzerland). Glycosylated hemoglobin (HbA1c) measurements were done by High Performance Liquid Chromatography (HPLC), using the Hi-Auto A1c HA-8140 HPLC (Menarini Diagnostics, Florence, Italy). Plasma cortisol was performed with an electrochemiluminescence immunoassay (Elecsys Systems analyser Roche, Roche Diagnostics International Ltd Rotkreuz, Switzerland) and leptin was measured in serum by solid phase two-site enzyme immunoassay (Merecodia Leptin ELISA, Mercodia AB, Sylveniusgatan 8A, Uppsala, Sweden). High-sensitivity C-reactive protein (hsCRP) (mg/L) determined by nephelometry (CardioPhase® hsCRP-BnProSpec SiemensHealthcare Diagnostics Inc. New York, United States) was categorized by the following cardiovascular event risk groups: <1- low, ≥1 to <3 -intermediate and above 3 - high risk, as described before [17].
Assay of monocytes by Flow Cytometry
Monocytes from fresh EDTA-K3 anti-coagulated whole blood samples were determined by means of flow cytometry, as previously described [18]. Immunophenotypic studies were performed using a whole blood stain-lyse-and-then-wash method and a direct immunofluorescence technique with the following four-color panel of monoclonal antibodies: mouse anti-human CD36 conjugated with FITC (clone FA6.152, IgG1), mouse anti-human CD16 conjugated with PE (clone 3G8, IgG1), mouse anti-human CD14 conjugated with PE-Cy5 (IgG2a, clone RMO52) all obtained from Beckman Coulter (catalogue numbers IM0766U, IM1238U and IM2640U, respectively), and mouse anti-human CD11b conjugated with APC (IgG2a, clone D12) obtained from Becton Dickinson (BD) (catalogue number 333143).
Data acquisition was carried out on a FACS-Calibur flow cytometer (BD), using the Cell Quest software program (BD). A minimum of 2x10⁵ events were used for each staining and stored as list mode data. The Paint-a-Gate Pro software program (BD) was used for data analysis. Monocytes were quantified based on CD14 expression. CD16 was used to differentiate classical (CD16-) and non-classical (“pro-inflammatory”) (CD16+) monocyte populations. The median fluorescence intensity (MFI) of CD14, CD36 and CD11b was assessed in each subset and expressed as fluorescence arbitrary units (AU). The forward light scatter (FSC) and sideward light scatter (SSC) of cell subsets were also determined. To overcome inter-individual variations and maturation process, in each subject, the ratio for each parameter between CD14+CD16+ non-classical monocytes and CD14+CD16- classical monocytes was calculated.
Expression of AR in PBMCs by Real time PCR
Peripheral blood mononuclear cells were isolated by density gradient centrifugation (Ficoll method), as previously described [19]. Total RNA was extracted by PerfectPure™ RNA Cell & Tissue kit (5Prime), and the amount of extracted RNA was estimated by spectrophotometry at 260 nm. Total RNA was reverse transcribed using the High-capacity cDNA Archive Kit (Applied Biosystems, Foster City, USA), according to the manufacturer's instructions. Real-time PCR was performed with an ABI prism 7000 apparatus (Applied Biosystems) using the Assay on demand kits for the genes of interest (Applied Biosystems), according to the manufacturer's instructions. Gene sequence data were obtained from the Reference Sequence collection (RefSeq; www.ncbi.nlm.nih.gov/projects/RefSeq). For each gene, the thermal profile was as follows: stage 1, 2 min at 50°C; stage 2, 10 min at 95°C; stage 3, 40 cycles including 15s at 95°C and 1 min at 60°C. Table 2 contains the details about real-time PCR conditions.
Real-time PCR gene expression
| Gene Symbol | UniGene ID | Interrogated Sequence RefSeq/GenBank mRNA | Translated protein | Exon boundary RefSeq/GenBank mRNA | Assay location RefSeq/GenBank mRNA | Amplicon length | Annealing temperature (°C) | Efficiency (%) |
|---|---|---|---|---|---|---|---|---|
| α1A-AR | Hs. 709175 | NM_033302.2 | NP_150645.2 | 1-2 | 1324 | 112 | 60 | 99.98 |
| α1B-AR | Hs. 368632 | NM_000679.3 | NP_000670.1 | 1-2 | 1126 | 61 | 60 | 100.04 |
| α1D-AR | Hs. 557 | NM_000678.3 | NP_000669.1 | 1-2 | 1166 | 68 | 60 | 100.08 |
| α2A-AR | Hs. 249159 | NM_000681.3 | NP_000672.3 | 1-1 | 1960 | 116 | 60 | 101.00 |
| α2B-AR | Hs. 247686 | NM_000682.5 | NP_000673.2 | 1-1 | 823 | 117 | 60 | 100.05 |
| α2C-AR | Hs. 123022 | NM_000683.3 | NP_000674.2 | 1-1 | 646 | 93 | 60 | 99.08 |
| β1-AR | Hs. 99913 | NM_000684.2 | NP_000675.1 | 1-1 | 863 | 79 | 60 | 99.00 |
| β2-AR | Hs. 2551 | NM_000024.5 | NP_000015.1 | 1-1 | 778 | 65 | 60 | 100.02 |
| β3-AR | Hs. 2549 | NM_000025.2 | NP_000016.1 | 1-2 | 1401 | 65 | 60 | 99.87 |
| 18S rRNA | X03205.1 | N.A. | N.A. | N.A. | N.A. | 187 | 60 | 98.80 |
Linearity of real-time PCR assays were tested by constructing standard curves by use of serial 2-fold dilutions of a standard calibrator cDNA and regression coefficients (r2) were always >0.900 (data not shown). Relative expression was determined by normalization to 18S rRNA (housekeeping gene) by means of AB Prism 7000 SDS software™. Gene expression levels in a given sample were represented as 2-∆Ct where ∆Ct = [Ct(gene)-Ct (18S rRNA)].
We performed a pilot study of all AR subtypes expression in 15 individuals divided in two groups: with and without CO, representing the lowest and the highest BMI of the total sample in order to know which AR subtype(s) showed the highest differences between the opposite fat groups (in Table 3). The ratio (R) was calculated between AR mRNA expression between individuals with and without CO. R <0.5 was considered under and >2.0 over expression. Our technical variance in that set of experiments is 0.03 cycles² for all adrenoceptor gene expression (so the standard deviation, SD is 0.17 cycles); also consider that we measure samples in triplicates, so standard error (SE) for the mean ct is SE = sqrt (0.03/3) = sqrta (0.01). By error propagation, the SE of a mean difference (delta-ct) is sqrt (2*0.01) and the SE for a difference of such differences (delta-delta-ct) is sqrt (2*2*0.01) = sqrt (0.04) = 0.2. This SE is determined on 2*(3-1) = 4 degrees of freedom, so the 95% confidence interval has a half width of t[0.025;4]*0.2 = 2.77*0.2 = 0.554 or roughly half cycle. The total width of the interval is thus 1 cycle. This means that a 2-fold difference (Δct=1) is considerably larger than the 95% CI obtained without any biological variance when 3 replicates are measured. For this reason, only differences exceeding 1 cycle were thereafter considered.
Pilot study on peripheral blood mononuclear cells adrenoceptor mRNA expression
| Central obesity | Ratio Yes/No | ||
|---|---|---|---|
| No | Yes | ||
| n | 5 | 10 | |
| F/M | 2/3 | 8/2 | |
| Age | 31 ± 3 | 40 ± 3 | |
| BMI | 21.1 ± 0.7 | 30.1 ± 2.4 | |
| AR subtype | |||
| α1A | 6.95 x 10⁻⁹ ± 1.45 x 10⁻⁹ | 6.87 x 10⁻⁹ ± 4.63 x 10⁻¹⁰ | 0.99 |
| α1B | 1.11 x 10⁻⁷ ± 2.02 x 10⁻⁸ | 1.56 x 10⁻⁷ ± 3.66 x 10⁻⁸ | 1.41 |
| α1D | 7.76 x 10⁻⁶ ± 2.09 x 10⁻⁶ | 1.1 x 10⁻⁵ ± 2.21 x 10⁻⁶ | 1.42 |
| α2A | 3.72 x 10⁻⁹ ± 2.89 x 10⁻⁹ | 5.74 x 10⁻⁹ ± 1.47 x 10⁻⁹ | 1.54 |
| α2B | not detected | not detected | |
| α2C | 4.39 x 10⁻⁹ ± 6.76 x 10⁻¹⁰ | 4.57 x 10⁻⁹ ± 3.69 x 10⁻¹⁰ | 1.04 |
| β1 | not detected | not detected | |
| β2 | 7.54 x 10⁻⁵ ± 5.98 x 10⁻⁵ | 3.14 x 10⁻⁵ ± 1.84 x 10⁻⁵ | 0.42 |
| β3 | 2.56 x 10⁻⁸ ± 5.51 x 10⁻⁹ | 2.13 x 10⁻⁸ ± 5.51 x 10⁻⁹ | 0.83 |
Analysis of AR mRNA expression in peripheral blood mononuclear cells in a subgroup of subjects without and with central obesity selected as those having highest or lowest BMI values. Data are presented as mean ± standard error of the mean (SEM). F/M, female male ratio; BMI, body mass index; AR, adrenoceptor. For details see Methods.
Statistical analysis
The modified Kolmogorov-Smirnov test with the correction of Lilliefors was used to evaluate the fit of the data to a normal distribution. Unless otherwise indicated, variables were presented using relative and absolute frequencies, means ± standard error of the mean (SEM). Non-normal distributed data was presented as median, 25th and 75th percentiles. To compare the quantitative independent variables, we used bivariate statistical analysis ANOVA or non-parametric tests Mann-Whitney (comparison between 2 groups) or Kruskal-Wallis (comparison of more than 2 groups) tests for normal and non-normal distributed data, respectively. The Pearson Chi-Square test was used to compare qualitative independent variables. Correlations were assessed by Pearson test to determine the relationship between normal distributed quantitative variables and by non-parametric Spearman rank analysis for non-normal distributed quantitative data. The strength of association between variables was estimated by odds ratio (OR) and their respective confidence interval of 95% (95% CI) using multiple logistic regression. Variables that in the univariate analysis showed statistical significance below 10% (p <0.10) were included in the logistic regression model. Data analysis was performed using the SPSS version 22.0 (SPSS, Chicago, IL, USA). P-value lower than 0.05 was considered statistically significant.
Results
Characteristics of the study participants
The BD, with mean age of 40 years (minimum 20 and maximum 63), showed a prevalence of CO of 71.9%. Twenty-five individuals were female (44%) with a higher percentage of CO compared with men, respectively 92 % vs 59% (p=0.006). The total group presented a median hsCRP level, reflecting an intermediate cardiovascular risk, low median plasma leptin levels and mean SBP values of systolic hypertension. The other metabolic/endocrine parameters were within the normal range (Table 1).
Anthropometric and metabolic/endocrine parameters
The CO group showed higher leptin, TC and VLDL-C values in comparison with the group without CO (Table 4). WC was correlated with leptin (r=0.524; p=0.001), VLDL-C (r=0.391, p=0.003) and TAG (r=0.319, p=0.016) plasma levels. In CO, as well in all population, WC was correlated with SBP [(r=0.495, p=0.001); (r=0.385, p=0.003), respectively] and with DBP [(0.477, p=0.001); (r=0.493, p<0.001), respectively]. In both total and CO groups, AD was associated with VLDL-C [(r=0.336, p=0.011); (r=0.455, p=0.002), respectively] and with TAG plasma levels [(r=0.323, p=0.014); (r=0.428, p=0.005), respectively], and in CO was found to be inversely correlated with HDL-C (r=-0.346; p=0.025).In both total and CO groups, we also found significant correlations between NA and TC [(r=0.277, p=0.037); (r=0.344, p=0.026), respectively] and with LDL-C [(r=0.301, p=0.023); (r=0.354, p=0.022), respectively].
Comparison of anthropometric, metabolic/endocrine parameters between groups with and without central obesity (n=57)
| Factor | F | df | Mean ± S.E.M. | p | |
|---|---|---|---|---|---|
| CO | No CO | ||||
| F/M (n) | 8.596 | 1, 55 | 23/19* | 2/13* | 0.006 |
| Age (years) | 8.640 | 1, 55 | 42 ± 2 | 37 ± 3 | 0.194 |
| Weight (Kg) | 3.077 | 1, 55 | 79 ± 2 | 72 ± 3 | 0.085 |
| Height (m) | 5.699 | 1, 55 | 1.65 ± 0.01 | 1.71 ± 0.01 | 0.020 |
| BMI (Kgm-2) | 14.126 | 1, 55 | 28.7 ± 0.6 | 24.4 ± 0.7 | <0.001 |
| WC (m) | 26.869 | 1, 55 | 1.00 ± 0.016 | 0.86 ± 0.016 | <0.001 |
| SBP (mmHg) | 0.000 | 1, 55 | 134 ± 2 | 134 ± 4 | 0.983 |
| DBP (mmHg) | 2.606 | 1, 55 | 82 ± 2 | 77 ± 2 | 0.112 |
| Glycemia (mg/dL) | 0.114 | 1, 55 | 85 ± 1 | 86 ± 1 | 0.737 |
| HgA1c (%) | 1.386 | 1,55 | 5.1 ± 0.1 | 5.2 ± 0 | 0.244 |
| TC (mg/dL) | 4.131 | 1, 55 | 200 ± 5 | 178 ± 9 | 0.047 |
| LDL-C (mg/dL) | 2.420 | 1, 55 | 127 ± 5 | 112 ± 8 | 0.126 |
| HDL-C (mg/dL) | 0.065 | 1, 55 | 50± 2 | 51 ± 4 | 0.800 |
| VLDL-C (mg/dL) | 4.596 | 1, 55 | 23 ± 2 | 16 ± 2 | 0.036 |
| TAG (mg/dL) | 3.726 | 1, 55 | 120 ± 12 | 79 ± 8 | 0.059 |
| NA (pmol/L) | 2.136 | 1, 55 | 1054 ± 129 | 706± 168 | 0.150 |
| AD (pmol/L) | 0.198 | 1, 55 | 167 ± 15 | 181 ± 30 | 0.658 |
| Cortisol (μg/dL) | 0.024 | 1, 55 | 15 ± 0.9 | 15 ± 1.0 | 0.877 |
| Leptin (ng/mL) | 8.116 | 1, 38 | 1.30 ± 0.25 | 0.15 ± 0.05 | 0.007 |
CO, central obesity; BMI, body mass index; WC, waist circumference; SBP, systolic blood pressure; DBP, diastolic blood pressure; HbA1c, glycated haemoglobin; TAG, triacylglycerol; TC, total cholesterol; HDL-C, high-density lipoprotein-cholesterol; LDL-C, low-density lipoprotein-cholesterol; VLDL-C, very low-density lipoprotein-cholesterol; NA, noradrenaline; AD, adrenaline. F/M, female/male ratio; F, Snedcor's distribution; df, degrees of freedom; p, level of significance. *Pearson Chi-Square test was applied for the comparison of two categorical variables. Data are presented as mean ± standard error of the mean (SEM).
Monocytes subsets and hsCRP
The total sample showed a mean of 440±22 monocytes/µL (7.1 ± 0.4% of total leucocytes), of which 390 ± 19 cells/µL (89 ± 0.9% of all monocytes) were CD16- and 50 ± 7 cells/µL were CD16+ monocytes (11± 0.9% of all monocytes). Neither the number (Table 5) nor the percentage of CD16+ (11.5±0.9% vs 9.9±1.9%; p=0.410) and of CD16- monocytes (89±0.9% vs 90±1.9%; p=0.408) were different between groups with and without CO, respectively. However, the ratio between non-classical CD16+ and classical CD16- monocytes, calculated to overcome inter-individual variations, showed differences between these two groups. In particular, centrally obese showed lower CD14 and SSC ratios comparatively to non-CO subjects, reflecting a more inflammatory phenotype pattern of non-classical monocytes (Table 5). Despite hsCRP plasma levels were similar between CO and non-CO groups, in centrally obese hsCRP was correlated with leptin values (r=0.397, p=0.011). In addition, plasma levels of leptin were significantly different when comparing the hsCRP cardiovascular risk groups (p=0.011): high risk group [3.100 (0.800-5.170) mg/L] showed higher levels of leptin relatively to the intermediate [0.615 (0.480- 1.140) mg/L] and to the low risk groups [0.320 (0.100- 0.850) mg/L]. The number of CD16+ monocytes was correlated with hsCRP (r=0.372; p=0.005) and with NA plasmatic level (r=0.341; p=0.01).
Comparison of inflammatory markers hsCRP and monocyte subsets (counting and phenotype) between groups with and without central obesity (n=57)
| No CO | CO | |||||
|---|---|---|---|---|---|---|
| F | df | Mean ± SEM/ * | Mean ± SEM/ * | p | ||
| hsCRP* (mg/L) | - | - | 0.757 (0.469-2.090) | 1.530 (0.764-3.560) | 0.160 | |
| Monocytes subsets | ||||||
| cells/μL | CD16+ | 0.055 | 1, 54 | 53±18 | 49±6 | 0.816 |
| CD16- | 1.747 | 1, 54 | 431±38 | 375±21 | 0.192 | |
| Ratio number | 0.404 | 1, 54 | 0.12±0.03 | 0.13±0.01 | 0.528 | |
| FSC | CD16+ | 0.227 | 1, 54 | 547±17 | 556±10 | 0.636 |
| CD16- | 0.080 | 1, 54 | 549±17 | 554±10 | 0.778 | |
| Ratio FSC | 0.833 | 1, 54 | 1±0.01 | 1±0.01 | 0.365 | |
| SSC | CD16+ | 3.998 | 1, 54 | 431±16 | 400±8 | 0.051 |
| CD16- | 0.371 | 1, 54 | 485±13 | 477±7 | 0.545 | |
| Ratio SSC | 9.684 | 1, 54 | 0.89±0.01 | 0.84±0.01 | 0.003 | |
| CD14 | CD16+ | 0.285 | 1, 50 | 968±167 | 867±93 | 0.596 |
| CD16- | 1.292 | 1, 53 | 1865±326 | 2423±264 | 0.261 | |
| Ratio CD14 | 8.974 | 1, 54 | 0.50±0.05 | 0.36±0.02 | 0.004 | |
| CD36 | CD16+ | 0.108 | 1, 54 | 327±52 | 313±18 | 0.743 |
| CD16- | 2.330 | 1, 54 | 670±68 | 765±28 | 0.133 | |
| Ratio CD36 | 3.826 | 1, 54 | 0.50±0.04 | 0.42±0.02 | 0.056 | |
| CD11b | CD16+ | 0.000 | 1, 24 | 80±30 | 81±18 | 0.996 |
| CD16- | 0.621 | 1, 24 | 125±48 | 241±78 | 0.438 | |
| Ratio CD11b | 2.311 | 1, 24 | 0.69±0.07 | 0.51±0.06 | 0.141 | |
CO, central obesity; FSC, forward scatter; SSC, side scatter; Values of CD14, CD36 and CD11b expressed as fluorescence arbitrary units (AU); Ratio SSC, ratio between side scatter (SSC) of CD16+monocytes and SSC of CD16- monocytes in each individual; Ratio CD1, ratio between the expression of CD14 on CD16+monocytes and the expression of CD14 on CD16- monocytes in each individual; Ratio CD11b, ratio between the expression of CD11b on CD16+monocytes and the expression of CD11b on CD16- monocytes in each individual; Data are presented as mean ± standard error of the mean (SEM); F Snedcor's distribution; df degrees of freedom; p level of significance. * Data presented as median (25th-75th percentiles) and Mann-Whitney test used for comparison between the two groups.
AR expression in PBMCs
The pilot study considered PBMCs expression of all the 9 AR in a subgroup of subjects with and without CO selected as those having the highest or the lowest BMI values (Table 3). Results from the pilot study revealed that there were no differences between groups except for β2AR mRNA levels. Indeed, the expression of β2AR in subjects with CO was less than half in comparison to those without CO. This finding led us to study β2AR expression in a large number of subjects.
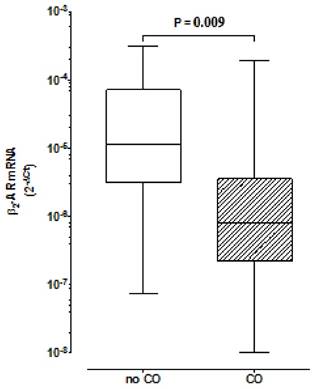
We have found lower expression of β2AR in the CO group in comparison to the group without CO (R=0.08; p=0.009) (Fig. 1). In the CO model, the logistic regression analysis demonstrated a lower association for the development of CO for β2AR mRNA expression ≥2x10⁻⁶[OR 0.177 with respective confidence interval of 95% (95% CI) (0.040- 0.796)] and a higher association for women, relatively to men [≅9:1[OR 8.972 (95% CI) (1.679-47.949)]].
Comparison of β2 Adrenoceptors expression in peripheral blood mononuclear cells between groups with and without central obesity. Boxes indicate medians with 25th-75th percentiles and whiskers indicate minimum and maximum values. Mann-Whitney test was used for comparison between the two groups. CO, Central Obesity; non- CO, without CO; P, level of significance.
To evaluate the clinical relevance of decreased expression of β2AR, we correlated β2AR mRNA levels with metabolic/endocrine parameters. When considering all the individuals, the expression of β2AR in PBMCs inversely correlated with VLDL-C (r=-0.313; p=0.018), TAG (r=-0.271; p=0.041) and leptin (r=-0.392; p=0.012), whereas in CO it was correlated with plasmatic HDL-C (r=0.310: p=0.045). After adjusting for gender, β2AR mRNA correlated with HDL-C (r=0.298: p=0.026) and inversely with VLDL-C (r=-0.361; p=0.006) and TAG plasmatic levels (r=-0.311; p=0.020).
Discussion
Our study addressed for the first time the expression of adrenoceptors in PBMCs in inflammatory obesity. The main findings are fourfold. Firstly, PBMCs from CO individuals showed underexpression of β2AR in comparison to non-CO subjects. Secondly, CO individuals showed higher TC, VLDL-C and leptin plasma levels and a higher inflammatory pattern of monocytes relatively to non-CO subjects. Thirdly, β2AR expression was inversely correlated with a dyslipidaemic lipid profile and with leptin plasma levels. And the fourth is that the multiple logistic regression analysis showed a lower and higher association, respectively for β2AR expression (≥2x10⁻⁶) and female for the occurrence of CO.
β2ARs are the most expressed AR on immune cells and considered the main mediators of CA immune effects; their activation usually results in anti-inflammatory effects [6, 20, 21]. Indeed, stimulation of β2AR modulates cytokine production by activated innate immune cells, primarily inhibiting proinflammatory cytokines, such as TNF-α, IL-12 and IL-6, and by increasing IL-10 and IL-33 release by these cells [22- 24].
The PBMCs underexpression of β2AR in CO may have resulted, through mechanisms as desensitization and down-regulation, from the action of circulating or endogenously produced CA, leptin and other cytokines and lipids. Indeed, apart from circulating CA, with similar values in subjects with and without CO, several of these molecules are elevated in this condition [25]. Our findings are in line with a decreased number of β2AR in PBMCs in inflammatory immune mediated diseases such as systemic lupus erythematosus [26], multiple sclerosis [27], rheumatoid arthritis (RA) [26], juvenile RA [28], Crohn's disease [29] and myasthenia gravis [30]. Critical heart disease, a chronic low-intensity inflammation condition, was also associated with reduced β-AR on lymphocytes due to a non-regulated increased release of proinflammatory cytokines [31].
An important point for discussion is whether the altered pattern of β2AR and monocytes observed in an early phase of CO is a cause or consequence of inflammatory obesity. Further studies are needed to elucidate this association. Nonetheless, some findings support a role of circulating leptin and lipids in the association between visceral fat and PBMC β2AR expression: a) centrally obese present higher plasma levels of leptin, TC and VLDL-C and a more inflammatory pattern of monocytes comparing to those without CO and b) β2AR expression inversely correlated with plasma TAG, VLDL-C and leptin and positively with HDL-C plasma levels.
Cellular lipid homeostasis can indeed influence the level and function of immune cells [32]. Remarkably, Devêvre et al. (2015) [33] recently described that HDL-C negatively correlated with molecules involved in chemotaxis, proposing that decreased HDL could therefore be directly linked to changes in monocyte phenotype and function. This is consistent with our findings, since in centrally obese HDL-C levels were positively related with β2AR mRNA and inversely with AD. On the other hand, NA, an independent factor for the development of metabolic syndrome [34], correlated not only with TC and LDL-C, but also with the number of “pro-inflammatory monocytes” and hsCRP, findings that corroborate a putative role in inflammation [35].
β2ARs have been pointed out as a promising target in the pharmacotherapy of Multiple Sclerosis (MS) [36]. In MS patients, β2AR expression in lymphocytes increases after treatment with beta-interferon [37]. It would be interesting to see if during weight loss there is an increase of β2AR expression in immune cells.
Down regulation of AR-mRNA may also occur as a result of the effects of inflammatory cytokines produced by immune cells in response to fatty acids binding to toll-like receptor 4 (TLR 4) [38].
Leptin, besides its main role in metabolism, is also an immune mediator, promoting the activation, chemotaxis and survival of both innate and adaptive immune cells [39]. As stated before, β2AR mRNA inversely correlated with leptin plasma levels, and leptin receptors, found in monocytes and lymphocytes [40] mediate the production of proinflammatory cytokines by these cells [39]. Interestingly, a deficiency of leptin receptor has been described as leading to a decreased expression of proinflammatory cytokines as tumour necrosis factor α (TNF-α), interleukin 6 (IL-6) and C-C motif chemokine ligand 2 (CCL2) and decreased infiltration of macrophages [41]. In centrally obese, leptin plasma values were also correlated with the hsCRP, also synthesized by adipocytes [42] and likewise described as able to affect β2AR function [43].
As previously highlighted [44], because intra-abdominal fat is not readily available for clinical assessment, and AT-infiltrating immune cells are originated from bone marrow, circulatory immune cells could serve as markers of intra-abdominal fat inflammation and ultimately of obesity associated cardio-metabolic risk. The present work identifies one more molecular marker of obesity subphenotypes and contributes to the continued search necessary for their better definition.
β2AR underexpression could be considered as a molecular signature of PBMC in obese patients. Indeed, modified mRNA expression of several genes involved in cytokines production, chemotaxis, fatty acid storage and glucose metabolism and pathogen recognition, was already related to monocyte function in obesity [33].
Our hypothesis is that proinflammatory monocytes (here also characterized by low cellular complexity (low SSC) and CD14 ratios [13] and underexpressing β2AR) of centrally obese would sense metabolic/inflammatory circulating factors. In response, these cells secrete more inflammatory cytokines and are probable more prone to migrate into AT where they could differentiate into macrophages. Both processes perpetuate a vicious cycle of inflammatory cell recruitment and secretion of deleterious adipokines and free fatty acids by AT that predispose to metabolic dysfunction.
The current study has some limitations that merit comment. β2AR expression was evaluated in PBMCs as a population. In future studies, it would be valuable to investigate possible differential expression on distinct mononuclear cell subsets (e.g. lymphocytes vs monocytes, T helper (TH) 1 vs Th2, regulatory T cells vs Th17). Furthermore, we only studied mRNA levels of β2AR and it would be relevant to also measure its protein level. Even though, Guereshi et al. (2013) [45] found that β2AR mRNA levels were higher in naıve T cells than in Treg cells and protein expression confirmed the results for β2AR transcripts. Our group also showed in human lymphocytes that dopaminergic receptors responsiveness is better predicted by mRNA rather than membrane receptor expression [46].
Conclusion
Association of CO with a higher activation of innate immune response and a lower β2-adrenoceptor expression suggests that circulating peripheral mononuclear immune cells sense inflammatory obesity, with β2AR expression being less associated with the occurrence of CO.
An important challenge now is to understand how this receptor functions on PBMCs in inflammation related to obesity before we can truly apply this knowledge in a rational manner in clinical conditions. In this sense, evaluation of β2-AR agonists as potential anti-inflammatory drugs is strongly warranted. Functional studies should be also planned in the near future to determine the migratory and inflammatory functions of these circulatory cells.
Acknowledgements
The authors are grateful to Massimiliano Legnaro (Center of Research in Medical Pharmacology, University of Insubria) for his skilful technical assistance in performing the real-time PCR experiments, to Ana Santos (Department of Clinical Haematology, Centro Hospitalar of Porto, Portugal) for performing the flow cytometry assays and to
Joselina Barbosa (Department of Medical Education and Simulation, Faculty of Medicine, University of Porto, Portugal) for her help in data statistical analysis.
Funding
This work was supported by FCT funding UID/BIM/04293/2013 and Pest-OE/SAU/UI0215/2014-Unidade Multidisciplinar de Investigação Biomédica-UMIB/ICBAS/UP.
Ethics approval and consent to participate
This work was approved by the Ethical Committee of Centro Hospitalar do Porto (Porto, Portugal). All participants signed their written informed consent as described in the study protocol approved by the Ethics committee. The clinical study is registered at local research department with the identifier 072/09 (047-DEFI/065-CES).
Competing interest
The authors declare that they have no competing interests.
References
1. Neeland IJ, Ayers CR, Rohatgi AK, Turer AT, Berry JD, Das SR, Vega GL, Khera A, McGuire DK, Grundy SM. Associations of visceral and abdominal subcutaneous adipose tissue with markers of cardiac and metabolic risk in obese adults. Obesity (Silver Spring). 2013;21(9):E439-E47
2. Enzi G, Gasparo M, Biondetti PR, Fiore D, Semisa M, Zurlo F. Subcutaneous and visceral fat distribution according to sex, age, and overweight, evaluated by computed tomography. Am J Clin Nutr. 1986;44(6):739-46
3. Xu H, Barnes GT, Yang Q, Tan G, Yang D, Chou CJ, Sole J, Nichols A, Ross JS, Tartaglia LA. Chronic inflammation in fat plays a crucial role in the development of obesity-related insulin resistance. J Clin Invest. 2003;112(12):1821-30
4. Lafontan M. Historical perspectives in fat cell biology: the fat cell as a model for the investigation of hormonal and metabolic pathways. Am J Physiol Cell Physiol. 2012;302(2):C327-C59
5. Flierl MA, Rittirsch D, Huber-Lang M, Sarma JV, Ward PA. Catecholamines-Crafty Weapons in the Inflammatory Arsenal of Immune/Inflammatory Cells or Opening Pandora's Box §?. Mol Med. 2008:14
6. Marino F, Cosentino M. Adrenergic modulation of immune cells: an update. Amino Acids. 2013;45(1):55-71
7. Weisberg SP, McCann D, Desai M, Rosenbaum M, Leibel RL, Ferrante AW. Obesity is associated with macrophage accumulation in adipose tissue. J Clin Invest. 2003;112(12):1796-808
8. Travers R, Motta A, Betts J, Bouloumié A, Thompson D. The impact of adiposity on adipose tissue-resident lymphocyte activation in humans. Int J Obes. 2015;39(5):762-9
9. Bories G, Caiazzo R, Derudas B, Copin C, Raverdy V, Pigeyre M, Pattou F, Staels B, Chinetti-Gbaguidi G. Impaired alternative macrophage differentiation of peripheral blood mononuclear cells from obese subjects. Diab Vasc Dis Res. 2012;9(3):189-95
10. Oliver P, Reynés B, Caimari A, Palou A. Peripheral blood mononuclear cells: a potential source of homeostatic imbalance markers associated with obesity development. Pflugers Arch, EJP. 2013;465(4):459-68
11. Kvetnansky R, Ukropec J, Laukova M, Manz B, Pacak K, Vargovic P. Stress stimulates production of catecholamines in rat adipocytes. Cell Mol Neurobiol. 2012;32(5):801-13
12. Gomes A, Correia G, Coelho M, Araújo JR, Pinho MJ, Teixeira AL, Medeiros R, Ribeiro L. Dietary unsaturated fatty acids differently affect catecholamine handling by adrenal chromaffin cells. J Nutr Biochem. 2015;26(5):563-70
13. Leite F, Lima M, Marino F, Cosentino M, Ribeiro L. Dopaminergic Receptors and Tyrosine Hydroxylase Expression in Peripheral Blood Mononuclear Cells: A Distinct Pattern in Central Obesity. PLoS ONE. 2016;11(1):e0147483
14. Klein S, Allison D, Heymsfield S, Kelley D, Leibel R, Nonas C, Kahn R. Association for Weight Management and Obesity Prevention; NAASO, The Obesity Society; American Society for Nutrition; American Diabetes Association. Waist circumference and cardiometabolic risk: a consensus statement from Shaping America\'s Health: Association for Weight Management and Obesity Prevention; NAASO, The Obesity Society; the American Society for Nutrition; and the American Diabetes Association. Am J Clin Nutr. 2007;85:1197-202
15. Ng M, Fleming T, Robinson M, Thomson B, Graetz N, Margono C, Mullany EC, Biryukov S, Abbafati C, Abera SF. Global, regional, and national prevalence of overweight and obesity in children and adults during 1980-2013: a systematic analysis for the Global Burden of Disease Study 2013. Lancet. 2014;384(9945):766-81
16. Alberti KGM, Zimmet P, Shaw J, Group IETFC. The metabolic syndrome—a new worldwide definition. Lancet. 2005;366(9491):1059-62
17. Pearson TA, Mensah GA, Alexander RW, Anderson JL, Cannon RO, Criqui M, Fadl YY, Fortmann SP, Hong Y, Myers GL. Markers of inflammation and cardiovascular disease application to clinical and public health practice: a statement for healthcare professionals from the centers for disease control and prevention and the American Heart Association. Circulation. 2003;107(3):499-511
18. Lima M, Almeida J, Montero AG, dos Anjos Teixeira M, Queirós ML, Santos AH, Balanzategui A, Estevinho A, del Cármen Algueró M, Barcena P. Clinicobiological, immunophenotypic, and molecular characteristics of monoclonal CD56-/+ dim chronic natural killer cell large granular lymphocytosis. Am J Pathol. 2004;165(4):1117-27
19. Cosentino M, Marino F, Bombelli R, Ferrari M, Rasini E, Lecchini S, Frigo G. Stimulation with phytohaemagglutinin induces the synthesis of catecholamines in human peripheral blood mononuclear cells: role of protein kinase C and contribution of intracellular calcium. J Neuroimmunol. 2002;125(1):125-33
20. Takenaka MC, Araujo LP, Maricato JT, Nascimento VM, Guereschi MG, Rezende RM, Quintana FJ, Basso AS. Norepinephrine Controls Effector T Cell Differentiation through β2-Adrenergic Receptor-Mediated Inhibition of NF-κB and AP-1 in Dendritic Cells. J Immunol. 2016;196(2):637-644
21. Dimitrov S, Hulteng E, Hong S. Inflammation and exercise: Inhibition of monocytic intracellular TNF production by acute exercise via β2-adrenergic activation. Brain Behav Immun. 2016 pii: S0889-1591(16)30564-5
22. Yanagawa YM, Matsumoto M, Togashi H. Adrenoceptor-mediated enhancement of interleukin-33 production by dendritic cells. Brain Behav Immun. 2011;25(7):1427-1433
23. Hervé J, Dubreil L, Tardif V, Terme M, Pogu S, Anegon I, Rozec B, Gauthier C, Bach JM, Blancou P. β2-Adrenoreceptor agonist inhibits antigen cross-presentation by dendritic cells. J Immunol. 2013;190(7):3163-3171
24. Haskó G, Elenkov IJ, Kvetan V, Vizi ES. Differential effect of selective block of alpha 2-adrenoreceptors on plasma levels of tumour necrosis factor-alpha, interleukin-6 and corticosterone induced by bacterial lipopolysaccharide in mice. J Endocrinol. 1995;144(3):457-462
25. Rani V, Deep G, Singh RK, Palle K, Yadav UC. Oxidative stress and metabolic disorders: Pathogenesis and therapeutic strategies. Life Sci. 2016;148:183-93
26. Baerwald C, Graefe C, Muhl C, Von Wichert P, Krause A. Beta 2-adrenergic receptors on peripheral blood mononuclear cells in patients with rheumatic diseases. Eur J Clin Invest. 1992;22:42-6
27. Cosentino M, Marino F. Adrenergic and dopaminergic modulation of immunity in multiple sclerosis: teaching old drugs new tricks? J Neuroimmune Pharmacol. 2013;8(1):163-79
28. Levite M. Nerve-driven Immunity: Neurotransmitters and neuropeptides in the immune system. 1st ed: Springer Science & Business Media. 2012 pp 47-96
29. Straub R, Wiest R, Strauch U, Härle P, Schölmerich J. The role of the sympathetic nervous system in intestinal inflammation. Gut. 2006;55(11):1640-9
30. Xu B-y, Yi Q, Pirskanen R, Matell G, Eng H, Lefvert AK. Decreased β 2-adrenergic receptor density on peripheral blood mononuclear cells in myasthenia gravis. J Autoimmun. 1997;10(4):401-6
31. Werner C, Werdan K, Pönicke K, Brodde O-E. Impaired β-adrenergic control of immune function in patients with chronic heart failure: reversal by β1-blocker treatment. Basic Res Cardiol. 2001;96(3):290-8
32. Getz GS, Reardon CA. The mutual interplay of lipid metabolism and the cells of the immune system in relation to atherosclerosis. J Clin Lipidol. 2014;9(6):657-71
33. Devêvre EF, Renovato-Martins M, Clément K, Sautès-Fridman C, Cremer I, Poitou C. Profiling of the three circulating monocyte subpopulations in human obesity. J Immunol. 2015;194(8):3917-23
34. Pergola G, Giorgino F, Benigno R, Guida P, Giorgino R. Independent influence of insulin, catecholamines, and thyroid hormones on metabolic syndrome. Obesity (Silver Spring). 2008;16(11):2405-11
35. Slota C, Shi A, Chen G, Bevans M, Weng N-p. Norepinephrine preferentially modulates memory CD8 T cell function inducing inflammatory cytokine production and reducing proliferation in response to activation. Brain Behav Immun. 2015;46:168-79
36. Makhlouf K, Weiner HL, Khoury SJ. Potential of beta2-adrenoceptor agonists as add-on therapy for multiple sclerosis: focus on salbutamol (albuterol). CNS Drugs. 2002;16(1):1-8 PubMed PMID: 11772115. Epub 2002/01/05. eng
37. Zaffaroni M, Marino F, Bombelli R, Rasini E, Monti M, Ferrari M, Ghezzi A, Comi G, Lecchini S, Cosentino M. Therapy with interferon-β modulates endogenous catecholamines in lymphocytes of patients with multiple sclerosis. Exp Neurol. 2008;214(2):315-21
38. Kau AL, Ahern PP, Griffin NW, Goodman AL, Gordon JI. Human nutrition, the gut microbiome and the immune system. Nature. 2011;474(7351):327-36
39. Fernández-Riejos P, Najib S, Santos-Alvarez J, Martín-Romero C, Pérez-Pérez A, González-Yanes C, Sánchez-Margalet V. Role of leptin in the activation of immune cells. Mediators Inflamm. 2010
40. Sanchez-Margalet V, Martin-Romero C, Santos-Alvarez J, Goberna R, Najib S, Gonzalez-Yanes C. Role of leptin as an immunomodulator of blood mononuclear cells: mechanisms of action. Clin Exp Immunol. 2003;133(1):11-9
41. Dib LH, Ortega MT, Fleming SD, Chapes SK, Melgarejo T. Bone marrow leptin signaling mediates obesity-associated adipose tissue inflammation in male mice. Endocrinology. 2013;155(1):40-6
42. Meijer K, de Vries M, Al-Lahham S, Bruinenberg M, Weening D, Dijkstra M, Kloosterhuis N, van der Leij RJ, van der Want H, Kroesen B-J. Human primary adipocytes exhibit immune cell function: adipocytes prime inflammation independent of macrophages. PLoS ONE. 2011;6(3):e17154
43. Euteneuer F, Mills PJ, Rief W, Ziegler MG, Dimsdale JE. Association of in vivo beta-adrenergic receptor sensitivity with inflammatory markers in healthy subjects. Psychosom Med. 2012;74(3):271
44. Pecht T, Gutman-Tirosh A, Bashan N, Rudich A. Peripheral blood leucocyte subclasses as potential biomarkers of adipose tissue inflammation and obesity subphenotypes in humans. Obes Rev. 2014;15(4):322-37
45. Guereschi MG, Araujo LP, Maricato JT, Takenaka MC, Nascimento VM, Vivanco BC, Reis VO, Keller AC, Brum PC, Basso AS. Beta2-adrenergic receptor signaling in CD4+ Foxp3+ regulatory T cells enhances their suppressive function in a PKA-dependent manner. Eur J Immunol. 2013;43(4):1001-12
46. Cosentino M, Fietta AM, Ferrari M, Rasini E, Bombelli R, Carcano E, Saporiti F, Meloni F, Marino F, Lecchini S. Human CD4+ CD25+ regulatory T cells selectively express tyrosine hydroxylase and contain endogenous catecholamines subserving an autocrine/paracrine inhibitory functional loop. Blood. 2007;109(2):632-42
Author contact
![]() Corresponding author: Laura Ribeiro, Department of Biomedicine, Faculty of Medicine, University of Porto, Alameda Prof. Hernâni Monteiro, 4200-319, Porto, Portugal. Phone/ Fax: +351 22 5513624. E-mail address: lribeiroup.pt
Corresponding author: Laura Ribeiro, Department of Biomedicine, Faculty of Medicine, University of Porto, Alameda Prof. Hernâni Monteiro, 4200-319, Porto, Portugal. Phone/ Fax: +351 22 5513624. E-mail address: lribeiroup.pt