Impact Factor ISSN: 1449-1907
- Issue 9; 2026
- Issue 8; 2026
- Issue 7; 2026
- Issue 6; 2026
- Issue 5; 2026
- Volume 23; 2026
- Past Issues
- Editorial Board
- Cover Images
- Index & Coverage
- Cover Suggestion
- Special Issues
Introduction
Material and Methods
Results
Discussion
Conclusion
Abbreviations
Acknowledgements
References

 Global reach, higher impact
Int J Med Sci 2017; 14(6):543-553. doi:10.7150/ijms.18988 This issue Cite
Research Paper
Existence of a Strong Correlation of Biomarkers and miRNA in Females with Metabolic Syndrome and Obesity in a Population of West Virginia
Perrine Goguet-Rubio1*, Rebecca L. Klug2*, Dana L. Sharma1, Krithika Srikanthan1, Nitin Puri3, Vishal H Lakhani1, Alexandra Nichols1, Kathleen M. O'Hanlon4, Nader G. Abraham5, Joseph I. Shapiro1, Komal Sodhi2 ![]()
1. Department of Internal Medicine, Joan C. Edwards School of Medicine, Marshall University, Huntington, WV, USA;
2. Department of Surgery, Joan C. Edwards School of Medicine, Marshall University, Huntington, WV, USA;
3. Department of Physiology & Pharmacology, University of Toledo College of Medicine, Toledo OH, USA;
4. Department of Family Medicine, Joan C. Edwards School of Medicine, Marshall University, Huntington, WV, USA;
5. Department of Pharmacology and Medicine, New York Medical College, The Touro College and University System, Valhalla, NY, USA.
* Both authors contributed equally
Received 2016-12-30; Accepted 2017-3-29; Published 2017-4-19
Abstract
Objectives: Metabolic syndrome causes complications like cardiovascular disease and type 2 diabetes mellitus (T2DM). As metabolic syndrome develops, altered levels of cytokines and microRNAs (miRNA) are measurable in the circulation. We aimed to construct a panel detecting abnormal levels of cytokines and miRNAs in patients at risk for metabolic syndrome. Methods: Participants included 54 patients from a Family Medicine Clinic at Marshall University School of Medicine, in groups of: Control, Obese, and Metabolic Syndrome (MetS). Results: Serum levels of leptin, adiponectin, leptin: adiponectin ratio, IL-6, six miRNAs (320a, 197-3p, 23-3p, 221-3p, 27a-3p, and 130a-3p), were measured. Among the three groups, leptin, and leptin: adiponectin ratio, and IL-6 levels were highest in MetS, and levels in Obese were greater than Control (p>0.05). Adiponectin levels were lower in Obese compared to Control, but lowest in MetS (p<0.05). MiRNAs levels were lowest in MetS, and levels in Obese were lower than Control (p>0.05). Conclusion: Our results support the clinical application of biomarkers in diagnosing early stage MetS, which will enable attenuation of disease progression before onset of irreversible complications. Since West Virginians are high-risk for developing MetS, our biomarker panel could reduce the disease burden on our population.
Keywords: metabolic syndrome, microRNA, serum biomarkers, West Virginia.
Introduction
Adults in West Virginia have the highest prevalence of T2DM and hypertension in the US and are the second most obese state in the country [1]. As these conditions are associated with MetS, we conjecture that among adults, West Virginia has a high prevalence of this disease. MetS manifests as an aggregate of disorders including hypertension, central obesity, hyperglycemia, dyslipidemia, and insulin resistance. The nature of MetS is multi-factorial; delineating mechanisms of the pathogenesis is a complex and unfinished task [2]. As a chronic disorder, MetS progresses discretely until potentially devastating complications arise [3-6]. Medical expenses of patients with MetS are higher than those without MetS with a 20% increase in cost for every additional component of MetS [7, 8]. Due to the indolent nature of MetS, the financial burden and the healthcare disparities, populations like those in West Virginia suffer a significant disease burden. Along with comprehensive community based programs for disease management, prevention, and early intervention are vital components for combatting this disease [9]. Since this profoundly impacts our population, it is vital to determine a method that reduces MetS and associated complications [2].
From a literature review, we extrapolated biomarkers suitable for inclusion in a panel for MetS detection [2]. Leptin is found at increased levels in patients with MetS and specifically with abdominal obesity, and insulin resistance [10] [11-13]. Increased adiponectin levels improve insulin sensitivity, vasodilation, and lipid oxidation, while protecting against atherogenesis [14-16]. Levels are low in people at risk for developing T2DM, hypertension, and obesity [17, 18]. The leptin to adiponectin (LAR) ratio overcomes the limit that exists in the values of adiponectin and leptin during the fasting versus postprandial state [19]. MetS induces an inflammatory state, increasing levels of the pro-inflammatory cytokines, such as IL-6. IL-6 levels correlate with elements of MetS, MetS alone, and the severity of MetS [20-22].
MiRNAs are small single-stranded RNA molecules that alter gene expression by preventing translation; this happens after transcription coding messenger RNA is modified or silenced by miRNA [23, 24]. MiRNAs are transported into the circulation and function in various pathways such as metabolism [23, 25, 26]. A dysregulated metabolic process is caused by abnormally functioning miRNAs and is implicated in the development of CVD, MetS, and T2DM [23]. The use of miRNAs for clinical testing of disease is applicable since numerous studies conclude that a statistically significant variance exists between the control groups and people with metabolic disease. As reported in the literature, we selected miRNAs that correlated with components of MetS for the panel in our study. MiRNAs: 320a, 197-3p, 23-3p, 221-3p, 27a-3p, and 130a-3p exhibit altered levels correlating with pathophysiological components of MetS [24, 25, 27-32]. Levels of miR-320a, miR-27a-3p, miR-130a-3p, miR-23-a and miR-221 vary in the circulation of patients with MetS [25, 30, 33]. Studies revealed that levels of miR-130a-3p, miR-221, miR-197, and miR-23-a, corresponded to states of obesity [25, 30, 33]. Circulating levels of miR-23-a, miR-197, miR-27a-3p, and miR-130a-3p vary in the circulation of patients with hypertension [25, 30, 33]. Previous studies demonstrated the existence of a relationship between varied blood glucose levels and miR-320a miR-197 [25, 30, 33]. In patients with known insulin resistance miR-130a-3p and miR-320a tend to exhibit variation in circulating levels [24, 25, 30]. MiRNAs appear to be useful for pre-clinical diagnosis, since they are more sensitive and specific for early diagnosis, risk assessment and monitoring disease progression [24]. MiRNAs exhibit remarkable stability under harsh conditions such as: pH, temperature, storage, and multiple freeze-thaw cycles [24, 31].
A panel of biomarkers used to diagnose MetS in the early stage, allows for prevention of debilitating conditions that accompany MetS [34]. In this study we measured serum biomarkers and miRNA associated with MetS. We studied a group of adult females in West Virginia with normal BMI, obesity and a diagnosis of MetS. Our objectives for this study included: detecting circulating levels of biomarkers associated with MetS in patients at risk for developing this disease and developing a biomarker panel providing early detection, risk assessment and monitoring of MetS. A biomarker panel for MetS, with the potential for prevention and early intervention, could greatly impact populations at high risk for the disease, such as the people of West Virginia [2].
Material and Methods
Patients
A total of 54 adult females, visiting the Family Medicine Clinic at Marshall University School of Medicine, were enrolled in this study and each signed an informed consent. The patients were grouped into categories based on BMI and MetS diagnosis: 1. Control group with a BMI <30; 2. Obese group with a BMI ≥30 and no clinical diagnosis of MetS, and 3. MetS, patients carrying a clinical diagnosis of MetS. Patients with malignancy, trauma or age under 18 or over 45, were excluded from this study. Trained personnel followed a standard protocol to measure the height, weight, waist circumference (midway from the lowest rib to the iliac crest to the nearest 0.1 cm), and blood pressure of each patient. BMI was calculated for the individual by dividing weight (kg) by the square of height (m). The Ethics Committee of the Cabell Huntington Hospital, West Virginia approved this study.
Blood Samples
Study patients had venous blood drawn from an antecubital vein in EDTA tubes after fasting for at least 8 hours. The blood obtained was intended to acquire levels of inflammatory cytokines, miRNA, blood glucose levels, and lipid panels. Blood samples were processed by spinning blood at 3000 rpm for 10 minutes at 4ºC. Serum for cytokine and miRNA analysis was frozen at -80ºC prior to analysis. The laboratory, at Cabell-Huntington Hospital, analyzed blood for glucose levels and lipid panels; these values were obtained from the patient chart.
Biomarker Quantification
Enzyme-linked immunosorbent assays (ELISA) were used to determine levels of leptin (EMD Millipore Corporation, Billerica, MA), HMW adiponectin (Abcam plc, Cambridge, UK), IL-6 (R&D Systems, Inc., Minneapolis, MN). All protocols provided by the manufacturer were followed for each ELISA kit.
Extraction of miRNA
We performed RNA extraction using the miRNeasy SerumPlasma Kit (Qiagen, Hilden, Germany) according to the manufacturer's instructions. 1 ml of QIAzol reagent was added to 200 ml of serum sample. The samples were vortexed in a tube, followed by the addition of 200 µl of chloroform. After mixing vigorously, the samples were then centrifuged at 12,000 g for 15 min at 4°C. The upper aqueous phase was transferred to a new collection tube, and 900 µl of absolute ethanol was added. The samples were then applied directly to columns and washed. Total RNA was eluted in 14 µl of nuclease-free H2O. The quality and quantity of RNA were evaluated by 260:280 ratio using NanoDrop analyzer (Thermo Scientific). For RT reaction, we used the miRCURY LNA Universal RT microRNA PCR Kit (Exiqon, Vedbaek, Denmark). Each RT reaction used 50 ng of total RNA. Total RNA was combined with 4 µl of 5x reaction buffer, 9 µl of nuclease-free water, 2 µl of enzyme mix and 0.5 µl of synthetic spike-in to a final volume of 20 µl. The RT-PCR was set as follows incubated at 42°C for 1 h, heat-inactivated at 95°C for 5 min and immediately cooled to 4°C. The expression levels of miRNA in serum samples were studied with a SYBR-based quantitative PCR using a miRNA specific primer and ExiLENT SYBR Green Master mix (Exiqon). To normalize the miRNA expression the internal control, the synthetic spike-in, was used. The expression levels of miRNA were then assessed by real-time quantitative PCR (qRT-PCR) according to the manufacturer's instructions. A 4 µl aliquot of 40x diluted cDNA template was combined with 5 µl of SYBR green master mix and 1 µl of PCR primer mix to a final volume of 10 µl. Two technical replicates per sample were used for qRT-PCR amplification run on a 7500 Fast Real-Time PCR Systems (Applied Biosystems). The sequence of miRNAs are listed below.
Sequence of miRNAs.
| miRNA | sequence |
|---|---|
| hsa-miR-320a | AAAAGCUGGGUUGAGAGGGCGA |
| hsa-miR-197-3p | UUCACCACCUUCUCCACCCAGC |
| hsa-miR-23-3p | AUCACAUUGCCAGGGAUUUCC |
| hsa-miR-221-3p | AGCUACAUUGUCUGCUGGGUUUC |
| hsa-miR-27a-3p | UUCACAGUGGCUAAGUUCCGC |
| hsa-miR-130a-3p | CAGUGCAAUGUUAAAAGGGCAU |
Statistical Analysis
Data analysis was performed using GraphPad Prism 4.0. Within each of the three patient categories, Bartlett's test was applied for each biomarker to guarantee equal variance. For each biomarker, differences of statistical significance were identified in the average serum levels using ANOVA. Specification of the patient groups that showed statistically significant variances for the biomarker measured was achieved using the Turkey post-hoc test.
Results
In the clinic, 54 patients were recruited into the study and placed in one of three groups: individuals with a normal BMI and no MetS (n=24), obese individuals with no clinical diagnosis of MetS (n=17) and obese individuals with a clinical diagnosis of MetS (n=16). All participants were adults and female. There was no difference between the groups in the mean age ratio. Adult females with MetS showed significant differences in clinical markers compared to those without MetS. Additionally, obese adult females and adult females with MetS showed significant differences in the cytokines and miRNA associated with MetS compared to the Control patients.
Clincial markers of MetS
As shown in table 1, Systolic blood pressure was significantly elevated in Obese and MetS patients compared to Control (p<0.01). Fasting blood glucose and triglycerides were significantly elevated in patients with MetS only (p<0.01). HDL was decreased in the MetS group (p<0.01). These are the variables included in the IDF definition of MetS and are used to make the clinical diagnosis of MetS [5].
Patient Demographic and Clinical Profile.
| Groups | Number of Patients | Age (yrs.) | BMI (kg/m2) | FBS (mg/dL) | SBP (mmHg) | DBP(mmHg) | TG (mg/dL) | HDL (mg/dL) |
|---|---|---|---|---|---|---|---|---|
| Control | 24 | 33.29 (±1.4) | 23.30 (±0.7) | 88.05 (±1.5) | 111.73 (±2.4) | 69.86 (±2.1) | 94 (±7.2) | 62.84 (±2.9) |
| Obese | 17 | 38.5 (±2.3) | 43.57 (±2.95) | 87.83 (±2.2) | 130.58 (±4.2)* | 77.76 (±3.1) | 81.5 (±7.2) | 66.67 (±2.9) |
| MetS | 16 | 38.5 (±2.2) | 48.5 (±3.73) | 111.62 (±7.2)* # | 136.3 (±4.9)* | 85.75 (±1.5)* | 141.86 (±9.4)* # | 43.4 (±1.8)* # |
Values represent means ± SEM. *p<0.01 vs. Control, # p<0.01 vs. Obese. Body mass index (BMI), Fasting blood sugar (FBS), Systolic blood pressure (SBP), Diastolic blood pressure (DBP), Triglyceride (TG), High density lipoprotein (HDL) in Control, Obese and MetS patients.
Serum cytokine biomarkers
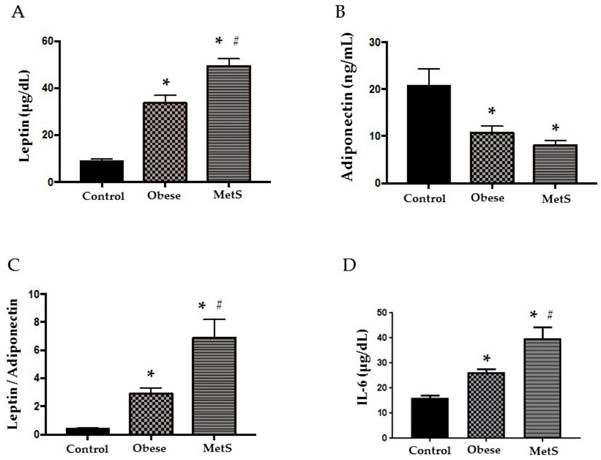
Adipokines, leptin and adiponectin, are bioactive substances released by adipocytes that control appetite, promote effective glucose use, and enhance insulin sensitivity. As adipocytes accumulate in obesity, these cytokines become dysregulated initiating MetS [2]. Compared to the Control group, leptin was significantly elevated in the Obese group and even more so in the MetS group (p<0.05), figure 1 (A). Adiponectin was significantly decreased in the Obese group and more so in the MetS group compared to the Control (p<0.05) figure 1 (B). Obese patients showed significantly higher LAR to Control and LAR in the MetS group was the highest of the three groups (p<0.05) figure 1 (C). The dysregulated adipokines of MetS induce an inflammatory response and release of pro-inflammatory cytokines such as IL-6 into the circulation [2]. Our results show that IL-6 was significantly highest in the MetS group and the Obese group had higher levels of IL-6 compared to Control (p<0.05) figure 1 (D).
Cytokines. Assay of serum concentrations of (A) Leptin, (B) Adiponectin, (C) Leptin: Adiponectin Ratio, (D) IL-6 in Control (n=24), Obese (n=17), and MetS (n=16), patient groups. Values represent means ± SEM. *p<0.01 vs. Control; # p<0.01 vs. Obese.
Circulating miRNA biomarkers
Altered function and variable circulating levels of miRNAs, regulators of genetic expression, correlate with MetS and its components [25]. All six miRNAs analyzed in the circulation of these patients followed a similar statistically significant pattern. The following miRNAs: 320a, 197-3p, 23-3p, 221-3p, 27a-3p, and 130a-3p exhibit dysregulated activity in the setting of MetS resulting in variable levels [24, 25, 27-32]. Each miRNA studied showed greatest decrease in the circulation of the MetS group but was also decreased in the obese group compared to the Control (p<0.05); results depicted in figure 2 and 3 (A-C respectively).
Circulating miRNAs. Assay of serum concentrations of circulating (A) miR-320a, (B) miR-197-3p, and (C) miR-23-3p in Control (n=24), Obese (n=17), and MetS (n=16), patient groups. Values represent means ± SEM. *p<0.01 vs. Control; # p<0.01 vs. Obese.
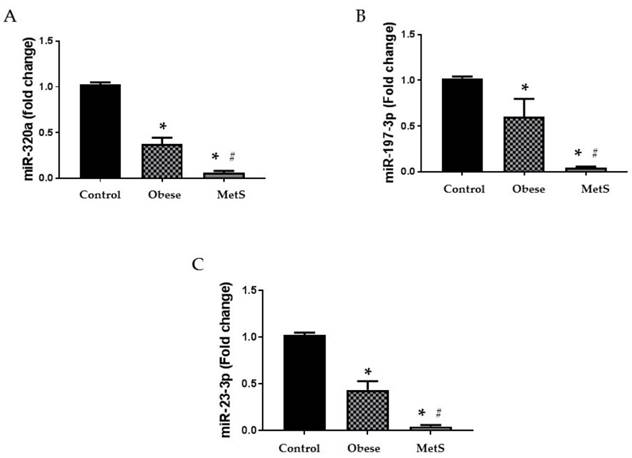
Circulating miRNAs. Assay of serum concentrations of circulating (A) miR-221-3p, (B) miR-27a-3p, and (C) miR-130a-3p Control (n=24), Obese (n=17), and MetS (n=16), patient groups. Values represent means ± SEM. *p<0.01 vs. Control; # p<0.01 vs. Obese.
Comparing clinical markers and serum biomarkers
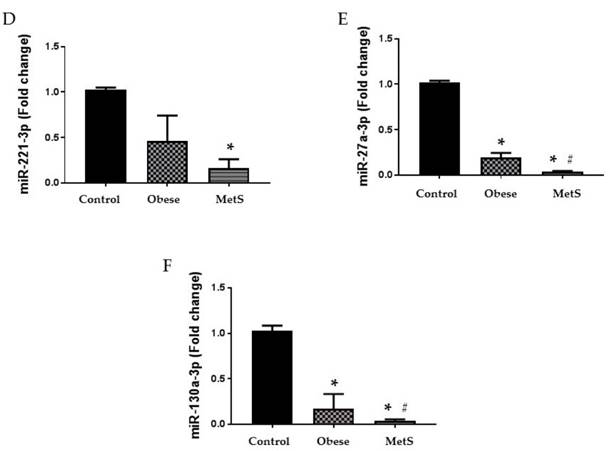
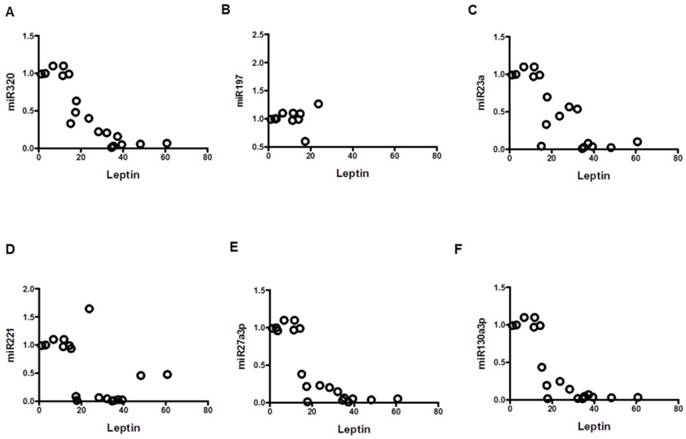
Mean clinical values, mean values of serum cytokine biomarkers and serum miRNAs were compared in table 2. Among the Obese group, mean values of systolic blood pressure, leptin, LAR, IL-6 were significantly elevated compared to Control (p<0.01). Levels of adiponectin and miRNAs: 320a, 197-3p, 23-3p, 27a-3p, 130a-3p, were significantly decreased in the Obese group when compared to Control (p<0.01). Among the MetS group, mean values of fasting blood sugar, systolic and diastolic blood pressure, triglycerides, leptin, LAR, IL-6 were significantly elevated compared to Control (p<0.01). Levels of HDL, adiponectin, and miRNAs: 320a, 197-3p, 23-3p, 221-3p, 27a-3p, 130a-3p, were significantly decreased in the MetS group when compared to Control (p<0.01). Among the MetS group, mean values of fasting blood sugar, triglycerides, leptin, LAR, IL-6 were significantly elevated compared to Obese (p<0.01). Levels of HDL and miRNAs: 320a, 197-3p, 23-3p, 27a-3p, 130a-3p, were significantly decreased in the MetS group when compared to Obese (p<0.01). The correlation between the mean values of serum cytokine biomarkers and serum miRNA from all three groups were depicted in scatterplots in figures 4-6. Adiponectin, leptin, and IL-6 values were compared to each miRNA individually in figures 4 (A-F), 5 (A-F), and 6 (A-F) respectively.
Comparing clincal markers and serum biomarkers and miRNAs

Comparing mean clinical values associated with metabolic syndrome with mean serum biomarkers and serum miRNAs mean values from three groups: Control (n=24), Obese (n=17), and MetS (n=16), patient groups. Values represent means ± SEM. *p<0.01 vs. Control, # p<0.01 vs. Obese. Body mass index (BMI), Fasting blood sugar (FBS), Systolic blood pressure (SBP), Diastolic blood pressure (DBP), Triglyceride (TG), High density lipoprotein (HDL) in Control, Obese, and MetS patients.
Correlation of adiponectin with miRNAs; mean values from three groups. Control (n=24), Obese (n=17), and MetS (n=16), patient groups. (A) Correlation to miR320 (r=0.55; p<0.05), (B) miR197 (r=0.477; p<0.05) (C) miR23a (r=0.51; p<0.05), (D) miR221 (r=0.46; p<0.05)), (E) miR2713p (r=0.54; p<0.01)), and (F) miR130a3p (r=0.54; p<0.01)).
Correlation of leptin with miRNAs; mean values from three groups. Control (n=24), Obese (n=17), and MetS (n=16), patient groups. (A) Correlation to miR320 (r= -0.86; p<0.01), (B) miR197 (r= -0.79; p<0.01) (C) miR23a (r= -0.79; p<0.01), (D) miR221 (r= -0.54; p<0.01)), (E) miR2713p (r= -0.80; p<0.01)), and (F) miR130a3p (r= -0.79; p<0.01)).
Correlation of IL-6 with miRNAs; mean values from three groups. Control (n=24), Obese (n=17), and MetS (n=16), patient groups. (A) Correlation to miR320 (r= -0.71; p<0.01), (B) miR197 (r= -0.61; p<0.01) (C) miR23a (r= -0.70; p<0.01), (D) miR221 (r= -0.59; p<0.01)), (E) miR2713p (r= -0.63; p<0.01)), and (F) miR130a3p (r= -0.60; p<0.01)).

Discussion
The results of our study indicate that a panel of biomarkers has a significant role in the detection of early stage MetS, before irreversible complications develop. Our results demonstrate statistically significant circulating levels of cytokines and miRNA associated with MetS displayed in a profile unique to each group of our population. This shows that pathologic changes occurring at the cellular level are translated through our data prior to perceptible clinical markers. This approach improves the recognition and diagnosis of MetS and is summarized in the schematic diagram, figure 7. Furthermore, a pattern of disease progression is evident in the biomarker profile. These trends are unique to the population of adult West Virginian females with obesity and MetS in our study. Our study indicated altered levels of cytokines (leptin, adiponectin and IL-6) and decreased levels of miRNAs (320-a, 197-3p, 23-3p, 221-3p, 27a-3p and 130a3p) appear in the circulation of patients indicating early stage MetS.
In this scheme, the progression of MetS is represented. Once the patient is at risk for MetS, pathophysiological changes alter biomarker levels. If a biomarker profile permits the diagnosis of MetS in the early stage, then disease progression is impeded prior to the onset of irreversible sequel.

MetS is a multifactorial disease, and delineating pathogenic mechanisms is complex; however, insulin resistance and central obesity are instrumental in disease development. Current strategies of diagnosing MetS rely on lipid, insulin and glucose levels, blood pressure and BMI or waist measurements [5]. Criteria that meet diagnosis of MetS indicate pathologic conditions of these levels and measurements. Once these indicators coincide with the diagnosis of MetS, complications develop with an increased risk of permanent disability and mortality, emphasizing the need to diagnose MetS in the early stage.
Dysregulation of leptin and adiponectin contribute to the progression of MetS. Deleterious effects of high levels of leptin, as in MetS, include: angiogenesis, hypertension, atherosclerosis and myocardial remodeling [14, 35, 36]. Leptin levels were highest in the MetS group and elevated in the Obese group compared to Control in our results. Elevated levels of circulating leptin indicate the metabolic changes are progressing to MetS. Protective properties of adiponectin fade at lower levels and are negatively correlated with glucose, insulin, and triglyceride levels, as well as adipose tissue accumulation and elevated blood pressure [12, 35, 37]. Consistent with previous studies, our data identified decreased levels of adiponectin in the MetS and Obese groups, indicating that disease progression of MetS occurs before recognition of current clinical measures.
The inflammatory state of MetS causes the release of the cytokine IL-6. In obesity, reactive oxygen species are formed from high levels of lipid oxidation, which precipitates systemic stress and the release of inflammatory cytokines [38]. In this dysregulated environment, IL-6 activates receptors to induce insulin resistance. IL-6 damages vascular endothelium to initiate atherosclerotic plaque formation [39-41]. Circulating levels of IL-6 correlate with the severity of MetS [20-22]. In our data, IL-6 was increased in the Obese and even more so in the MetS group establishing congruity between elevation of this biomarker and formation of an early diagnosis of MetS.
From the literature we chose miRNAs: 320a, 197-3p, 23-3p, 221-3p, 27a-3p, and 130a-3p to investigate in our population [24, 25, 27-32]. This group was selected, based on previous studies, since they all detect MetS in the early stage. All six miRNAs were significantly decreased in the circulation of the Obese group and even more so in the MetS group. This pattern indicates the value of including these miRNAs in a biomarker panel for MetS in our population.
Levels of circulating miRNA are not uniformly expressed between studies, which may reflect intergroup variance. Expression of miR-320a is dysregulated within insulin-resistant adipocytes [25, 30, 33]. A study of patients with T2DM in the United Kingdom found levels of circulating miR-320a decreased in of patients with T2DM [32]. Conversely, a study from Singapore detected a positive correlation between circulating miR-320a and fasting blood glucose levels, up regulation of miR-320a levels in patients with MetS and T2DM was also observed [25]. In a group of Asian Indians, miR-197 negatively correlated with the level of glycemic impairment and also decreased in T2DM and among a different Asian population, miR-197 was down regulated in MetS [29, 32]. However, other studies reveal that circulating miR-197 levels are increased in MetS, decreased in hypertension and positively correlated with elevated BMI [25, 30, 33]. MiR-23-a is associated with several metabolic pathways such as: glucose homeostasis, insulin secretion, lipid and carbohydrate metabolism [31]. In a study of adult Chinese females, the levels were distinct in patients with pre-diabetes versus T2DM [31]. Circulating amounts of miR-23a vary, but are positively correlated with BMI, increased in MetS, decreased in T2DM and hypertension [25]. MiR-221 displays decreased expression in obesity [24, 33]. However, among a group of Chinese women, circulating levels of miR-221-3p were higher in non-obese with MetS [27]. Physical activity and bariatric surgery increased the expression of miR-221-3p; known to be down regulated in the circulation and adipocytes of obese individuals [30, 42]. MiR-27a-3p is a regulator in adipogenic pathways and studies report that levels are increased MetS and in T2DM, but decreased in hypertension [25, 27, 33]. Circulating miR-130a-3p exhibited variability as decreased levels in obesity, T2DM and cardiovascular disease, while levels were increased in MetS, hypertension and insulin resistance; diets low in glycemic index, decreases the expression of circulating miR-130a-3p [24, 25, 30].
MiRNAs are targets for therapeutic strategies since they are key regulators in various pathways of disease. Monitoring miRNA in the circulation could provide: evaluation of disease progression, risk, susceptibility, treatment while offering a confirmation of a preclinical diagnosis [24]. One study examined intergroup differences of circulating miRNAs associated with T2DM. Levels of MiR-144 were significantly high in a Swedish population with T2DM but not in Iraqis; ethnic variation could explain this difference [28]. Levels of miRNA signal variation between the sexes may account for the sex differences found in the cardiovascular sequela of MetS [27]. Whether this difference results from diversity of genetics, environment, diet or lifestyle remains to be determined. The use of miRNAs in clinical testing of disease is applicable as numerous studies find that they exhibit a statistically significant variance between healthy and metabolic diseased individuals. MiRNAs appear to be a useful addition to a panel of biomarkers for pre-clinical diagnosis, risk assessment, and monitoring progression of MetS [24].
Biomarkers, like cytokines and miRNA, allow clinicians to diagnose, manage and stratify a patient's risk for disease states as depicted in figure 7 (schematic). Clinical application of a panel for MetS could prompt early detection and intervention before development of systemic complications. Since biomarkers have roles in various pathways, a panel of several biomarkers increases the specificity and sensitivity of disease detection. The panel could profoundly impact populations affected by this disease, such as the people of West Virginia.
Conclusion
MetS places a major disease burden on the population of West Virginia. Although further research is necessary to determine the predictive value of the considered serum biomarkers and miRNAs in regards to MetS, our results demonstrate that the biomarkers and miRNAs studied all showed a significant correlation to the disease states of MetS and obesity in a population of West Virginia females. Our formulated biomarker and miRNA panel has significant potential for detection of MetS and attenuation of disease progression prior to onset of irreversible complications. In turn, this could reduce the disease burden of MetS on our West Virginia population.
Abbreviations
T2DM: Type 2 Diabetes Mellitus
miRNA/miR-: Micro-Ribonucleic Acid
MetS: Metabolic Syndrome
AHA: American Heart Association
CVD: Cardiovascular Disease
HMW: High Molecular Weight
HDL: High Density Lipoprotein
LAR: Leptin to Adiponectin Ratio
BMI: Basal Metabolic Rate
IDF: International Diabetes Federation
EDTA: Ethylenediaminetetraacetic acid
H: Hour
µL: Micro Liter
ºC: Degrees Celsius
ELISA: Enzyme-linked Immunosorbent Assay
RNA: Ribonucleic Acid
RT: Real Time
cDNA: Complementary Deoxyribonucleic Acid
PCR: Polymerase Chain Reaction
ANOVA: Analysis of Variance
H2O: Dihydrogen Monoxide
IL-6: Interleukin 6
CDC: Center for Disease Control
Acknowledgements
This work was supported by National Institutes of Health Grants to JIS (HL109015, HL105649 and HL071556), and by the Brickstreet Foundation (J.I.S.). Its contents are solely the responsibility of the authors and do not necessarily represent the official views of the National Institutes of Health. These funds covered the costs to publish in open access.
Competing Interests
The authors have declared that no competing interest exists.
References
1. Laura Segal JR, Alejandra Martin. The State of Obesity: Better Policies for a Healthier America 2016. Robert Wood Johnson Foundation. 2016
2. Srikanthan K, Feyh A, Visweshwar H, Shapiro JI, Sodhi K. Systematic Review of Metabolic Syndrome Biomarkers: A Panel for Early Detection, Management, and Risk Stratification in the West Virginian Population. Int J Med Sci. 2016;13:25-38
3. Aguilar M, Bhuket T, Torres S, Liu B, Wong RJ. Prevalence of the metabolic syndrome in the United States, 2003-2012. Jama. 2015;313:1973-4
4. Grundy SM, Cleeman JI, Daniels SR, Donato KA, Eckel RH, Franklin BA. et al. Diagnosis and management of the metabolic syndrome: an American Heart Association/National Heart, Lung, and Blood Institute scientific statement. Current opinion in cardiology. 2006;21:1-6
5. Alberti KG, Zimmet P, Shaw J. Metabolic syndrome-a new world-wide definition. A Consensus Statement from the International Diabetes Federation. Diabetic medicine: a journal of the British Diabetic Association. 2006;23:469-80
6. Ford ES. The metabolic syndrome and mortality from cardiovascular disease and all-causes: findings from the National Health and Nutrition Examination Survey II Mortality Study. Atherosclerosis. 2004;173:309-14
7. Nichols GA, Moler EJ. Metabolic Syndrome Components Are Associated with Future Medical Costs Independent of Cardiovascular Hospitalization and Incident Diabetes. Metabolic Syndrome and Related Disorders. 2011;9:127-33
8. Boudreau DM, Malone DC, Raebel MA, Fishman PA, Nichols GA, Feldstein AC. et al. Health care utilization and costs by metabolic syndrome risk factors. Metab Syndr Relat Disord. 2009;7:305-14
9. Trivedi T, Liu J, Probst JC, Martin AB. The metabolic syndrome: are rural residents at increased risk? The Journal of rural health: official journal of the American Rural Health Association and the National Rural Health Care Association. 2013;29:188-97
10. Dong M, Ren J. What fans the fire: insights into mechanisms of leptin in metabolic syndrome-associated heart diseases. Current pharmaceutical design. 2014;20:652-8
11. Lee SW, Jo HH, Kim MR, You YO, Kim JH. Association between metabolic syndrome and serum leptin levels in postmenopausal women. Journal of obstetrics and gynaecology: the journal of the Institute of Obstetrics and Gynaecology. 2012;32:73-7
12. Gannage-Yared MH, Khalife S, Semaan M, Fares F, Jambart S, Halaby G. Serum adiponectin and leptin levels in relation to the metabolic syndrome, androgenic profile and somatotropic axis in healthy non-diabetic elderly men. European journal of endocrinology / European Federation of Endocrine Societies. 2006;155:167-76
13. Martins Mdo C, Lima Faleiro L, Fonseca A. [Relationship between leptin and body mass and metabolic syndrome in an adult population]. Revista portuguesa de cardiologia: orgao oficial da Sociedade Portuguesa de Cardiologia = Portuguese journal of cardiology: an official journal of the Portuguese Society of Cardiology. 2012;31:711-9
14. Ghantous CM, Azrak Z, Hanache S, Abou-Kheir W, Zeidan A. Differential Role of Leptin and Adiponectin in Cardiovascular System. International journal of endocrinology. 2015;2015:534320
15. Lara-Castro C, Fu Y, Chung BH, Garvey WT. Adiponectin and the metabolic syndrome: mechanisms mediating risk for metabolic and cardiovascular disease. Current opinion in lipidology. 2007;18:263-70
16. Kadowaki T, Yamauchi T, Kubota N, Hara K, Ueki K, Tobe K. Adiponectin and adiponectin receptors in insulin resistance, diabetes, and the metabolic syndrome. The Journal of clinical investigation. 2006;116:1784-92
17. Spranger J, Kroke A, Mohlig M, Bergmann MM, Ristow M, Boeing H. et al. Adiponectin and protection against type 2 diabetes mellitus. Lancet (London, England). 2003;361:226-8
18. Santaniemi M, Kesaniemi YA, Ukkola O. Low plasma adiponectin concentration is an indicator of the metabolic syndrome. European journal of endocrinology / European Federation of Endocrine Societies. 2006;155:745-50
19. Finucane FM, Luan J, Wareham NJ, Sharp SJ, O'Rahilly S, Balkau B. et al. Correlation of the leptin:adiponectin ratio with measures of insulin resistance in non-diabetic individuals. Diabetologia. 2009;52:2345-9
20. Weiss TW, Arnesen H, Seljeflot I. Components of the interleukin-6 transsignalling system are associated with the metabolic syndrome, endothelial dysfunction and arterial stiffness. Metabolism: clinical and experimental. 2013;62:1008-13
21. Chedraui P, Escobar GS, Perez-Lopez FR, Palla G, Montt-Guevara M, Cecchi E. et al. Angiogenesis, inflammation and endothelial function in postmenopausal women screened for the metabolic syndrome. Maturitas. 2014;77:370-4
22. Indulekha K, Surendar J, Mohan V. High sensitivity C-reactive protein, tumor necrosis factor-alpha, interleukin-6, and vascular cell adhesion molecule-1 levels in Asian Indians with metabolic syndrome and insulin resistance (CURES-105). Journal of diabetes science and technology. 2011;5:982-8
23. Chen WM, Sheu WH, Tseng PC, Lee TS, Lee WJ, Chang PJ. et al. Modulation of microRNA Expression in Subjects with Metabolic Syndrome and Decrease of Cholesterol Efflux from Macrophages via microRNA-33-Mediated Attenuation of ATP-Binding Cassette Transporter A1 Expression by Statins. PloS one. 2016;11:e0154672
24. Deiuliis JA. MicroRNAs as regulators of metabolic disease: pathophysiologic significance and emerging role as biomarkers and therapeutics. Int J Obes. 2016;40:88-101
25. Karolina DS, Tavintharan S, Armugam A, Sepramaniam S, Pek SL, Wong MT. et al. Circulating miRNA profiles in patients with metabolic syndrome. The Journal of clinical endocrinology and metabolism. 2012;97:E2271-6
26. Kimura Y, Tamasawa N, Matsumura K, Murakami H, Yamashita M, Matsuki K. et al. Clinical Significance of Determining Plasma MicroRNA33b in Type 2 Diabetic Patients with Dyslipidemia. J Atheroscler Thromb. 2016
27. Wang YT, Tsai PC, Liao YC, Hsu CY, Juo SH. Circulating microRNAs have a sex-specific association with metabolic syndrome. Journal of biomedical science. 2013;20:72
28. Wang X, Sundquist J, Zoller B, Memon AA, Palmer K, Sundquist K. et al. Determination of 14 circulating microRNAs in Swedes and Iraqis with and without diabetes mellitus type 2. PloS one. 2014;9:e86792
29. Flowers E, Aouizerat BE, Gadgil M, Kanaya AM. Abstract P300: Circulating MicroRNAs Associated with Glycemic Impairment and Progression in Asian Indians. Circulation. 2015;131:AP300-AP
30. Villard A, Marchand L, Thivolet C, Rome S. Diagnostic Value of Cell-free Circulating MicroRNAs for Obesity and Type 2 Diabetes: A Meta-analysis. Journal of molecular biomarkers & diagnosis. 2015:6
31. Yang Z, Chen H, Si H, Li X, Ding X, Sheng Q. et al. Serum miR-23a, a potential biomarker for diagnosis of pre-diabetes and type 2 diabetes. Acta diabetologica. 2014;51:823-31
32. Zampetaki A, Kiechl S, Drozdov I, Willeit P, Mayr U, Prokopi M. et al. Plasma microRNA profiling reveals loss of endothelial miR-126 and other microRNAs in type 2 diabetes. Circulation research. 2010;107:810-7
33. Alexander R, Lodish H, Sun L. MicroRNAs in adipogenesis and as therapeutic targets for obesity. Expert opinion on therapeutic targets. 2011;15:623-36
34. R M. Biomarkers: potential uses and limitations. NeuroRx: the journal of the American Society for Experimental NeuroTherapeutics. 2004;1:182-8
35. Ryo M, Nakamura T, Kihara S, Kumada M, Shibazaki S, Takahashi M. et al. Adiponectin as a biomarker of the metabolic syndrome. Circulation journal: official journal of the Japanese Circulation Society. 2004;68:975-81
36. Thogersen AM, Soderberg S, Jansson JH, Dahlen G, Boman K, Nilsson TK. et al. Interactions between fibrinolysis, lipoproteins and leptin related to a first myocardial infarction. European journal of cardiovascular prevention and rehabilitation: official journal of the European Society of Cardiology, Working Groups on Epidemiology & Prevention and Cardiac Rehabilitation and Exercise Physiology. 2004;11:33-40
37. Baratta R, Amato S, Degano C, Farina MG, Patane G, Vigneri R. et al. Adiponectin relationship with lipid metabolism is independent of body fat mass: evidence from both cross-sectional and intervention studies. The Journal of clinical endocrinology and metabolism. 2004;89:2665-71
38. Furukawa S FT, Shimabukuro M, Iwaki M, Yamada Y, Nakajima Y. et al. Increased oxidative stress in obesity and its impact on metabolic syndrome. The Journal of clinical investigation. 2004;114:1752-61
39. Aroor AR, McKarns S, Demarco VG, Jia G, Sowers JR. Maladaptive immune and inflammatory pathways lead to cardiovascular insulin resistance. Metabolism: clinical and experimental. 2013;62:1543-52
40. Raghavan S, Subramaniyam G, Shanmugam N. Proinflammatory effects of malondialdehyde in lymphocytes. Journal of leukocyte biology. 2012;92:1055-67
41. Le Lay S, Simard G. Oxidative stress and metabolic pathologies: from an adipocentric point of view. 2014. 2014:908539
42. Chou WW, Wang YT, Liao YC, Chuang SC, Wang SN, Juo SH. Decreased microRNA-221 is associated with high levels of TNF-alpha in human adipose tissue-derived mesenchymal stem cells from obese woman. Cellular physiology and biochemistry: international journal of experimental cellular physiology, biochemistry, and pharmacology. 2013;32:127-37
Author contact
![]() Corresponding author: Komal Sodhi M.D., Associate Professor of Surgery and Pharmacology, Marshall University Joan C Edwards School of Medicine, WV 25701, Tel: 304 691-1704, Fax: 914 347-4956, E-mail: Sodhiedu
Corresponding author: Komal Sodhi M.D., Associate Professor of Surgery and Pharmacology, Marshall University Joan C Edwards School of Medicine, WV 25701, Tel: 304 691-1704, Fax: 914 347-4956, E-mail: Sodhiedu