Impact Factor ISSN: 1449-1907

 Global reach, higher impact
Int J Med Sci 2017; 14(3):240-245. doi:10.7150/ijms.17738 This issue Cite
Research Paper
Interrelationship between insulin resistance and portal haemodynamic abnormality in cirrhosis
Hitoshi Maruyama ![]() , Kazufumi Kobayashi, Soichiro Kiyono, Osamu Yokosuka
, Kazufumi Kobayashi, Soichiro Kiyono, Osamu Yokosuka
Department of Gastroenterology, Chiba University Graduate School of Medicine, 1-8-1, Inohana, Chuou-ku, Chiba, 260-8670, Japan
Received 2016-9-27; Accepted 2016-12-28; Published 2017-2-23
Abstract
Background: There are only limited data regarding the effect of impaired portal circulation on the glucose metabolism. The study prospectively examined the interrelationship between insulin resistance (IR) and portal haemodynamic abnormality in cirrhosis.
Methods: There were 53 cirrhosis patients (61.6 ± 13.0 years) all presenting gastroesophageal varices. Portal haemodynamics by both hepatic venous catheterisation and Doppler ultrasound were examined with respect to the homeostasis model assessment (HOMA)-IR and HOMA2-IR. The IR was defined by HOMA-IR > 3.0 or HOMA2-IR > 2.0.
Results: Forty-two patients (79.2%) had collateral vessels, 38 with left gastric vein, 12 with short/posterior gastric vein, 9 with splenorenal shunt, and 3 with inferior mesenteric vein. Multivariate analysis provided significant factors; wedged hepatic venous pressure (HR1.183, 95% CI 1.012-1.383, p=0.035) for HOMA-IR > 3.0, body mass index for HOMA2-IR > 2.0 (HR1.490, 95% CI 1.176-1.888, p=0.001), and collateral flow volume for both HOMA-IR > 3.0 (HR1.007, 95% CI 1.001-1.014, p=0.015) and HOMA2-IR > 2.0 (HR 1.007, 95% CI 1.002-1.013, p=0.009). The best cut-off value of collateral flow volume was 165 ml/min for detecting the HOMA-IR > 3.0 showing area under the receiver operating characteristic curve (AUROC) 0.688 (Odds ratio, 5.33) with sensitivity 70% and specificity 69.6%, and was 165 ml/min for detecting median value of HOMA2-IR > 2.0 showing AUROC 0.698 (odds ratio, 5.7) with sensitivity 75% and specificity 65.5%.
Conclusion: There is a close linkage between the IR and impaired portal haemodynamics presented by the collateral development, suggesting the underlying pathogenesis of portal hypertension in cirrhosis patients.
Keywords: Insulin resistance, cirrhosis, portal hemodynamics, diabetes
Introduction
The number of patients with chronic liver disease is increasing worldwide. It is now considered a social problem [1, 2], with a wide-range across the spectrum of aetiology typified by viral infection and metabolic abnormality [3-5]. Impaired glucose metabolism is the key mechanism for the pathogenesis of non-alcoholic fatty liver disease and non-alcoholic steatohepatitis (NASH) as well as a considerable factor for developing metabolic syndrome with the risk of cardiovascular disease [6].
However, recent studies have also shown that the influence of insulin resistance (IR) on the pathogenesis of liver disease is not specific to NASH but also appears in viral-related cirrhosis, particularly in hepatitis C virus (HCV)-related cirrhosis [7, 8]. There may, in fact, be two mechanisms for the glucose intolerance in cirrhosis: IR of muscle and an inadequate response of the beta-cells [9]. Finally, diabetes mellitus may develop as the result of an impaired insulin secretion with the hepatic IR in cirrhotic patients [10].
Because of the close relationship with the severity of the disease, portal haemodynamics may be the key pathophysiology in cirrhosis. A more recent study corroborates the theorised close relationship between the IR and portal hypertension, characterised by a severity of portal hypertension and development/bleeding of oesophageal varices [11]. Although these data suggest the role of portal haemodynamics as a potential factor related to the IR, there are only limited data regarding the interrelationship between an impaired circulation in the portal system and the glucose metabolism.
Against this background, the present study was designed to investigate the linkage between the degree of IR and portal haemodynamics including pressure data obtained from hepatic venous catheterization and collateral blood flow under physiological condition assessed by Doppler ultrasound (US). The aim was to examine the interrelationship between the IR and collateral development in cirrhotic patients with various aetiologies.
Materials and Methods
Study design
This prospective study was performed from June 2012 to January 2016 following the approval by the ethics committee at Chiba University Hospital. Informed written consent was obtained from all patients. The study enrolled cirrhosis patients with gastro-oesophageal varices previously diagnosed by endoscopy (within 1 month) who were scheduled for evaluation of the severity of portal hypertension. If the patient agreed to participate in the study, the examinations were planned following an admission; including a blood test, Doppler US, and hepatic venous catheterisation. Diagnosis of cirrhosis was made by biopsy sample or by biochemical findings plus the results from two types of imaging: US and contrast-enhanced computed tomography/magnetic resonance imaging. The IR was assessed by two methods: the homeostasis model assessment (HOMA)-IR using the following formula: fasting insulinaemia (mU/ml)×fasting glycaemia (mmol/l)/22.5 [12], and the correctly solved computer model of HOMA, HOMA2-IR [13, 14]. The IR in this study was defined by HOMA-IR > 3.0 [15], and by HOMA2-IR > 2.0 [16].
The following patients were excluded from the study; i) diabetes under insulin therapy, ii) advanced hepatocellular carcinoma (beyond the Milan criteria) [17], iii) cavernoma detected by US, iv) previous allergic reaction to iodinated contrast material, v) severe cardiac dysfunction, vi) insufficient performance of hepatic venous catheterisation such as an unsuccessful balloon occlusion of hepatic vein, vii) administration of β blocker, viii) pregnancy, ix) age younger than 20 years or older than 85 years.
Hepatic venous catheterisation
Hepatic venous catheterisation was performed by the standard method described in the literature using a balloon catheter (5 Fr, 9 mm; Terumo Clinical Supply Co. Ltd, Gifu, Japan) [18]. After the measurement of free hepatic venous pressure and wedged hepatic venous pressure (WHVP) in the right hepatic vein, hepatic venous pressure gradient (HVPG) was calculated as the difference between them.
Ultrasound
This study used SSA-770A or 790A (Toshiba, Tokyo, Japan) with a 3.75 MHz convex probe for the evaluation of portal haemodynamics. The examination was performed with patients in supine position after fasting for four hours or more. Following the routine observation, spleen size (mm2) was calculated by multiplying the distance from the splenic hilum to the caudal polar angle, measured with two intersecting lines described in the literature using 2000 mm2 as the upper limit value of normal subjects [19].
The study determined the collaterals using following criteria; i) extrahepatic shunt vessel, ii) hepatofugal flow direction on Doppler mode, iii) when there were multiple shunt vessels per individual, the vessel with the highest flow volume was defined as the collateral route for data analysis. Therefore, the study did not take following shunt vessels (paraumbilical vein and intrahepatic portal venous shunt) into account [20].
The velocity in the portal trunk and collateral route was measured by pulsed Doppler mode under the sampling point at the width corresponding to the diameter of the vessel and at an angle below 60 degrees between the US beam and the vessel [21]. The mean flow volume (mL/min) was calculated by multiplying the mean velocity for 1 second for the cross-section of the vessel, and multiplying it by 60 seconds. Because the flow volume reflects both the diameter and the velocity, the current study adopted it as an indicator for collateral development. The flow volume was expressed as zero for patients showing no evidence of collateral vessel. The data used for analysis was the average value, calculated using measurements taken between 2 to 4 times. All of the US examinations were performed by HM, who had more than 20 years of experience.
Endoscopy
Endoscopic examination was performed using a GIF-H260 or GIF-Q240 system (Olympus Corp., Tokyo, Japan). Gastro-oesophageal varices were detected and classified according to the general rules of the Japan Research Society for Portal Hypertension, small, medium, or large [22]. Red signs were assessed by the presence of red wale marks or red spots in the variceal wall.
Statistical analysis
All results are expressed as the mean ± standard deviation (SD), median, range or percentage. The data were analysed using a Student's t-test or Mann-Whitney U test for continuous variables, or chi-square test of categorical variables. The diagnostic ability was assessed by the receiver operating characteristic (ROC) curve analysis with the area under the ROC curve (AUROC). Logistic regression analysis was used to evaluate significant factors, and results were presented as a hazard ratio (HR) with a 95% confidence interval (CI), sensitivity, specificity and best cut-off value. The analysis of variables related to HOMA-IR and HOMA2-IR was performed using univariate and multivariate analysis. The probability values < 0.05 were considered to be statistically significant. The statistical analyses were performed using SAS software (SAS Institute Inc., Cary, NC, USA).
Results
Patient characteristics
There were 60 patients with cirrhosis who could have potentially participated in the study. Twenty-two of those patients were diagnosed via biopsy and 38 patients were diagnosed using both imaging and biochemical findings. Because 7 patients had insufficient clinical data, 53 patients remained eligible to participate in the study (33 males and 20 females; age, mean ± SD, 61.6 ± 13.0 years, range 23 - 83 years) (Table 1). Twenty-four were classified as Child-Pugh class A, 26 were classified as class B, and 3 were classified as class C. The etiology was HCV in 16, alcohol abuse in 12, primary biliary cholangitis in 7, NSAH in 6, hepatitis B virus in 5, autoimmune hepatitis in 1, and unknown in 6.
Patient characteristics.
| n=53 | |
|---|---|
| Sex (male/female) | 33/20 |
| Age (years) | 61.6 ±13.0 (23-83) |
| Body mass index (kg/m2) | 24.1 ± 4.5 (16.4-38.5) |
| Child-Pugh class (A/B/C) | 24/26/3 |
| Child-Pugh score | 6.9 ±1.3 (5-11) |
| Esophageal varices (-/mild/moderate/severe) | 4/8/29/12 |
| Gastric varices (-/mild/moderate/severe) | 18/22/10/3 |
| Bleeding history of varices (-/+) | 26/27 |
| Ascites (-/+) | 30/23 |
| Hepatic venous pressure gradient (mmHg) | 13.7 ± 4.6 (3.7-23.5) |
| Spleen size (mm2) | 3437 ± 1498 (1356-7875) |
| Flow volume in portal trunk (mL/min) | 786.3 ± 291.1 (325.0-1759.0) |
| Collateral vessel (LGV/SGV・PGV/SRS/IMV) | 38/12/9/3 |
| Flow volume in collateral vessel* (mL/min) | 248.7 ± 171.2 (30-940) |
Data are expressed as number or mean ± standard deviation (range).
LGV, left gastric vein; SGV, short gastric vein; PGV, posterior gastric vein; SRS, splenorenal shunt; IMV, inferior mesenteric vein
*: the vessel with the highest flow volume was defined as the collateral for data analysis in case with multiple collateral vessels
Portal haemodynamics
The HVPG ranged from 3.7 to 23.5 mmHg (13.7 ± 4.6). HVPG > 10 mmHg was observed in 42 patients (79.2 %) and that > 12 mmHg was in 34 patients (64.2 %). The spleen size ranged from 1356 to 7875 mm2 (3437 ± 1498), and 43 patients (81.1 %) were accompanied with splenomegaly.
Doppler US showed forward flow direction in the portal system in 47 patients (88.7%) and reversed flow direction in the splenic vein in 6 patients (11.3%). Forty-two patients (79.2%) had single or multiple collateral vessels, left gastric vein in 38 patients, short/posterior gastric vein in 12 patients, splenorenal shunts in 9, and inferior mesenteric vein in 3. Flow volume in the portal trunk ranged from 325 to 1759 mL/min (786.3 ± 291.1).
HOMA and portal haemodynamics
The IR was presented by HOMA-IR ranging from 0.8 to 16.8 (mean ± SD, 4.2 ± 2.8; median 3.47) and HOMA2-IR ranging from 0.5 to 6.8 (mean ± SD, 2.0 ± 1.2; median 1.78).
Clinical background was compared between the two groups divided by the cut-off values of HOMA-IR (3.0) and HOMA2-IR (2.0), showing significant difference in the body mass index (BMI) and collateral flow volume for both HOMA-IR and HOMA2-IR, and model for end-stage liver disease (MELD) score and WHVP for HOMA-IR alone (Tables 2 and 3).
Comparison of patient characteristics with respect to HOMA-IR.
| HOMA-IR≦3.0 | HOMA-IR>3.0 | P value | |
|---|---|---|---|
| Number | 23 | 30 | - |
| Age (years) | 64 ± 12.8 | 59.7 ± 13.1 | 0.238 |
| Sex (male/female) | 12/11 | 21/9 | 0.188 |
| BMI (kg/m2) | 22.0 ± 3.8 | 25.8 ± 4.3 | 0.002 |
| Child-Pugh score | 6.6 ± 1.2 | 7.1 ± 1.4 | 0.127 |
| MELD score | 8.3 ± 1.6 | 9.5 ± 2.1 | 0.03 |
| WHVP (mmHg) | 20.6 ± 5.4 | 24.7 ± 5.0 | 0.006 |
| HVPG (mmHg) | 12.3 ± 5.0 | 14.9 ± 4.1 | 0.05 |
| Flow volume* (mL/min) | 125.7 ± 113.2 | 251.8 ± 207.8 | 0.007 |
| Ascites (-/+) | 14/9 | 16/14 | 0.587 |
| HCC (-/+) | 20/3 | 26/4 | 1.000 |
Data are expressed as number or mean ± standard deviation (range).
*: Flow volume in the collateral vessel
BMI, body mass index; MELD, model for end-stage liver disease; WHVP, wedged hepatic venous pressure; HVPG, hepatic venous pressure gradient; HCC, hepatocellular carcinoma.
Comparison of patient characteristics with respect to HOMA2-IR.
| HOMA2-IR≦2.0 | HOMA2-IR>2.0 | P value | |
|---|---|---|---|
| Number | 29 | 24 | - |
| Age (years) | 61.4 ± 15.5 | 61.7 ± 9.6 | 0.941 |
| Sex (male/female) | 18/11 | 15/9 | 0.975 |
| BMI (kg/m2) | 21.9 ± 3.5 | 26.8 ± 4.2 | 0.0003 |
| Child-Pugh score | 7.0 ± 1.5 | 6.8 ± 1.1 | 0.643 |
| MELD score | 8.8 ± 1.9 | 9.3 ± 2.1 | 0.299 |
| WHVP (mmHg) | 21.7 ± 5.9 | 24.3 ± 4.8 | 0.103 |
| HVPG (mmHg) | 13.0 ± 5.2 | 14.7 ± 3.8 | 0.196 |
| Flow volume* (mL/min) | 137.0 ± 128.7 | 269.7 ± 213.2 | 0.011 |
| Ascites (-/+) | 15/14 | 15/9 | 0.435 |
| HCC (-/+) | 26/3 | 20/4 | 0.688 |
Data are expressed as number or mean ± standard deviation (range).
*: Flow volume in the collateral vessel
BMI, body mass index; MELD, model for end-stage liver disease; WHVP, wedged hepatic venous pressure; HVPG, hepatic venous pressure gradient; HCC, hepatocellular carcinoma.
Univariate analysis showed 4 significant factors for HOMA-IR > 3.0, BMI, MELD score, WHVP and collateral flow volume, and 2 significant factors for HOMA2-IR > 2.0, BMI and collateral flow volume (Table 4). Multivariate analysis provided WHVP (HR1.183, 95%CI 1.012-1.383, p=0.035) and collateral flow volume (HR1.007, 95%CI 1.001-1.014, p=0.015) as significant factors for HOMA-IR, and BMI (HR1.490, 95%CI 1.176-1.888, p=0.001) and collateral flow volume (HR1.007, 95%CI 1.002-1.013, p=0.009) for HOMA2-IR (Table 4). Collateral flow volume was the only significant factor for both HOMA-IR and HOMA2-IR.
Univariate and multivariate analysis for detection of insulin resistance.
| Univariate analysis | Multivariate analysis | ||||
|---|---|---|---|---|---|
| HR (95% CI) | P value | HR (95% CI) | P value | ||
| HOMA-IR | Sex, female | 2.139 (0.690-6.628) | 0.188 | - | - |
| Age | 0.973 (0.931-1.018) | 0.237 | - | - | |
| BMI | 1.282 (1.081-1.521) | 0.004 | 1.213 (0.992-1.482) | 0.06 | |
| CPS | 1.421 (0.899-2.245) | 0.133 | - | - | |
| MELD score | 1.422 (1.019-1.985) | 0.038 | 1.317 (0.855-2.028) | 0.212 | |
| WHVP | 1.169 (1.035-1.320) | 0.012 | 1.183 (1.012-1.383) | 0.035 | |
| HVPG | 1.137 (0.996-1.298) | 0.057 | - | - | |
| Flow volume | 1.005 (1.001-1.009) | 0.017 | 1.007 (1.001-1.014) | 0.015 | |
| HCC | 0.975 (0.196-4.861) | 0.975 | - | - | |
| Diabetes | 0.600 (0.133-2.710) | 0.507 | - | - | |
| Ascites | 0.735 (0.244-2.213) | 0.584 | - | - | |
| HOMA2-IR | Sex, female | 1.019 (0.334-3.109) | 0.974 | - | - |
| Age | 1.002 (0.960-1.044) | 0.942 | - | - | |
| BMI | 1.408 (1.156-1.716) | 0.001 | 1.490 (1.176-1.888) | 0.001 | |
| CPS | 0.905 (0.599-1.368) | 0.636 | - | - | |
| MELD score | 1.163 (0.877-1.541) | 0.295 | - | - | |
| WHVP | 1.093 (0.981-1.218) | 0.108 | - | - | |
| HVPG | 1.086 (0.958-1.232) | 0.196 | - | - | |
| Flow volume | 1.005 (1.001-1.009) | 0.014 | 1.007 (1.002-1.013) | 0.009 | |
| HCC | 0.577 (0.116-2.876) | 0.502 | - | - | |
| Diabetes | 1.042 (0.246-4.407) | 0.956 | - | - | |
| Ascites | 1.556 (0.517-4.680) | 0.432 | - | - | |
Data are expressed as number or mean ± standard deviation (range).
HR, hazard ratio; CI, confidence interval; BMI, body mass index; CPS, Child-Pugh score; MELD, model for end-stage liver disease; WHVP, wedged hepatic venous pressure; HVPG, hepatic venous pressure gradient; Flow volume, flow volume in collateral vessel; HCC, hepatocellular carcinoma
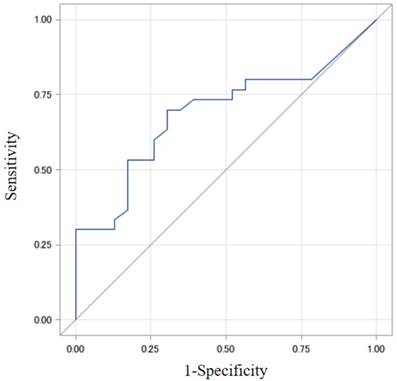
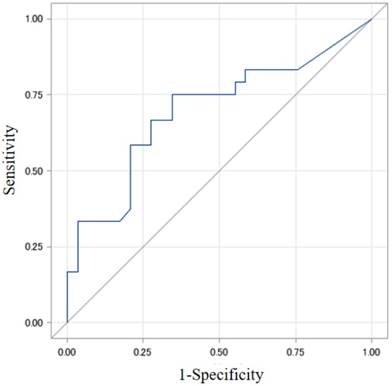
The best cut-off value of collateral flow volume was 165 ml/min for a detection of HOMA-IR > 3.0 showing AUROC 0.688 (Odds ratio, 5.33) with sensitivity 70% and specificity 69.6%, and was 165 ml/min for a detection of HOMA2-IR > 2.0 showing AUROC 0.698 (Odds ratio, 5.7) with sensitivity 75% and specificity 65.5%. (Figs. 1 and 2).
The best cut-off value of collateral flow volume was 165 ml/min for a detection of HOMA-IR 3.0 showing AUROC 0.688 (Odds ratio, 5.33) with sensitivity 70% and specificity 69.6%. AUROC, area under the receiver operating characteristic curve; HOMA, homeostasis model assessment; IR, insulin resistance
The best cut-off value of collateral flow volume was 165 ml/min for a detection of HOMA2-IR 2.0 showing AUROC 0.698 (Odds ratio, 5.7) with sensitivity 75% and specificity 65.5%. AUROC, area under the receiver operating characteristic curve; HOMA, homeostasis model assessment; IR, insulin resistance
Discussion
This study is the first, to the best of our knowledge, to demonstrate the interrelationship between the degree of IR and portal haemodynamic abnormality characterised by the collateral flow volume under physiological condition.
There may be two possible reasons for the close linkage between the IR and portal haemodynamics. One is a modified distribution of in vivo insulin due to the collateral route which diverts blood flow away from the liver, indicating IR as a consequential factor. In fact, it is reported that the occlusion of shunt routes by balloon-occluded retrograde transvenous obliteration improved IR-related hyperinsulinemia due to an increased portal venous inflow, resulting in enhanced hepatic insulin clearance in patients with portal hypertension [23]. This data support our results, though direct connection between the role of collateral development and modified distribution of in vivo insulin might be proved by the comparison of the concentration of serum insulin in the portal trunk, in the collateral vessel and in the periphery in patients with various degrees of collaterals. Meanwhile, a more recent study has shown a relationship between congestion in the pancreatic perfusion and an impaired insulin secretion in cirrhosis patients [24]. In this regard, shunt occlusion, because of a potential role to increase portal pressure, may not necessarily be beneficial to glucose metabolism, which remains to be studied in the future.
Second possible mechanism is the role of IR as a trigger for collateral development, because IR is considered to be the cause rather than the consequence of steatosis and fibrosis in genotype 1 HCV-related patients, suggesting that an increase of circulating insulin could be a risk factor for fibrosis through IR-induced steatosis [25]. It is also reported that a presence of IR but not steatosis may be associated with significant hepatic fibrosis in Asian-region HCV genotype 2 or 3 patients [8]. Furthermore, a recent well-designed study reported that the platelet/spleen ratio and IR measured by HOMA-IR, regardless of the presence of diabetes, significantly predict the presence of oesophageal varices in patients with HCV-related cirrhosis and Child class A [11]. Anyhow, needless to say, since the development of portal hypertension arises from multifactorial causes, it may be hard to conclude that the role of IR in portal hypertension is either consequence or trigger. The substantial role of IR in the pathogenesis of portal hypertension remains to be elucidated.
On the multivariate analysis, the significant factor related to both HOMA-IR and HOMA2-IR was neither HVPG nor liver function reserve, but only collateral flow volume. Actually, investigators have suggested the limited linkage between portal pressure and IR. One theory is that a correlation between HOMA2-IR and HVPG was lost when only patients with clinically significant portal hypertension (HVPG > 10 mmHg) were considered [26], and the other suggestion is that high IR is related to high portal pressure though no correlation was found between IR (HOMA) and HVPG [27]. A possible explanation may be a presence of spontaneous shunt formation, which diverts portal blood flow away from the liver, resulting in the reduction of portal pressure [28], and therefore may enhance the importance of the evaluation of physiological portal haemodynamics for the identification of potential IR and of the identification of collateral flow volume > 165 mL/min.
There are some limitations to our study. The first is that the number of patients is relatively small with heterogeneous kinds of aetiologies for liver diseases. There might be some further bias because all subjects were accompanied with gastro-oesophageal varices, and the mean BMI was only 24.1, much lower than that in the Western study. Therefore, the data need to be validated in other nations with a larger patient population. The second limitation is that the study did not take paraumbilical vein and intrahepatic shunts into account. As these routes are not rare in cirrhosis and might have a certain effect on in vivo insulin distribution, the role of the routes need to be clarified in the next study. Thirdly, there is no data regarding the inter-operator coefficient variation and/or variability for Doppler parameters. Measurement by the experienced single operator may support the reliability of the results, lack of an evidence of reproducibility may limit the value of the data. Finally, the linkage between the IR and collateral development from the view point of developing diabetes needs to be examined in patients with non-cirrhotic portal hypertension in the future.
In conclusion, the present study clearly demonstrated the close linkage between the IR and portal haemodynamics as presented by the collateral development, suggesting a possible underlying pathogenesis in cirrhosis patients. It is expected that the relevant research may contribute to develop the stratified management of cirrhosis according to the degree of collateral vessels.
Abbreviations
NASH, nonalcoholic steatohepatitis; IR, insulin resistance; HCV, hepatitis C virus; HVPG, hepatic venous pressure gradient; US, ultrasound; HOMA, homeostasis model assessment; WHVP, wedged hepatic venous pressure; SD, standard deviation; ROC, receiver operating characteristic; AUROC, area under the receiver operating characteristic curve; HR, hazard ratio; CI, confidence interval; BMI, body mass index.
Competing Interests
The authors have declared that no competing interest exists.
References
1. Tsochatzis EA, Bosch J, Burroughs AK. Liver cirrhosis. Lancet. 2014;383:1749-1761
2. Durand F, Valla D. Assessment of prognosis of cirrhosis. Semin Liver Dis. 2008;28:110-122
3. Torres DM, Harrison SA. Diagnosis and therapy of nonalcoholic steatohepatitis. Gastroenterology. 2008;134:1682-1698
4. CDC. Viral hepatitis surveillance, United States 2010 National Center for HIV SaTPDoHASB. Atlanta, GA: Centers for Disease Control and Prevention. 2010
5. Ly KN, Xing J, Klevens RM, Jiles RB, Ward JW, Holmberg SD. The increasing burden of mortality from viral hepatitis in the United States between 1999 and 2007. Ann Intern Med. 2012;156:271-278
6. Targher G, Day CP, Bonora E. Risk of cardiovascular disease in patients with nonalcoholic fatty liver disease. N Engl J Med. 2014;363:1341-1350
7. Durante-Mangoni E, Zampino R, Marrone A, Tripodi MF, Rinaldi L, Restivo L. et al. Hepatic steatosis and insulin resistance are associated with serum imbalance of adiponectin/tumour necrosis factor-a in chronic hepatitis C patients. Aliment Pharmacol Ther. 2006;24:1349-1357
8. Patel K, Thompsom AJ, Chuang WL, Lee CM, Peng CY, Shanmuganathan G. et al. Insulin resistance is independently associated with significant hepatic fibrosis in Asian chronic hepatitis C genotype 2 or 3 patients. J Gastroenterol Hepatol. 2011;26:1182-1188
9. Petrides AS, Vogt C, Schulze-Berge D, Matthews D, Strohmeyer G. Pathogenesis of glucose intolerance and diabetes mellitus in cirrhosis. Hepatology. 1994;19:616-622
10. Petrides AS, DeFronzo RA. Glucose and insulin metabolism in cirrhosis. J Hepatol. 1989;8:107-114
11. Camma C, Petta S, Di Marco V, Bronte F, Ciminnisi S, Licata G. et al. Insulin resistance is a risk factor for esophageal varices in hepatitis C virus cirrhosis. Hepatology. 2009;49:195-203
12. Matthews DR, Hosker JP, Rudenski AS, Naylor BA, Treacher DF, Turner RC. Homeostasis model assessment: insulin resistance and beta-cell function from fasting plasma glucose and insulin concentration in man. Diabetologia. 1985;28:412-419
13. Levy JC, Matthews DR, Hermans MP. Correct homeostasis model assessment (HOMA) evaluation uses the computer program (Letter). Diabetes Care. 1998;21:2191-2192
14. Diabetes Trials Unit, Oxford, UK. HOMA Calculator v2.2. http://www.dtu.ox.ac.uk
15. Moucari R, Asselah T, Cazals-Hatem D, Voitot H, Boyer N, Ripault MP. et al. Insulin resistance in chronic hepatitis C: association with genotypes 1 and 4, serum HCV RNA level, and liver fibrosis. Gastroenterology. 2008;134:416-423
16. Musso G, Gambino R, Bo S, Uberti B, Biroli G, Pagano G. et al. Should nonalcoholic fatty liver disease be included in the definition of metabolic syndrome? A cross-sectional comparison with Adult Treatment Panel III criteria in nonobese nondiabetic subjects. Diabetes Care. 2008;31:562-568
17. Mazzaferro V, Regalia E, Doci R, Andreola S, Pulvirenti A, Bozzetti F. et al. Liver transplantation for the treatment of small hepatocellular carcinomas in patients with cirrhosis. N Engl J Med. 1996;334:693-699
18. Kerns SR, Hawkins IF. Carbon dioxide digital subtraction angiography: expanding applications and technical evolution. AJR Am J Roentgenol. 1995;164:735-741
19. Maruyama H, Kamezaki H, Kondo T, Sekimoto T, Takahashi M, Yokosuka O. Sonographic and clinical features of collateral vessels at the splenic hilum in cirrhosis. Clin Radiol. 2014;69:e140-145
20. Sacerdoti D, Bolognesi M, Bombonato G, Gatta A. Paraumbilical vein patency in cirrhosis: effects on hepatic hemodynamics evaluated by Doppler sonography. Hepatology. 1995;22:1689-1694
21. Bolondi L, Li Bassi S, Gaiani S, Barbara L. Doppler flowmetry in portal hypertension. J Gastroenterol Hepatol. 1990;5:459-467
22. Tajiri T, Yosida H, Obara K, Onji M, Kage M, Kitano S. et al. General rules for recording endoscopic findings of esophagogastric varices (2nd edition). Dig Endosc. 2010;22:1-9
23. Ishikawa T, Shiratsuki S, Matsuda T, Iwamoto T, Takami T, Uchida K. et al. Occlusion of portosystemic shunts improves hyperinsulinemia due to insulin resistance in cirrhotic patients with portal hypertension. J Gastroenterol. 2014;49:1333-1341
24. Kuroda T, Hirooka M, Koizumi M, Ochi H, Hisano Y, Bando K. et al. Pancreatic congestion in liver cirrhosis correlates with impaired insulin secretion. J Gastroenterol. 2015;50:683-693
25. Fartoux L, Poujol-Robert A, Guechot J, Wendum D, Poupon R, Serfaty L. Insulin resistance is a cause of steatosis and fibrosis progression in chronic hepatitis C. Gut. 2005;54:1003-1008
26. Erice E, Llop E, Berzigotti A, Abraldes JG, Conget I, Seijo S. et al. Insulin resistance in patients with cirrhosis and portal hypertension. Am J Physiol Gastrointest Liver Physiol. 2012;302:G1458-1465
27. Jeon HK, Kim MY, Baik SK, Park HJ, Choi H, Park SY. et al. Hepatogenous diabetes in cirrhosis is related to portal pressure and variceal hemorrhage. Dig Dis Sci. 2013;58:3335-3341
28. Watanabe K, Kimura K, Matsutani S, Ohto M, Okuda K. Portal hemodynamics in patients with gastric varices: a study in 230 patients with esophageal and/or gastric varices using portal vein catheterization. Gastroenterology. 1988;95:434-440
Author contact
![]() Corresponding author: TEL: 81-43-2262083, FAX: 81-43-2262088, E-MAIL: maru-cibac.jp
Corresponding author: TEL: 81-43-2262083, FAX: 81-43-2262088, E-MAIL: maru-cibac.jp