Impact Factor ISSN: 1449-1907
- Issue 9; 2026
- Issue 8; 2026
- Issue 7; 2026
- Issue 6; 2026
- Issue 5; 2026
- Volume 23; 2026
- Past Issues
- Editorial Board
- Cover Images
- Index & Coverage
- Cover Suggestion
- Special Issues
Introduction
Methods
Results
Discussion
Conclusions
Abbreviations
Supplementary Material
Acknowledgements
References

 Global reach, higher impact
Int J Med Sci 2017; 14(1):1-12. doi:10.7150/ijms.15783 This issue Cite
Research Paper
Amino Acid Profiles of Serum and Urine in Search for Prostate Cancer Biomarkers: a Pilot Study
Paweł Dereziński1, Agnieszka Klupczynska1, Wojciech Sawicki2, Jerzy A. Pałka3, Zenon J. Kokot1 ![]()
1. Department of Inorganic and Analytical Chemistry, Poznan University of Medical Sciences, 6 Grunwaldzka Street, 60-780 Poznań, Poland.
2. Ward of Urology, The Holy Family Hospital, 18 Jarochowskiego Street, 60-235 Poznań, Poland.
3. Department of Medicinal Chemistry, Medical University of Bialystok, 2d Mickiewicza Street, 15-222 Białystok, Poland.
Received 2016-4-8; Accepted 2016-10-24; Published 2017-1-1
Abstract
There is a great interest in searching for diagnostic biomarkers in prostate cancer patients. The aim of the pilot study was to evaluate free amino acid profiles in their serum and urine. The presented paper shows the first comprehensive analysis of a wide panel of amino acids in two different physiological fluids obtained from the same groups of prostate cancer patients (n = 49) and healthy men (n = 40). The potential of free amino acids, both proteinogenic and non-proteinogenic, as prostate cancer biomarkers and their utility in classification of study participants have been assessed. Several metabolites, which deserve special attention in the further metabolomic investigations on searching for prostate cancer markers, were indicated. Moreover, free amino acid profiles enabled to classify samples to one of the studied groups with high sensitivity and specificity. The presented research provides a strong evidence that ethanolamine, arginine and branched-chain amino acids metabolic pathways can be a valuable source of markers for prostate cancer. The altered concentrations of the above-mentioned metabolites suggest their role in pathogenesis of prostate cancer and they should be further evaluated as clinically useful markers of prostate cancer.
Keywords: prostate cancer, amino acids, metabolomics, serum, urine.
Introduction
Prostate cancer is one of the most frequently diagnosed cancers and one of the main causes of death due to tumors in men [1-3]. Etiological agents of prostate cancer include sex, age, ethnicity, family history, genetic factors and lifestyle. However, mechanisms of carcinogenesis in the case of prostate cancer have not been fully elucidated yet [3]. Diagnosis of prostate cancer as well as the possibility of predicting the outcome for patients remain troublesome. Currently, early detection of prostate cancer involves mainly digital rectal examination (DRE) and testing of prostate-specific antigen (PSA) level in blood. However, over the years it became clear that PSA is not a specific biomarker of prostate cancer [4]. Elevated PSA level can be also caused by benign prostatic hyperplasia, prostatitis and prostate injury [5-7]. In view of the fact that benefits of prostate cancer screening based on the PSA testing do not outweigh harms associated with such tests, a panel of experts of the United States Preventive Services Task Force recommended in 2012 not to use PSA in screening for prostate cancer [8].
In order to reduce false positives in PSA testing and increase the accuracy of diagnosis, it is necessary to search for additional prostate cancer biomarkers. In recent years numerous findings dealing with the discovery of marker candidates, that could potentially improve the diagnosis of that condition and help to identify patients with aggressive prostate cancer, have been published. The proposed biomarkers belong to various classes of biological compounds, including proteins and metabolites [7, 9-13]. Since cancer cells are characterized by altered metabolic pathways, determination of low-molecular weight metabolites, such as free amino acids, in biological fluids can be a reduced invasive method associated to a high diagnostic potential [14]. It was found that free amino acid profiles vary depending on type of cancer and its stage [14-16]. However, in the case of prostate cancer the potential of amino acids as markers of that condition has not been explored enough so far and only articles about determination of the selected amino acids in body fluids and tissues of prostate cancer patients have been published. Miyagi et al. [16] determined the plasma free amino acid profiles in prostate cancer patients using HPLC-ESI-MS with pre-column derivatization. They analyzed 19 amino acids, mostly proteinogenic, and discovered significant differences in the profiles between the patients with prostate cancer and controls, suggesting the potential of amino acid profiling for improving prostate cancer screening. Shamsipur et al. [17] developed a method based on dispersive derivatization liquid-liquid microextraction combined with GC-MS and LC-MS/MS for the determination of several candidate prostate cancer biomarkers, including sarcosine, alanine, leucine and proline in urine. Heger et al. [18] used ion-exchange liquid chromatography to determine amino acid profiles in urine. 18 amino acids were analyzed with sarcosine being the only non-proteinogenic amino acid among them. Sarcosine is an N-methyl glycine metabolite. It is involved in methylation processes, occurring during the progression of prostate cancer, and in metabolism of amino acids [18]. Sarcosine was measured by isotope dilution GC-MS by Sreekumar et al. [10]. They demonstrated that it was highly increased during prostate cancer progression to metastasis and that it “may have the potential to identify patients with modestly increased PSA that are likely to have a positive prostate biopsy” [10]. They did not indicate sarcosine as a new non-invasive diagnostic biomarker of prostate cancer, they did however open a gate for other researchers who tried to study the potential role of that amino acid in prostate cancer diagnosis. The subsequent studies did not provide proof that urinary sarcosine can be used as a marker in prostate cancer detection [19-21]. The example of sarcosine and other metabolomic research show that free amino acids are the particularly interesting group of metabolites to study in prostate cancer. The analysis of their profiles in body fluids is a promising tool in search for prostate cancer diagnostic and prognostic biomarkers.
Several methods for amino acid determination have been applied, including cation-exchange liquid chromatography followed by post-column derivatization with ninhydrin and UV detection, reversed-phase high performance liquid chromatography with UV or fluorescence detection following pre-column derivatization [22, 23], high performance liquid chromatography-electrospray ionization-mass spectrometry [24], high performance liquid chromatography-electrospray ionization-tandem mass spectrometry [25-27], gas chromatography-electron impact ionization-mass spectrometry [28] and capillary electrophoresis-electrospray ionization-tandem mass spectrometry [29]. However, LC-ESI-MS/MS technique has been proven to measure amino acid levels with high sensitivity and specificity and requires short run time and thus it was selected in the presented study to analyze amino acid profiles [26, 27].
In this pilot study an attempt was made to use the complex analytical-bioinformatic strategy in the analysis of the endogenous compounds (free amino acids) in body fluids in search for diagnostic biomarkers of prostate cancer. The study was performed based on the modern analytical platform that uses the LC-ESI-MS/MS technique supported by the advanced chemometric analysis. The investigation was carried out using two various biofluids: serum and urine. The aim of the pilot study was to evaluate free amino acid profiles in serum and urine of patients with prostate cancer and healthy controls in order to see which metabolites from a broad spectrum of compounds express significant differences between two groups. Thus, the potential of free amino acids, both proteinogenic and non-proteinogenic, as prostate cancer biomarkers and their utility in classification of patients with prostate cancer and healthy individuals have been assessed. The study is the first which presents the comprehensive analysis of a wide range of free amino acids in two different body fluids obtained from prostate cancer patients and healthy men.
Methods
Study participants and sample collection
The investigation was performed with serum and urine samples derived from prostate cancer patients (n = 49) and a control group of healthy men (n = 40). All men participating in the study were acquainted with its aim and signed a written consent. The investigation has been approved by the Bioethical Commission of Poznan University of Medical Sciences by Decision no. 200/13. Prostate cancer patients were recruited among patients of the Ward of Urology, the Holy Family Hospital, Poznań, Poland. The criteria for the involvement to the prostate cancer group were the following: prostate cancer diagnosis based on DRE, transrectal ultrasonography and examination of biopsy tissue sample, no other coexisting cancers, no prostate cancer treatment. The control group consisted of healthy men with no cancer and no chronic diseases. They were recruited among men subjected to the routine periodic medical examination. The control group matched the prostate cancer group in terms of age, BMI and ethnicity (Caucasians). Characteristics of the prostate cancer group and the control group were summarized in Table 1. In order to overcome the potential effect of seasonal factors (primarily diet) on levels of metabolites, all samples were collected over a period of 3 months in 2013 and samples for both groups were collected in parallel. Moreover, all samples were representing the same local population of Poznań and its surroundings and can be characterized by sharing a similar lifestyle in regard to such factors as diet, smoking status, alcohol consumption and physical activity.
Characteristics of the prostate cancer group and the control group.
| Prostate cancer | Controls | ||
|---|---|---|---|
| No. of subjects | 49 | 40 | |
| Gleason score | Gleason 3 + 3 = 6 | 19 (38.8 %) | |
| Gleason 3 + 4 = 7 | 20 (40.8%) | ||
| Gleason 4 + 3 = 7 | 4 (8.2 %) | ||
| Gleason 4 + 4 = 8 | 4 (8.2 %) | ||
| Gleason 4 + 5 = 9 | 1 (2.0 %) | ||
| Gleason 5 + 4 = 9 | 1 (2.0 %) | ||
| Age [years] | Average | 67.7 | 61.3 |
| Median | 67 | 62.5 | |
| Minimum | 52 | 40 | |
| Maximum | 86 | 79 | |
| BMI [kg/m2] | Average | 27.5 | 27.2 |
| Median | 27.2 | 28.4 | |
| Minimum | 21.1 | 21.1 | |
| Maximum | 36.0 | 32.0 | |
| Smoking status | Yes | 9 (18.4 %) | 5 (12.5 %) |
| No | 40 (81.6 %) | 35 (87.5 %) | |
| Prostate cancer in family | Yes | 9 (18.4 %) | 5 (12.5 %) |
| No | 40 (81.6 %) | 35 (87.5 %) |
Prostate cancer patients were characterized in terms of an aggressiveness of the tumor using the Gleason grading system (Table 1). It was based on the assessment of the histological structure of tumor tissue by a pathologist.
Chemicals and reagents
The aTRAQ Kit for Amino Acid Analysis of Physiological Fluids was purchased from Sciex (Framingham, MA, USA). It consisted of amine-modifying labeling aTRAQ reagent Δ8, aTRAQ internal standard set of amino acids labeled with the aTRAQ reagent Δ0, 10 % sulfosalicylic acid, borate buffer of pH 8.5, 1.2 % hydroxylamine and mobile phase modifiers - formic acid and heptafluorobutyric acid. HPLC gradient grade methanol was purchased from J.T. Baker (Center Valley, PA, USA). Deionized water obtained from Millipore Simplicity UV water purification system (Waters Corporation, Milford, MA, USA) was used.
LC-ESI-MS/MS determination of amino acids
The analysis of free amino acid profiles in serum and urine was based on the LC-ESI-MS/MS technique and the aTRAQ reagent. The aTRAQ kit allows to quantify 42 free amino acids, both proteinogenic and non-proteinogenic, in a range of biological fluids. The analyses were performed using the liquid chromatography instrument 1260 Infinity (Agilent Technologies, Santa Clara, CA, USA) coupled to the 4000 QTRAP mass spectrometer (Sciex, Framingham, MA, USA) with an electrospray ion source. The detailed description of the applied LC-ESI-MS/MS methodology for amino acid determination was presented in Supplementary material.
The advantages of the applied method include high specificity, short time of analysis comparing to other methods of amino acids determination, low volume of biological sample required to perform the analysis (40 μl), high amount of analytes quantified in one analytical run and low limits of quantification (LOQ) [26, 27].
In order to normalize the content of amino acids in urine samples their concentrations were divided by creatinine concentration determined in the same urine sample.
Data processing and statistical analyses
Statistical analyses were performed using Statistica 10.0 (StatSoft, Kraków, Polska) software and MetaboAnalyst 3.0 web server (www.metaboanalyst.ca) [30]. In order to analyze the metabolomic data obtained in the performed studies, the univariate (Mann-Whitney U test, Student's t-test, Welch's F test, receiver operating characteristics (ROC) curve analysis) and multivariate (partial least squares - discriminant analysis (PLS-DA), ROC curve analysis, discriminant function analysis) statistical analyses were applied. As a first step of univariate analyses, the Shapiro-Wilk test of normality was used in order to examine the distribution shape of each variable. The Mann-Whitney U test was used for comparison between the prostate cancer group and the control group for variables not having a normal distribution. For variables with a normal distribution, the Levene's test and the Brown-Forsythe test were used in order to examine the equality of variances for the studied groups. In order to examine the differences between the groups, the Student's t-test was applied for variables with equal variances and the Welch's F test was used for variables with unequal variances. Before multivariate analyses data sets were subjected to normalization step by normalization by sum, logarithm transformation and auto scaling. ROC curves for the models of multiple variables were generated by Monte-Carlo cross validation. The variables in the analyses were the amino acid concentrations quantified in serum and urine samples. In all statistical analyses the values of p ≤ 0.05 was considered statistically significant.
Results
Serum amino acid profiles
LC-ESI-MS/MS analyses of serum samples
Free amino acid profiles in serum samples of prostate cancer patients (n = 49) and the control group of healthy men (n = 40) were obtained. However, not all amino acids occurred at measurable levels in the analyzed samples. In the case of serum samples, 32 amino acids were quantified in all samples and their concentrations were subjected to subsequent statistical analyses. The concentrations of amino acids in the analyzed serum samples were listed in Table 2. 4 amino acids (phosphoethanolamine, γ-amino-n-butyric acid, cystathionine and δ-hydroxylysine) were quantified in some serum samples, whereas in the rest of them their concentrations were below LOQ and they were not subjected to the subsequent analyses. 6 amino acids were below LOQ in all serum samples (phosphoserine, argininosuccinic acid, homocitrulline, anserine, carnosine and homocystine). The results obtained in amino acid profiling were subjected to univariate and multivariate statistical analyses in order to compare profiles of these endogenous compounds in serum of prostate cancer patients with those of the control group.
The quantified free amino acids in serum samples of two studied groups using the LC-ESI-MS/MS method. P values for the comparison of the variables between two groups were calculated according to Mann-Whitney U test, Student's t-test or Welch's F test. AUC values were obtained in univariate ROC curve analyses.
| Amino acid | Concentration in serum samples [µM] | p value | AUC | |||||
|---|---|---|---|---|---|---|---|---|
| The prostate cancer group (n = 49) | The control group (n = 40) | |||||||
| Average | Median | Range | Average | Median | Range | |||
| 1-methylhistidine | 5.1 | 2.0 | 0.3 - 44.7 | 6.0 | 4.6 | 0.7 - 24.8 | < 0.001 | 0.666 |
| 3-methylhistidine | 4.5 | 4.5 | 2.1 - 8.9 | 3.2 | 3.1 | 1.6 - 6.3 | 0.008 | 0.746 |
| alanine | 396.5 | 384.8 | 281.9 - 604.1 | 488.3 | 479.9 | 207.6 - 782.2 | < 0.001 | 0.734 |
| arginine | 71.5 | 67.4 | 47.9 - 110.4 | 95.0 | 87.7 | 58.3 - 180.1 | < 0.001 | 0.771 |
| asparagine | 39.0 | 38.7 | 26.5 - 55.1 | 44.3 | 43.7 | 27.7 - 63.4 | 0.001 | 0.700 |
| aspartic acid | 14.2 | 14.0 | 4.6 - 26.4 | 11.8 | 11.2 | 5.0 - 21.0 | 0.034 | 0.609 |
| citrulline | 26.1 | 24.6 | 10.4 - 54.2 | 26.9 | 27.8 | 7.4 - 45.2 | 0.271 | 0.569 |
| cystine | 12.9 | 2.6 | 1.0 - 56.0 | 4.3 | 2.7 | 1.0 - 30.5 | 0.488 | 0.542 |
| ethanolamine | 7.6 | 7.6 | 5.1 - 10.4 | 9.8 | 9.6 | 6.3 - 16.2 | < 0.001 | 0.793 |
| glutamic acid | 53.7 | 47.5 | 24.6 - 142.7 | 65.4 | 59.3 | 24.8 - 187.3 | 0.021 | 0.643 |
| glutamine | 407.8 | 404.0 | 303.8 - 509.1 | 496.3 | 488.1 | 333.6 - 734.3 | < 0.001 | 0.786 |
| glycine | 227.7 | 219.2 | 163.6 - 362.1 | 234.5 | 229.7 | 136.8 - 404.6 | 0.600 | 0.533 |
| histidine | 55.8 | 56.8 | 36.1 - 75.6 | 63.7 | 61.2 | 47.9 - 101.2 | 0.001 | 0.699 |
| hydroxyproline | 13.3 | 10.4 | 5.1 - 35.9 | 12.3 | 9.5 | 3.1 - 40.7 | 0.433 | 0.549 |
| isoleucine | 56.3 | 54.3 | 29.4 - 103.1 | 69.9 | 70.1 | 45.5 - 101.5 | < 0.001 | 0.778 |
| leucine | 101.6 | 100.0 | 59.1 - 163.4 | 124.7 | 125.5 | 77.6 - 189.0 | < 0.001 | 0.753 |
| lysine | 154.9 | 150.9 | 115.2 - 233.2 | 188.8 | 189.5 | 122.5 - 299.9 | < 0.001 | 0.748 |
| methionine | 16.9 | 16.7 | 10.6 - 28.9 | 23.7 | 22.5 | 14.3 - 36.3 | < 0.001 | 0.859 |
| ornithine | 79.3 | 81.1 | 32.4 - 139.5 | 92.9 | 85.4 | 46.7 - 158.4 | 0.054 | 0.619 |
| phenylalanine | 47.8 | 45.7 | 34.9 - 72.5 | 55.8 | 55.8 | 41.2 - 83.7 | < 0.001 | 0.758 |
| proline | 202.6 | 191.0 | 101.1 - 413.9 | 188.8 | 183.5 | 98.9 - 311.3 | 0.417 | 0.550 |
| sarcosine | 1.7 | 1.4 | 0.6 - 5.6 | 1.2 | 1.2 | 0.2 - 3.0 | 0.006 | 0.675 |
| serine | 126.4 | 128.5 | 84.9 - 174.7 | 121.7 | 117.4 | 78.2 - 199.1 | 0.396 | 0.575 |
| taurine | 115.1 | 117.2 | 32.7 - 174.5 | 105.6 | 105.5 | 48.0 - 232.1 | 0.073 | 0.611 |
| threonine | 102.1 | 106.0 | 53.4 - 168.0 | 100.6 | 95.5 | 62.6 - 152.3 | 0.754 | 0.542 |
| tryptophan | 41.2 | 40.3 | 27.1 - 60.2 | 44.9 | 43.4 | 30.3 - 67.4 | 0.083 | 0.608 |
| tyrosine | 40.6 | 38.8 | 25.1 - 68.9 | 43.6 | 41.8 | 26.5 - 68.7 | 0.180 | 0.585 |
| valine | 222.8 | 220.9 | 139.9 - 328.6 | 236.8 | 232.6 | 161.9 - 307.6 | 0.112 | 0.591 |
| α-aminoadipic acid | 1.0 | 0.9 | 0.3 - 2.5 | 1.0 | 0.9 | 0.5 - 2.0 | 0.817 | 0.524 |
| α-amino-n-butyric acid | 20.9 | 18.9 | 6.6 - 46.1 | 24.1 | 23.6 | 13.1 - 42.8 | 0.009 | 0.660 |
| β-alanine | 21.5 | 18.7 | 4.4 - 54.3 | 15.6 | 14.2 | 5.9 - 45.1 | 0.013 | 0.654 |
| β-aminoisobutyric acid | 2.0 | 1.7 | 0.7 - 7.3 | 1.9 | 1.8 | 0.8 - 4.2 | 0.843 | 0.510 |
Univariate statistical analyses
The performed univariate statistical analyses allowed to indicate which variables (amino acids) had different levels in samples obtained from prostate cancer patients compared to the control group. In the case of serum, statistically significant differences were found in the case of 18 of 32 quantified amino acids, among which 4 were present at significantly higher levels in the prostate cancer group (in order from the lowest to the highest p value, from p = 0.006 to p = 0.034: sarcosine, 3-methylhistidine, β-alanine and aspartic acid), while 14 occurred at significantly lower levels in the prostate cancer group comparing to the control group (i.a. methionine, ethanolamine, glutamine, isoleucine, arginine and leucine, all of them with p < 0.00002) (Table 2).
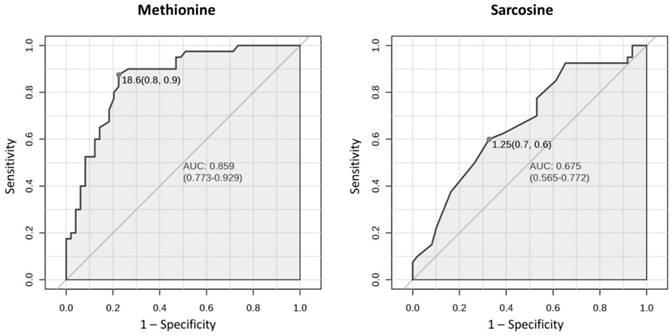
Univariate ROC curve analyses give the possibility to assess the accuracy of the classification of an individual variable. The results indicated that in the case of serum, 7 amino acids with a high area under the curve (AUC) above 0.75 were: methionine (AUC 0.859), ethanolamine, glutamine, isoleucine, arginine, phenylalanine and leucine, whereas AUC for sarcosine was 0.675 (Table 2). Figure 1 presents ROC curves for two amino acids in serum: methionine (amino acid with the highest AUC) and sarcosine.
Univariate ROC curves for methionine and sarcosine in serum with AUC values and 95 % confidence intervals of AUC (in brackets). Grey dots refer to the optimal cutoffs, for which specificity and sensitivity are given in brackets.
Multivariate statistical analyses
The results of univariate statistical analyses suggest that patients with prostate cancer and healthy men can be discriminated using multivariate statistical analyses, which involve set of variables (at least two) simultaneously and aim to search for patterns and relationships between variables in order to create the best classification and discrimination models.
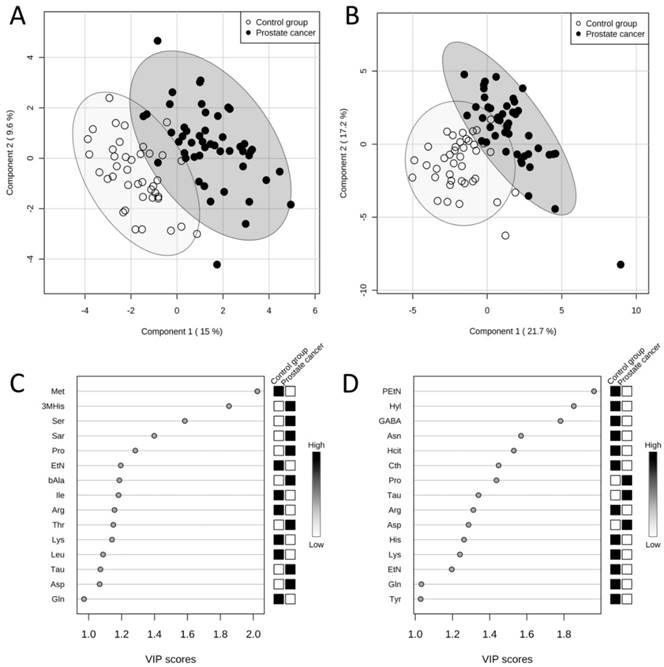
The results obtained from PLS-DA of amino acid levels in serum showed a clear grouping of patients according to the assignment of the sample to one of the studied groups (Figure 2A). According to the variable importance in projection (VIP) scores, amino acids which were the most significant in the classification of patients (the higher VIP score) in the case of serum samples were the following: methionine, 3-methylhistidine, serine, sarcosine and proline (Figure 2C). The model obtained was validated with permutation tests. In order to do it, the whole analysis was repeated 2000 times but with random group labels. Then the results were compared with those for proper labels. The reliability of model for serum samples was proven by p < 0.0005.
Results of PLS-DAs of free amino acid profiles. Score plots between first and second latent variables (with explained variances shown in brackets) obtained in PLS-DAs of free amino acid profiles in serum (A) and urine (B) in two studied groups: the prostate cancer group (n = 49, black dots) and the control group (n = 40, white dots). Variable importance in projection (VIP) scores in PLS-DAs of free amino acid profiles in serum (C) and urine (D) in two studied groups: the prostate cancer group (n = 49) and the control group (n = 40). VIP scores for 15 amino acids with the highest contribution of to the separation of the studied groups are presented. The boxes on the right refer to the relative concentrations of the appropriate amino acid in the studied groups. 3MHis - 3-methylhistidine, Arg - arginine, Asn - asparagine, Asp - aspartic acid, bAla - β-alanine, Cth - cystathionine, EtN - ethanolamine, GABA - γ-amino-n-butyric acid, Gln - glutamine, Hcit - homocitrulline, His - histidine, Hyl - δ-hydroxylysine, Ile - isoleucine, Leu - leucine, Lys - lysine, Met - methionine, PEtN - phosphoethanolamine, Pro - proline, Sar - sarcosine, Ser - serine, Tau - taurine, Thr - threonine, Tyr - tyrosine.
The performed forward stepwise discriminant function analysis involved step-by-step building of a discrimination model. Only part of the samples were used to build the model, randomly chosen from the studied groups. Those samples constituted a training set, which consisted of 30 samples of the prostate cancer group and 25 samples of the control group, representing 61.2 % and 62.5 % of the size of the studied groups, respectively. The remaining samples (19 samples of the prostate cancer group and 15 samples of the control group) constituted a test set, used for the external validation of the model. The results of discriminant function analysis for amino acid concentrations in serum samples demonstrated that the set of predictors was effective in predicting group membership. The sensitivity and specificity values for the model were calculated based on the post-hoc classification matrix. The model correctly predicted the presence of prostate cancer in the case of 13 of 19 patients with diagnosed tumor in the test set (sensitivity of 68.42 %) and correctly predicted the absence of prostate cancer in the case of all of 15 healthy men in the test set (specificity of 100.00 %). Overall, the health status was correctly predicted in the case of 28 of 34 participants in the test set (total group membership classification value of 82.35 %).
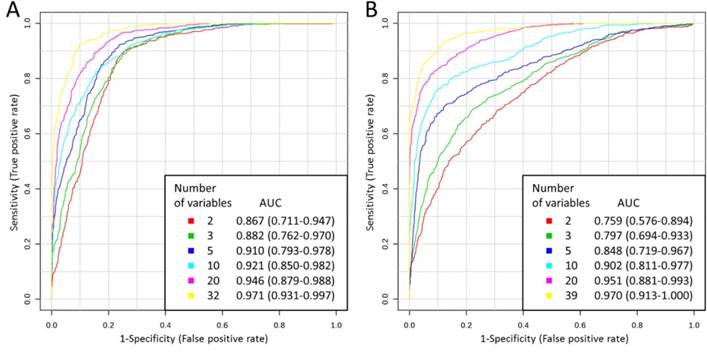
The utility of free amino acid profiles in the classification of the study participants was also analyzed using multivariate ROC curve analyses. For each model, two thirds of the samples were used to assess the importance of the features (amino acids). Then, the most important features were used to generate classification models. In the case of serum, 2, 3, 5, 10, 20 and 32 features were used, resulting in six models for that physiological fluid. The models were validated on the remaining one third of the samples. The whole procedure was repeated multiple times. The results indicated that the frequency with which the variables appeared in the models corresponded to the VIP scores for these variables obtained in PLS-DA. For each model, ROC curve was averaged from all Monte-Carlo cross validation runs (Figure 3A). A clear trend can be observed that ROC curves built using higher number of variables lie closer to the (0,1) point of the coordinate system, which is also reflected in the increasing AUC: from 0.867 for 2 variables to 0.971 for 32 variables. Thus, the more variables in the model, the better the classification model was. Predictive accuracy was determined for each model, which also allowed to compare different classification models (Table 4). The results correspond to those obtained by comparing the AUC and ROC curve shapes: predictive accuracy increased with the higher number of variables: from 80.6 % for 2 variables to 89.7 % for 32 variables.
Multivariate ROC curves obtained for serum (A) and urine (B) for models built using various number of variables with AUC values and 95 % confidence intervals of AUC (in brackets).
According to additional PLS-DA of amino acid levels in serum, there were no significant differences in amino acid profiles between patients representing various Gleason scores.
Urine amino acid profiles
LC-ESI-MS/MS analyses of urine samples
Free amino acid profiles in urine samples were obtained for the same study participants and using the same method as free amino acid profiles in serum samples. In the case of urine samples, 39 amino acids were quantified in all samples and their concentrations were subjected to consecutive statistical analyses. 2 amino acids (anserine and homocystine) were quantified in some urine samples only and they were not subjected to subsequent analyses. 1 amino acid was below LOQ in all urine samples (phosphoserine). Table 3 presents concentrations of amino acids determined in urine after normalization to the urinary creatinine concentration.
The quantified free amino acids in urine samples of two studied groups using the LC-ESI-MS/MS method. P values for the comparison of the variables between two groups were calculated according to Mann-Whitney U test, Student's t-test or Welch's F test. AUC values were obtained in univariate ROC curve analyses.
| Amino acid | Concentration in urine samples [10 µM amino acid / M creatinine] | p value | AUC | |||||
|---|---|---|---|---|---|---|---|---|
| The prostate cancer group (n = 49) | The control group (n = 40) | |||||||
| Average | Median | Range | Average | Median | Range | |||
| 1-methylhistidine | 2516.9 | 1138.7 | 124.6 - 16491.3 | 4777.7 | 2731.4 | 138.0 - 24075.1 | 0.010 | 0.660 |
| 3-methylhistidine | 1558.8 | 1525.9 | 364.0 - 3190.0 | 2147.8 | 1841.4 | 764.3 - 6658.4 | 0.004 | 0.679 |
| alanine | 2270.2 | 1573.1 | 266.5 - 7452.4 | 2501.1 | 1997.5 | 477.5 - 7384.6 | 0.523 | 0.540 |
| arginine | 161.5 | 100.4 | 21.6 - 952.3 | 278.2 | 238.9 | 69.6 - 878.5 | < 0.001 | 0.831 |
| argininosuccinic acid | 111.5 | 85.1 | 16.7 - 451.0 | 108.2 | 87.6 | 38.3 - 288.6 | 0.695 | 0.524 |
| asparagine | 637.7 | 604.3 | 123.4 - 1620.4 | 1018.5 | 900.7 | 392.8 - 2804.3 | < 0.001 | 0.773 |
| aspartic acid | 22.0 | 19.0 | 2.3 - 69.2 | 17.3 | 10.6 | 4.1 - 76.3 | 0.165 | 0.587 |
| carnosine | 118.5 | 65.3 | 3.8 - 1101.0 | 125.8 | 86.9 | 18.6 - 560.4 | 0.316 | 0.562 |
| citrulline | 42.3 | 29.2 | 5.7 - 167.3 | 62.0 | 47.0 | 11.3 - 422.3 | 0.008 | 0.664 |
| cystathionine | 97.6 | 96.3 | 4.9 - 269.4 | 279.9 | 162.2 | 37.3 - 1923.2 | < 0.001 | 0.764 |
| cystine | 400.7 | 349.2 | 38.3 - 1816.3 | 584.8 | 445.1 | 189.0 - 2385.6 | 0.003 | 0.685 |
| ethanolamine | 2440.2 | 2597.8 | 847.0 - 4838.3 | 4103.6 | 3800.6 | 2021.2 - 7776.4 | < 0.001 | 0.858 |
| glutamic acid | 89.0 | 83.1 | 12.5 - 239.8 | 145.3 | 114.1 | 38.3 - 623.5 | 0.002 | 0.692 |
| glutamine | 2781.4 | 2677.3 | 97.0 - 6676.7 | 4238.6 | 3889.5 | 1505.0 - 10003.7 | < 0.001 | 0.736 |
| glycine | 8527.7 | 7533.5 | 1050.8 - 19514.0 | 10731.4 | 8648.7 | 2952.8 - 44161.0 | 0.148 | 0.590 |
| histidine | 3829.7 | 3060.1 | 119.2 - 9470.3 | 5773.9 | 5603.4 | 2142.9 - 12610.5 | 0.001 | 0.712 |
| homocitrulline | 120.4 | 122.9 | 19.0 - 338.8 | 275.7 | 196.5 | 67.7 - 1136.1 | < 0.001 | 0.839 |
| hydroxyproline | 31.2 | 13.5 | 1.9 - 167.4 | 43.8 | 17.1 | 3.1 - 387.0 | 0.243 | 0.572 |
| isoleucine | 93.9 | 81.0 | 13.9 - 267.2 | 124.8 | 101.1 | 49.0 - 367.8 | 0.008 | 0.664 |
| leucine | 218.1 | 188.0 | 31.9 - 708.1 | 283.5 | 237.7 | 120.6 - 681.7 | 0.005 | 0.673 |
| lysine | 905.5 | 423.1 | 51.3 - 7879.6 | 1684.3 | 1047.9 | 262.8 - 10773.2 | < 0.001 | 0.738 |
| methionine | 63.6 | 58.1 | 2.8 - 184.6 | 96.7 | 86.4 | 37.1 - 212.6 | < 0.001 | 0.764 |
| ornithine | 124.2 | 104.9 | 12.5 - 427.9 | 186.9 | 146.4 | 49.1 - 689.9 | 0.002 | 0.689 |
| phenylalanine | 338.2 | 280.8 | 43.0 - 997.0 | 476.7 | 364.0 | 215.3 - 1089.0 | 0.001 | 0.708 |
| phosphoethanolamine | 113.5 | 97.9 | 7.2 - 299.7 | 308.3 | 263.6 | 41.2 - 1313.6 | < 0.001 | 0.879 |
| proline | 91.1 | 79.3 | 11.8 - 288.7 | 83.4 | 60.8 | 21.9 - 287.4 | 0.188 | 0.581 |
| sarcosine | 12.7 | 7.3 | 0.8 - 101.5 | 19.2 | 11.5 | 2.5 - 80.6 | 0.056 | 0.619 |
| serine | 2843.2 | 2513.9 | 512.9 - 5925.1 | 3527.1 | 3108.8 | 1180.9 - 7353.6 | 0.018 | 0.646 |
| taurine | 6605.8 | 5836.1 | 560.5 - 16462.5 | 6227.6 | 3790.1 | 931.5 - 40322.8 | 0.032 | 0.633 |
| threonine | 957.9 | 691.1 | 47.1 - 3227.7 | 1016.9 | 920.3 | 377.0 - 2323.3 | 0.145 | 0.590 |
| tryptophan | 466.9 | 414.5 | 37.4 - 1159.9 | 665.2 | 547.3 | 272.7 - 1631.4 | 0.002 | 0.689 |
| tyrosine | 537.6 | 438.8 | 34.7 - 1372.7 | 820.2 | 642.5 | 350.1 - 2369.7 | < 0.001 | 0.723 |
| valine | 342.2 | 301.9 | 44.4 - 1033.9 | 366.8 | 324.5 | 164.8 - 970.4 | 0.274 | 0.568 |
| α-aminoadipic acid | 212.6 | 151.7 | 4.2 - 584.3 | 312.3 | 253.8 | 111.8 - 1034.0 | 0.001 | 0.704 |
| α-amino-n-butyric acid | 110.1 | 105.9 | 2.8 - 237.2 | 114.3 | 106.6 | 23.2 - 253.4 | 0.689 | 0.525 |
| β-alanine | 288.5 | 162.0 | 13.7 - 3113.6 | 237.1 | 173.1 | 26.1 - 1385.6 | 0.898 | 0.508 |
| β-aminoisobutyric acid | 1639.6 | 866.2 | 209.9 - 9144.3 | 1716.0 | 871.6 | 115.0 - 9943.9 | 0.795 | 0.516 |
| γ-amino-n-butyric acid | 12.6 | 12.2 | 3.8 - 33.1 | 30.3 | 29.4 | 1.3 - 62.4 | < 0.001 | 0.932 |
| δ-hydroxylysine | 28.4 | 21.1 | 5.7 - 161.7 | 102.2 | 47.7 | 13.1 - 898.7 | < 0.001 | 0.796 |
Univariate statistical analyses
Univariate statistical analyses of the results obtained in urine amino acid profiling were performed analogously to those regarding serum samples and also allowed to indicate which variables had different levels in samples obtained from prostate cancer patients compared to healthy men. In the case of urine, the levels of 26 of 39 amino acids differed significantly, among which one (taurine, p = 0.032) was present at significantly higher level in the prostate cancer group, while 25 occurred at significantly lower levels in the prostate cancer group comparing to the control group (i.a. γ-amino-n-butyric acid, phosphoethanolamine, ethanolamine, homocitrulline, arginine, δ-hydroxylysine and asparagine, all of them with p < 0.00002) (Table 3). Statistically significant differences in the concentrations of urinary sarcosine between the group of prostate cancer patients and the control group were not observed.
The results of univariate ROC curve analyses indicated that in the case of urine, 9 amino acids with high AUC above 0.75 were: γ-amino-n-butyric acid (AUC 0.932), phosphoethanolamine, ethanolamine, homocitrulline, arginine, δ-hydroxylysine, asparagine, cystathionine and methionine (Table 3).
Multivariate statistical analyses
Similarly, as in the case of PLS-DA of amino acid levels in serum, in PLS-DA of amino acid levels in urine a good separation of the prostate cancer group and the control group was also attained (Figure 2B). According to the VIP scores, five amino acids with the biggest contribution to the model were the following: phosphoethanolamine, δ-hydroxylysine, γ-amino-n-butyric acid, asparagine and homocitrulline (Figure 2D). The model obtained for urine amino acid profiles was validated with permutation tests and reliability of the model for urine samples was proven by p < 0.0005.
Forward stepwise discriminant function analysis for urine was performed using the training and test sets of the same size as for serum. The results of discriminant function analysis for amino acid concentrations in urine samples showed the effectiveness of amino acids in predicting group membership. The sensitivity and specificity in the test set were 89.47 % and 73.33 %, respectively, whereas the total group membership classification value was 82.35 %.
Multivariate ROC curve analyses for amino acid profiles in urine were also performed, analogously as in the case of serum. In the case of urine, 2, 3, 5, 10, 20 and 39 most important features were used to generate classification models, resulting in six models for that biofluid. ROC curves built using increasing number of variables resulted in the increasing AUC: from 0.759 for 2 variables to 0.970 for 39 variables in the case of urine (Figure 3B). Table 4 presents predictive accuracies determined for each model. Predictive accuracy increased with the higher number of variables: from 68.8 % for 2 variables to 91.3 % for 39 variables in the case of urine.
Predictive accuracies obtained for serum and urine for models built using various number of variables in multivariate ROC curve analyses.
| Number of variables | Predictive accuracy [%] | |
|---|---|---|
| Amino acids in serum samples | Amino acids in urine samples | |
| 2 | 80.6 | 68.8 |
| 3 | 80.2 | 73.1 |
| 5 | 83.1 | 78.4 |
| 10 | 83.0 | 83.6 |
| 20 | 86.2 | 88.1 |
| 32 | 89.7 | - |
| 39 | - | 91.3 |
Additional PLS-DA of amino acid levels in urine was performed in order to see whether there were differences in amino acid profiles between patients representing various Gleason scores. Similarly, as in the case of serum, no significant differences were observed.
Discussion
The performed pilot study confirmed that amino acids represent a group of metabolites which has a high potential of use as prostate cancer biomarkers and can improve prostate cancer screening. The article is the first which presents the comprehensive analysis of a wide panel of amino acids in two different body fluids obtained from the same groups of prostate cancer patients and healthy men. 42 amino acids, both proteinogenic and non-proteinogenic, were analyzed in one analytical run in serum and urine. Till now, only results on determination of selected amino acids in a given body fluid of prostate cancer patients have been published. In the earlier studies, the maximum number of quantified amino acids in the selected biofluid taken from prostate cancer group was 19 and those studies were usually focused on proteinogenic amino acids [16-18, 31]. However, the example of sarcosine indicated that non-proteinogenic amino acids can also play a role in prostate cancer pathogenesis and may contribute to improvement of its detection. The above-mentioned studies are examples of targeted analyses. Prostate cancer has been also studied using metabolomic profiling in order to have an insight into the entire measurable metabolome [10, 14, 21, 32-37]. Multiple metabolites were identified in such untargeted approach, including many amino acids. We decided to focus on targeted analysis of amino acids in order to collect information on concentrations of metabolites of that group in prostate cancer.
Since the number of samples analyzed in our study is limited (49 prostate cancer patients and 40 controls), it should be considered as a pilot study. Nevertheless, the presented research allowed to verify the outcomes of previously conducted studies on amino acid profile abnormalities in prostate cancer and also provided new data on levels of several amino acids not examined in prostate cancer biomarker investigations so far, such as δ-hydroxylysine, homocitrulline, 1-methylhistidine and 3-methylhistidine. However, in the case of 1- and 3-methylhistidine we cannot exclude the possibility that levels of those two metabolites are related to differences in meat consumption between the prostate cancer group and the control group, even though both groups were sharing a similar lifestyle. Urinary excretion of 1- and 3-methylhistidine was found elevated with increasing meat intake by Cross et al. [38].
The obtained results proved that prostate cancer causes noticeable changes in free amino acid profiles in serum and urine. Among the analyzed compounds, more amino acids occurred at measureable levels in urine comparing to serum (Tables 2 and 3). In addition, more compounds were present at significantly altered levels in urine comparing to serum. Amino acid concentrations in serum were correlated with concentrations of the appropriate compounds in urine to a high extent: in the case of 24 of 32 amino acids quantified in both body fluids the increase or decrease of level of the given metabolite in serum of prostate cancer patients compared with the control group was associated with the same change of level of that metabolite in urine.
The results obtained allow to propose future directions of research. It can be suggested that while searching for serum prostate cancer biomarkers special attention should be paid to the following compounds: methionine, ethanolamine, glutamine, isoleucine, arginine and leucine, among which ethanolamine is a non-proteinogenic compound. In the case of urine, potential prostate cancer biomarkers may represent the following metabolites: γ-amino-n-butyric acid, phosphoethanolamine, ethanolamine, homocitrulline, arginine, δ-hydroxylysine and asparagine, among which only arginine and asparagine are proteinogenic amino acids. However, simultaneous analysis of the wide panel of amino acids should be also considered since statistical models built using a higher number of variables are able to discriminate samples with higher overall accuracy, as it was demonstrated in multivariate ROC curve analyses (Figure 3, Table 4). It should be considered that biomarker does not have to be a single compound. It is hoped that a multi-compound panel of markers can improve diagnosis of prostate cancer. There is in fact a post-DRE Prostarix urine test available (Bostwick Laboratories) [39]. It is based on a panel of four amino acids: sarcosine, alanine, glycine and glutamic acid quantified using liquid chromatography-mass spectrometry and its aim is to increase confidence in deciding whether to perform the prostate biopsy.
Based on the performed multivariate statistical analyses it was demonstrated that abnormalities in amino acids profiles caused by the presence of prostate cancer are useful in classification of prostate cancer patients and healthy men with high sensitivity and specificity, both in serum and urine. Results of discriminant function analyses indicated that higher sensitivity was achieved for the model built using amino acid concentrations in urine samples (89.47 %) comparing to the model generated using amino acid concentrations in serum samples (68.42 %), while in the case of serum the specificity was higher (100.00 %) comparing to the specificity in urine (73.33 %). However, the total group membership classification values for serum and urine samples were the same (82.35 %). Predictive accuracies obtained from multivariate ROC curve analyses indicated that, in the case of lower number of variables in the models, amino acids in serum were better in classification of samples than amino acids in urine (Table 4). However, in the case of higher number of variables in the models, predictive accuracies of urine amino acid profiles were higher than of serum amino acid profiles. In conclusion, it is hard to say which of the body fluids would benefit more in terms of classification parameters in screening for prostate cancer. In addition, the obtained results of AUC demonstrated that the achieved classification was better than in the case of research of Miyagi et al. [16]. They discovered significant differences in the plasma amino acid profiles between prostate cancer patients and healthy controls which allowed to discriminate the two groups using multivariate ROC curve analysis with AUC of 0.783. In our study AUC value obtained for 2 variables was 0.867 and increased to 0.971 for 32 variables in the case of serum (Figure 3).
Based on the results of the presented studies the role of the non-proteinogenic amino acid sarcosine as a potential prostate cancer biomarker has been rejected. The concentration of sarcosine in the analyzed serum samples was significantly higher in the prostate cancer group comparing to the control group (Table 2). This may suggest its utility as the marker of prostate cancer. However, AUC for sarcosine in univariate ROC curve analysis was 0.675 (Table 2, Figure 1), suggesting its limited utility in the classification of serum samples to the prostate cancer or control group. Multiple other amino acids had higher ability to discriminate samples and thus are better candidates for prostate cancer biomarkers. In terms of detecting prostate cancer, sarcosine can only be considered as one of the variables in a panel of serum metabolites due to its high VIP score (Figure 2C). Still, the results obtained for sarcosine in serum samples suggest its role in etiology of prostate cancer. The difference in concentration of sarcosine in the analyzed urine samples after creatinine normalization between the prostate cancer group and the control group was not statistically significant (Table 3). It means that sarcosine has to be rejected as urinary biomarker of prostate cancer. Although it was shown in 2009 by Sreekumar et al. [10] that sarcosine may play important roles in progression of prostate cancer, the metabolite failed in terms of potential utility in clinical practice in detection of prostate cancer, as demonstrated by this study and also by others [19-21].
The conducted analyses revealed statistically significant lower levels of leucine and isoleucine, and lower average levels of valine in both serum and urine of men with prostate cancer (Tables 2 and 3). Leucine, isoleucine and valine constitute a group of branched-chain amino acids (BCAA). Our findings on lower concentrations of BCAA in biofluids of the prostate cancer group are consistent with results of Miyagi et al. [16], who found a decreased plasma level of leucine in the case of prostate cancer, and also complement with the study reported by Teahan et al. [40]. The results of our study suggest that BCAA metabolic pathways can be a valuable source of diagnostic and prognostic markers for prostate cancer.
Another metabolite, which occurred at lower concentration in biofluids of prostate cancer patients relative to healthy men, was ethanolamine (Tables 2 and 3). The difference in the level of ethanolamine was one of the most statistically significant among all measured metabolites, both in serum and urine. In fact, ethanolamine is not an amino acid, but a primary amine and a primary alcohol. That compound is one of the main precursors and degradation products of the phospholipid membrane. Swanson et al. [41] also reported the relation between ethanolamine and the presence of prostate cancer. They analyzed prostate tissues and observed that in the case of prostate cancer the concentration of ethanolamine was significantly lower. Since ethanolamine, ethanolamine-containing metabolites and other phospholipid membrane precursors contain the information about various processes occurring in the organism (cellular proliferation, apoptosis, activity of enzymes), there is an interest in correlating them with the presence and aggressiveness of cancer, as well as with the response to treatment [41].
Together with ethanolamine, arginine was another compound, for which in both serum and urine the levels differed the most significantly among other metabolites. The concentrations of arginine were decreased in both physiological fluids in the group of prostate cancer patients (Table 2 and 3). Arginine is used not only in protein synthesis, but is also involved in urea cycle, biosyntheses of creatine, polyamine, and serves as a crucial substrate for enzymes such as the nitric oxide (NO) synthases [42, 43]. As the nitrogen donor in NO synthesis, arginine is linked to inflammation processes, neurotransmission and vasodilation. For that reasons, NO is known to play a role in cancer [42]. Significant decrease in arginine concentration in body fluids of patients with prostate cancer may result from both decrease in arginine synthesis and increase in its degradation. The first process is probably due to down-regulation of ornithine carbamoyl transferase in cancer tissue [42]. On the other hand, increase in arginine degradation leads to NO production and may contribute to NO-dependent vasculature of prostate cancer tissue, growth of tumor, metastasis and poor prognosis of the disease [44]. The change of arginine levels in biofluids suggests its role in pathogenesis of prostate cancer and it is also in concordance with results of Miyagi et al. [16]. Depletion of arginine is a promising anti-cancer treatment strategy and recombinant human arginase has been tested for arginine deprivation therapy in cancer. It was demonstrated by Hsueh et al. [45] that the enzyme is a promising novel agent for treatment of prostate cancer.
Conclusions
The presented pilot study is the first comprehensive analysis of a wide panel of 42 proteinogenic and non-proteinogenic amino acids in two different physiological fluids obtained from the same groups of prostate cancer patients and healthy men. While sarcosine was rejected as a marker of prostate cancer, other metabolites were indicated which deserve special attention in searching for new prostate cancer biomarkers, many of which belong to non-proteinogenic amino acids. The presented research provides a strong evidence that ethanolamine, arginine and BCAA metabolic pathways can be a valuable source of markers for prostate cancer. The altered concentrations of the above-mentioned metabolites suggest its role in pathogenesis of prostate cancer and should be further evaluated as clinically useful markers of prostate cancer.
Abbreviations
AUC: area under the curve; BCAA: branched-chain amino acids; DRE: digital rectal examination; GC-MS: gas chromatography-mass spectrometry; HPLC-ESI-MS: high performance liquid chromatography-electrospray ionization-mass spectrometry; LC-ESI-MS/MS: liquid chromatography-electrospray ionization-tandem mass spectrometry; LC-MS/MS: liquid chromatography-tandem mass spectrometry; LOQ: limit of quantification; NO: nitric oxide; PLS-DA: partial least squares - discriminant analysis; PSA: prostate-specific antigen; ROC: receiver operating characteristics; VIP: variable importance in projection.
Supplementary Material
Supplementary table.
Acknowledgements
The project was supported by National Science Centre, Poland (UMO-2014/15/B/NZ7/00964). Dr. Paweł Dereziński received support for preparing the PhD thesis from National Science Centre in Poland within the frame of the doctoral scholarship financing based on the decision no. DEC-2014/12/T/NZ7/00544.
Competing Interests
The authors have declared that no competing interest exists.
References
1. Liu Y, Hegde P, Zhang F, Hampton G, Jia S. Prostate cancer - a biomarker perspective. Front Endocrinol (Lausanne). 2012;3:72
2. Jemal A, Bray F, Center MM, Ferlay J, Ward E, Forman D. Global cancer statistics. CA Cancer J Clin. 2011;61:69-90
3. Nakagawa H, Akamatsu S, Takata R, Takahashi A, Kubo M, Nakamura Y. Prostate cancer genomics, biology, and risk assessment through genome-wide association studies. Cancer Sci. 2012;103:607-13
4. Postma R, Schroder FH. Screening for prostate cancer. Eur J Cancer. 2005;41:825-33
5. Pavlou M, Diamandis EP. The search for new prostate cancer biomarkers continues. Clin Chem. 2009;55:1277-9
6. Bohm L, Serafin AM, Fernandez P, Van der Watt G, Bouic PJ, Harvey J. Plasma sarcosine does not distinguish early and advanced stages of prostate cancer. S Afr Med J. 2012;102:677-9
7. Velonas VM, Woo HH, dos Remedios CG, Assinder SJ. Current status of biomarkers for prostate cancer. Int J Mol Sci. 2013;14:11034-60
8. Moyer VA, Force USPST. Screening for prostate cancer: U.S. Preventive Services Task Force recommendation statement. Ann Intern Med. 2012;157:120-34
9. Spratlin JL, Serkova NJ, Eckhardt SG. Clinical applications of metabolomics in oncology: a review. Clin Cancer Res. 2009;15:431-40
10. Sreekumar A, Poisson LM, Rajendiran TM, Khan AP, Cao Q, Yu J. et al. Metabolomic profiles delineate potential role for sarcosine in prostate cancer progression. Nature. 2009;457:910-4
11. Trock BJ. Application of metabolomics to prostate cancer. Urol Oncol. 2011;29:572-81
12. Kim Y, Kislinger T. Novel approaches for the identification of biomarkers of aggressive prostate cancer. Genome Med. 2013;5:56
13. Rigau M, Olivan M, Garcia M, Sequeiros T, Montes M, Colás E. et al. The Present and Future of Prostate Cancer Urine Biomarkers. Int J Mol Sci. 2013;14:12620-49
14. Thapar R, Titus MA. Recent Advances in Metabolic Profiling And Imaging of Prostate Cancer. Curr Metabolomics. 2014;2:53-69
15. Lai HS, Lee JC, Lee PH, Wang ST, Chen WJ. Plasma free amino acid profile in cancer patients. Semin Cancer Biol. 2005;15:267-76
16. Miyagi Y, Higashiyama M, Gochi A, Akaike M, Ishikawa T, Miura T. et al. Plasma free amino acid profiling of five types of cancer patients and its application for early detection. PLoS One. 2011;6:e24143
17. Shamsipur M, Naseri MT, Babri M. Quantification of candidate prostate cancer metabolite biomarkers in urine using dispersive derivatization liquid-liquid microextraction followed by gas and liquid chromatography-mass spectrometry. J Pharm Biomed Anal. 2013;81-82:65-75
18. Heger Z, Cernei N, Gumulec J, Masarik M, Eckschlager T, Hrabec R. et al. Determination of common urine substances as an assay for improving prostate carcinoma diagnostics. Oncol Rep. 2014;31:1846-54
19. Jentzmik F, Stephan C, Miller K, Schrader M, Erbersdobler A, Kristiansen G. et al. Sarcosine in Urine after Digital Rectal Examination Fails as a Marker in Prostate Cancer Detection and Identification of Aggressive Tumours. Eur Urol. 2010;58:12-18
20. Colleselli D, Stenzl A, Schwentner C. Re: Florian Jentzmik, Carsten Stephan, Kurt Miller, et al. Sarcosine in Urine after Digital Rectal Examination Fails as a Marker in Prostate Cancer Detection and Identification of Aggressive Tumours. Eur Urol. 2010; 58: 12-8. Eur Urol. 2010;58:E51
21. Wu H, Liu TT, Ma CG, Xue RY, Deng CH, Zeng HZ. et al. GC/MS-based metabolomic approach to validate the role of urinary sarcosine and target biomarkers for human prostate cancer by microwave-assisted derivatization. Anal Bioanal Chem. 2011;401:635-46
22. Bartolomeo MP, Maisano F. Validation of a reversed-phase HPLC method for quantitative amino acid analysis. J Biomol Tech. 2006;17:131-7
23. Poschke I, Mao Y, Kiessling R, de Boniface J. Tumor-dependent increase of serum amino acid levels in breast cancer patients has diagnostic potential and correlates with molecular tumor subtypes. J Transl Med. 2013;11:290
24. Shimbo K, Kubo S, Harada Y, Oonuki T, Yokokura T, Yoshida H. et al. Automated precolumn derivatization system for analyzing physiological amino acids by liquid chromatography/mass spectrometry. Biomed Chromatogr. 2010;24:683-91
25. Shimbo K, Oonuki T, Yahashi A, Hirayama K, Miyano H. Precolumn derivatization reagents for high-speed analysis of amines and amino acids in biological fluid using liquid chromatography/electrospray ionization tandem mass spectrometry. Rapid Commun Mass Spectrom. 2009;23:1483-92
26. Matysiak J, Derezinski P, Klupczynska A, Matysiak J, Kaczmarek E, Kokot ZJ. Effects of a honeybee sting on the serum free amino acid profile in humans. PLoS One. 2014;9:e103533
27. Held PK, White L, Pasquali M. Quantitative urine amino acid analysis using liquid chromatography tandem mass spectrometry and aTRAQ (R) reagents. J Chromatogr B. 2011;879:2695-703
28. Deng C, Li N, Zhang X. Rapid determination of amino acids in neonatal blood samples based on derivatization with isobutyl chloroformate followed by solid-phase microextraction and gas chromatography/mass spectrometry. Rapid Commun Mass Spectrom. 2004;18:2558-64
29. Soga T, Kakazu Y, Robert M, Tomita M, Nishioka T. Qualitative and quantitative analysis of amino acids by capillary electrophoresis-electrospray ionization-tandem mass spectrometry. Electrophoresis. 2004;25:1964-72
30. Xia J, Sinelnikov IV, Han B, Wishart DS. MetaboAnalyst 3.0-making metabolomics more meaningful. Nucleic Acids Res. 2015;43:W251-7
31. Jiang YQ, Cheng XL, Wang CA, Ma YF. Quantitative Determination of Sarcosine and Related Compounds in Urinary Samples by Liquid Chromatography with Tandem Mass Spectrometry. Anal Chem. 2010;82:9022-27
32. Mondul AM, Moore SC, Weinstein SJ, Karoly ED, Sampson JN, Albanes D. Metabolomic analysis of prostate cancer risk in a prospective cohort: The Alpha-Tocopherol, Beta-Carotene Cancer Prevention (ATBC) Study. Int J Cancer. 2015;137:2124-32
33. Li Y, Qiu S, Zhang AH. High-throughput metabolomics to identify metabolites to serve as diagnostic biomarkers of prostate cancer. Anal Methods. 2016;8:3284-90
34. Lloyd SM, Arnold J, Sreekumar A. Metabolomic profiling of hormone-dependent cancers: a bird's eye view. Trends Endocrinol Metab. 2015;26:477-85
35. Struck-Lewicka W, Kordalewska M, Bujak R, Yumba Mpanga A, Markuszewski M, Jacyna J. et al. Urine metabolic fingerprinting using LC-MS and GC-MS reveals metabolite changes in prostate cancer: a pilot study. J Pharm Biomed Anal. 2015;111:351-61
36. Zang X, Jones CM, Long TQ, Monge ME, Zhou M, Walker LD. et al. Feasibility of detecting prostate cancer by ultraperformance liquid chromatography-mass spectrometry serum metabolomics. J Proteome Res. 2014;13:3444-54
37. Kumar D, Gupta A, Nath K. NMR-based metabolomics of prostate cancer: a protagonist in clinical diagnostics. Expert Rev Mol Diagn. 2016;16:651-61
38. Cross AJ, Major JM, Sinha R. Urinary biomarkers of meat consumption. Cancer Epidemiol Biomarkers Prev. 2011;20:1107-11
39. Saini S. PSA and beyond: alternative prostate cancer biomarkers. Cell Oncol. 2016;39:97-106
40. Teahan O, Bevan CL, Waxman J, Keun HC. Metabolic signatures of malignant progression in prostate epithelial cells. Int J Biochem Cell B. 2011;43:1002-09
41. Swanson MG, Keshari KR, Tabatabai ZL, Simko JP, Shinohara K, Carroll PR. et al. Quantification of choline- and ethanolamine-containing metabolites in human prostate tissues using 1H HR-MAS total correlation spectroscopy. Magn Reson Med. 2008;60:33-40
42. Lind DS. Arginine and cancer. J Nutr. 2004;134(10 Suppl):2837S-41S discussion 53S
43. Mori M, Gotoh T. Regulation of nitric oxide production by arginine metabolic enzymes. Biochem Biophys Res Commun. 2000;275:715-9
44. Burke AJ, Sullivan FJ, Giles FJ, Glynn SA. The yin and yang of nitric oxide in cancer progression. Carcinogenesis. 2013;34:503-12
45. Hsueh EC, Knebel SM, Lo WH, Leung YC, Cheng PN, Hsueh CT. Deprivation of arginine by recombinant human arginase in prostate cancer cells. J Hematol Oncol. 2012;5:17
Author contact
![]() Corresponding author: Prof. Zenon J. Kokot, Ph.D. Department of Inorganic and Analytical Chemistry, Poznan University of Medical Sciences, 6 Grunwaldzka Street, 60-780 Poznań, Poland, phone: 0048 61 854 66 10, fax: 0048 61 854 66 09, email address: zkokotedu.pl.
Corresponding author: Prof. Zenon J. Kokot, Ph.D. Department of Inorganic and Analytical Chemistry, Poznan University of Medical Sciences, 6 Grunwaldzka Street, 60-780 Poznań, Poland, phone: 0048 61 854 66 10, fax: 0048 61 854 66 09, email address: zkokotedu.pl.