Impact Factor ISSN: 1449-1907
- Issue 8; 2026
- Issue 7; 2026
- Issue 6; 2026
- Issue 5; 2026
- Issue 4; 2026
- Volume 23; 2026
- Past Issues
- Editorial Board
- Cover Images
- Index & Coverage
- Cover Suggestion
- Special Issues
Introduction
Materials and Methods
Results
Discussion
Conclusion
Supplementary Material
Acknowledgements
References

 Global reach, higher impact
Int J Med Sci 2016; 13(11):868-874. doi:10.7150/ijms.16845 This issue Cite
Research Paper
Amplification and overexpression of CTTN and CCND1 at chromosome 11q13 in Esophagus squamous cell carcinoma (ESCC) of North Eastern Chinese Population
Xiaoxia Hu1,4,*, Ji Wook Moon2,*, Shibo Li1, Weihong Xu2, Xianfu Wang2, Yuanyuan Liu3 ![]() , Ji-Yun Lee2
, Ji-Yun Lee2 ![]()
1. Department of Pediatrics, University of Oklahoma Health Sciences Center, Oklahoma City, OK 73104 USA
2. Department of Pathology, Korea University College of Medicine, Seoul, 02841, Republic of Korea
3. Department of Internal Medicine, the First Hospital of Jilin University, Jilin, 130021, P.R. China.
4. Department of Clinical Medicine, College of Medicine and Health, Lishui University, Zhejiang, 323000, P.R. China
*These authors contributed equally to this study
Received 2016-7-14; Accepted 2016-9-1; Published 2016-10-20
Abstract
Esophageal squamous cell carcinoma (ESCC) is a genetically complex tumor type and is a major cause of cancer-related mortality. The combination of genetics, diet, behavior, and environment plays an important role in the carcinogenesis of ESCC. To characterize the genomic aberrations of this disease, we investigated the genomic imbalances in 19 primary ESCC cases using high-resolution array comparative genomic hybridization (CGH). All cases showed either loss or gain of whole chromosomes or segments of chromosome(s) with variable genomic sizes. The copy number alterations per case affected the median 34% (~ 1,034Mb/3,000Mb) of the whole genome. Recurrent gains were 1q21.3-qter, 3q13.11-qter, 5pter-p11, 7pter-p15.3, 7p12.1-p11.2, 7q11-q11.2, 8p12-qter, 11q13.2-q13.3, 12pter-p13.31, 17q24.2, 20q11.21-qter, and 22q11.21-q11.22 whereas the recurrent losses were 3pter-p11.1, 4pter-p12, 4q28.3-q31.22, 4q31.3-q32.1, 9pter-p12, 11q22.3-qter and 13q12.11-q22.1. Amplification of 11q13 resulting in overexpression of CTTN/CCND1 was the most prominent finding, which was observed in 13 of 19 ESCC cases. These unique profiles of copy number alteration should be validated by further studies and need to be taken into consideration when developing biomarkers for early detection of ESCC.
Keywords: Esophageal squamous cell carcinoma, Array CGH, CTTN, CCND1
Introduction
Esophageal cancer is one of the most common malignant neoplasms worldwide, ranking seventh in incidence and sixth in mortality among tumors of all sites in both males and females combined, according to the recent statistics of the World Health Organization (WHO) 2012 (http://globocan.iarc.fr/). The two main histological esophageal cancer types, adenocarcinoma (ADC) and squamous cell carcinoma (SCC) differ in their incidence, geographic distribution, ethnic pattern, and etiology. Esophageal squamous cell carcinoma (ESCC) is the most prevalent type and constitutes more than 90% of esophageal cancers worldwide,[1] even though esophageal ADCs are more prevalent in the USA.[2] Regions with such high incidence of ESCC (15150/100,000) are referred to as the famous ''Asian Esophageal Cancer Belt,'' which includes the countries of the Caspian littoral region, the central Asian republics, Mongolia and north-western China, which have a 10-100 fold greater chance of being affected by esophageal cancer compared to other countries.[3] The Jilin Province in North-Eastern China is part of the “Asian Esophageal Cancer Belt.” The major ethnic groups in the Jilin Province comprise the Han Chinese (~91%), Korean (~ 4.3%), and Manchu (~ 3.4%) populations.
Multiple etiologies including several behavioral and environmental factors such as an individual's diet, tobacco smoking, alcohol consumption, exposure to chemical carcinogens, and chronic inflammation are known to be risk factors for the development of ESCC.[4] Regardless of the ethnic origin of the patients and the etiological factors, genetic instabilities such as microsatellite instability and chromosomal instability are associated with tumorigenesis of ESCC. Chromosomal instabilities are commonly a consequence of chromosomal or chromosome segment abnormalities resulting in DNA copy number changes (CNCs) that occur during in tumor progression. Analysis of the DNA CNC anatomy showed that human cancers can be classified by DNA CNC profiling, because it is non-randomly selected according to the biological backgrounds of the cancer.[5] These CNCs may lead to loss of function in tumor suppressor genes and/or gain of function in oncogenes. Interestingly, high level DNA CNCs (amplification) in tumors are frequently restricted to certain chromosomal regions that contain well-known oncogenes, which are also overexpressed or activated.[6,7] Some oncogenes, such as NMYC, LMYC and GLI, were originally discovered because of their genomic amplification in human tumors.[7] Therefore, the detection and discovery of unidentified or incompletely described CNCs and the relevant genes located within these CNCs can lead to identification of genes putatively involved in growth control and tumorigenesis.
The recently available whole genomic array comparative genomic hybridization (CGH), a high-throughput genomic technology, facilitates the accumulation of high resolution data of the genomic imbalances associated with disease. In this study, we were able to define the regions of gains/amplification and losses in ESCC, and through integration of copy number, we identified the possible candidate target genes that could give insights into the pathology and molecular mechanisms of ESCC. It may therefore provide information relevant to early tumor detection, refined prognosis, and the development of novel targeted therapeutics.
Materials and Methods
Tumor Samples
The study included samples from 19 advanced ESCC cases from the Jilin Province in the north-east part of the China, diagnosed according to the WHO classification.[8] The clinical characteristics and risk factors of these samples are summarized in Table 1. Of the 19 cases studied, 18 were from male patients and only one was from a female patient. The mean age of the patients was 57 (range: 37-76) years. The stage of each tumor was classified according to the tumor, node, and metastasis (TNM) classification of the International Union against Cancer[9] and the National Comprehensive Cancer Network (NCCN) Clinical Practice Guidelines in Oncology (http://www.nccn.org/professionals/physician_gls/f_guidelines.asp) as follows: stage I, two cases; stage II, six cases; stage III, eight cases; information for three cases was not available. The histopathological grades of the samples were as follows: grade 1 (well differentiated/low grade squamous cell carcinoma), one case; grade 2 (moderately differentiated/intermediate grade squamous cell carcinoma), eighteen cases; and grade 3 (poorly differentiated/high grade squamous cell carcinoma), none. All patients had negative histories of exposure to either chemotherapy or radiotherapy before surgery, and were not diagnosed with other cancers. Two of the patients had a family history of esophageal cancer. Unfortunately, the information of postsurgical pathological stages was not available. Informed consent was obtained from the enrolled patients with the approval of the ethics committee of the First Hospital of Jilin University (IRB#2011-002). Tumor samples were obtained surgically in the Department of thoracic surgery, at the First Teaching Hospital of Jilin University. Histologically normal esophageal mucosa was surgically removed from the primary tumor regions by experienced pathologists and the primary tumor samples were snap-frozen and stored at -80°C. DNA was isolated from the samples by proteinase K digestion followed by phenol-chloroform extraction according to standard protocols.
Clinical characteristics and risk factors of 19 ESCC samples
| No. | ID | Age(y)/sex | TNM stage | Stage | Histology grade | Tumor location | Smoking (Y/N) | Drinking (Y/N) | Family history of cancer | Genomic size of total gain, Mb | Genomic size of total loss, Mb | Net imbalances, Mb (%) |
|---|---|---|---|---|---|---|---|---|---|---|---|---|
| 1 | 33T | 72/M | T2N1M0 | IIB | Moderate | lower | N | N | N | 302.7 | 181.4 | +121.3 (4.0) |
| 2 | 39T | 58/M | T3N2M0 | IIIB | Moderate | lower | Y | Y | N | 136.1 | 0 | +136.1 (4.5) |
| 3 | 44T | 60/M | T3NXM0 | N/A | Moderate | lower | Y | Y | N | 668.9 | 831.6 | -162.7(5.4) |
| 4 | 57T | 50/M | T3N2M0 | IIIB | Moderate | lower | Y | Y | Y | 267.9 | 108.1 | +159.8 (5.3) |
| 5 | 61T | 76/F | T3N3M0 | IIIC | Moderate | lower | Y | N | N | 119.6 | 352.4 | -232.8 (7.8) |
| 6 | 74T | 47/M | T3N3M0 | IIIC | Moderate | lower | Y | Y | N | 536 | 48.3 | +487.7 (16.3) |
| 7 | 79T | 40/M | T3N0M0 | IIA | Moderate | lower | Y | Y | N | 232.7 | 896.1 | -663.4 (22.1) |
| 8 | 80T | 67/M | T3N1M0 | IIIA | Moderate | lower | Y | Y | N | 830.5 | 806.4 | +24.1 (0.8) |
| 9 | 97T | 46/M | T3N0M0 | IIA | Moderate | lower | Y | Y | N | 238.4 | 29.6 | +208.8 (7.0) |
| 10 | TL0140 | 44/M | T1N0M0 | IB | Moderate | upper | N | N | Y (EC) | 525.6 | 604.6 | -79 (2.6) |
| 11 | TL0134 | 48/M | T3N1M0 | IIIA | Moderate | lower | Y | Y | Y | 454.8 | 375.7 | +79.1 (2.6) |
| 12 | TL0129 | 55/M | T3N0M0 | IIB | Moderate | upper | Y | Y | N | 549.2 | 460.9 | +88.3 (2.9) |
| 13 | TL0128 | 72/M | T2NXM0 | N/A | Well | lower | Y | Y | Y (EC) | 1090.6 | 1298.7 | -208.1 (6.9) |
| 14 | TL0127 | 65/M | T3N1M0 | IIIA | Moderate | middle | Y | Y | N | 911.1 | 410.9 | +500.2 (16.7) |
| 15 | TL0124 | 61/M | T1N0M0 | IB | Moderate | lower | N | Y | N | 787.2 | 752.5 | +34.7 (1.2) |
| 16 | TL0122 | 60/M | T1N1M0 | IIB | Moderate | lower | Y | Y | N/A | 756.7 | 62.3 | +694.4 (23.1) |
| 17 | TL0123 | 52/M | T2N0M0 | IIB | Moderate | upper | Y | Y | N | 1022.2 | 414.2 | +608 (20.3) |
| 18 | TL0110 | 37/M | T3N1M0 | IIIA | Moderate | lower | Y | Y | N | 801.3 | 598.7 | +202.6 (6.8) |
| 19 | TL0105 | 66/M | T2NXM0 | N/A | Moderate | lower | Y | Y | N | 394.3 | 787.4 | -393.1 (13.1) |
Abbreviations: N/A, not available; TNM, tumor, node, metastasis; Y/N, yes/no
Array CGH assay
Array CGH was performed according to the manufacturer's protocol with minor modifications on a 385k oligonucelotide chip (Roche/NimbleGen System Inc., Madison, WI). Commercially available pooled normal control DNA was used (Promega Corporation, Madison, WI) as the reference. The patients DNA and the reference DNA were labeled with either Cyanine 3 (Cy-3) or Cyanine 5 (Cy-5) by random priming (Trilink Biotechnologies, San Diego, CA) and were then hybridized to the chip via incubation in the MAUI hybridization system (BioMicro Systems, Salt Lake City, UT). After 18-hours of hybridization at 42°C, the slides were washed and scanned using an MS200 system (Roche/NimbleGen System Inc., Madison, WI). Profile smoothing and breakpoint detection was performed with NimbleScan version 2.4 and SignalMap version 1.9 (NimbleGen System Inc., Madison, WI). If a smoothed copy number log2 ratio was found to be above 0.15 or below -0.15 across five neighboring probes, it was defined as a gain or a loss, respectively. Amplifications were defined as those with a smoothed DNA copy number ratio of above 0.5 and homozygous deletions were defined as those with a smoothed DNA copy number ratio of below -0.4.
Immunohistochemistry (IHC) staining for CTTN (cortactin) and CCND1 (cyclin D1)
IHC studies were performed on formalin-fixed, paraffin embedded (FFPE) slides of ESCC tumor tissues to explore the expression of CTTN and CCND1 according to the manufacturer's protocol using rabbit monoclonal antibodies against CTTN and CCND1 and horseradish peroxidase (HRP) labeled Goat anti-rabbit polyclonal secondary antibody (Abcam plc, Cambridge, MA). Counterstaining was carried out with hematoxylin. The expression score was determined by assessing staining intensity and the percentage of immunoreactive cells.
Results
Overview of Genomic Imbalance Profiling of 19 ESCCs
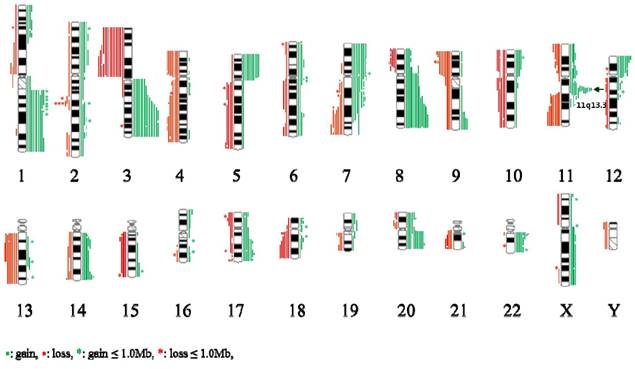
An overview of genomic imbalance profiling in 19 ESCC cases is shown in Fig 1. Genomic CNCs (gains, losses, amplification and homozygous deletion) were discovered all 19 cases by using array CGH. Net gains (13 cases) of genetic material were more frequent than net losses (6 cases). The sizes of net genomic imbalances per case ranged from a loss of 663.4 Mb (~ 22 % of genome) to a gain of 694.4Mb (~ 2% of genome) (Table 1 and Fig S1). The mean number of gains per case was ~ 15, ranging from 3 to 31, and the mean number of losses per case was ~ 11, ranging from 0 to 21. The gain sizes ranged from 31.3 kb (TL0123) to 242.7 Mb (TL0123), and the loss sizes ranged from 56.2 kb (TL0124) to 225.7 Mb (TL0127). Approximately 8.6 % (46/537) of the total genomic imbalances were smaller than 1 Mb; from this subset, 58.7 % (27/46) of the total imbalances were gains and 41.3 % (19/46) were losses. The most frequent genomic imbalances detected in more than 8 out of 19 ESCC cases (> 42%) were gains of 1q21.1-qter, 3q13.11-qter, 5pter-p11, 7pter-p15.3, 7p12.1-p11.2, 7q11-q11.2, 8p12-qter, 11q13.2-q13.3, 12pter-p13.3, 17q24.2, 20q11.21-qter, and 22q11.21-q11.22; and losses of 3pter-p11.1, 4pter-p12, 4q28.3-q31.22, 4q31.3-q32.1, 9pter-p12, 11q22.3-qter, and 13q12.11-q22.1 (Table 2).
Summary of the array-CGH results from 19 cases of ESCC samples. Gains of DNA are demonstrated as green vertical lines to the right of the chromosome idiograms. Losses of DNA are demonstratedas red vertical lines to the left of the chromosome idiograms.
Frequently alternated loci and interesting genes in ESCC samples
| Chromosome | Genomic coordinates (NCBI Build 36.3) (bp) | Frequency | Selected interesting gene (s) | |
|---|---|---|---|---|
| Gains | 1q21.3-qter | 153,250,154-246,756,433 | 8/19 | OBSCN, PTPRC, KCNK2, RGS1, KCNH1, S100A3, ENAH |
| 3q13.11-qter | 104,562,526-199,325,140 | 8/19 | TNK2, TNFSF10, FGF12 | |
| 5pter-p11 | 68,753-45,806,337 | 10/19 | SLC1A3, TRIO, RNASEN,TERT, IRX1, FGF10 | |
| 7pter-p15.3 | 137,567-23,662,661 | 9/19 | TWIST1, MAD1L1, NUDT1 | |
| 7p12.1-p11.2 | 51,937,714-56,087,631 | 9/19 | SEC61G, EGFR, ECOP, PSPH | |
| 7q11-q11.2 | 61,093,897-66,168,768 | 8/19 | ZNF107, ZNF92, GUSB, RABGEF1 | |
| 8p12-qter | 37,175,015-14,6262,725 | 9/19 | MYC, WISP1, FOXH1 | |
| 11q13.2-q13.3 | 68,687,593-70,681,358 | 14/19 | MYEOV, CCND1,ORAOV1, FGF19, FGF4, FGF3, ANO1, FADD, PPFIA1, CTTN, SHANK2 | |
| 12pter-p13.31 | 18,891-8,250,087 | 9/19 | CCND2, FGF23, TNFRSF1A, LTBR, GRIN2B | |
| 17q24.2 | 61,843,907-63,875,054 | 8/19 | BPTF, KPNA2 | |
| 20q11.21-qter | 29,275,015-62,387,649 | 11/19 | E2F1, AURKA | |
| 22q11.21-q11.22 | 18,756,412-21,706,352 | 9/19 | CRKL, UBE2L3, MAPK1, PPM1F | |
| Losses | 3pter-p11.1 | 37,570-90,393,787 | 12/19 | FANCD2, CTNNB1, WNT7A, FBLN2, TGFBR, FHIT |
| 4pter-p12 | 191-48,150,025 | 8/19 | UCHL1 | |
| 4q28.3-q31.22 | 135,093,980-145,125,004 | 8/19 | SETD7 | |
| 4q31.3-q32.1 | 152,306,484-158,362,524 | 8/19 | FBXW7 | |
| 9pter-p12 | 81,476-42,344,999 | 8/19 | MTAP, CDKN2A, CDKN2B, PCSK5 | |
| 11q22.3-qter | 102,643,870-134,450,069 | 9/19 | ATM | |
| 13q12.11-q22.1 | 20,975,030-72,617,826 | 8/19 | CDK8, BRCA2, STARD13, ATP7B |
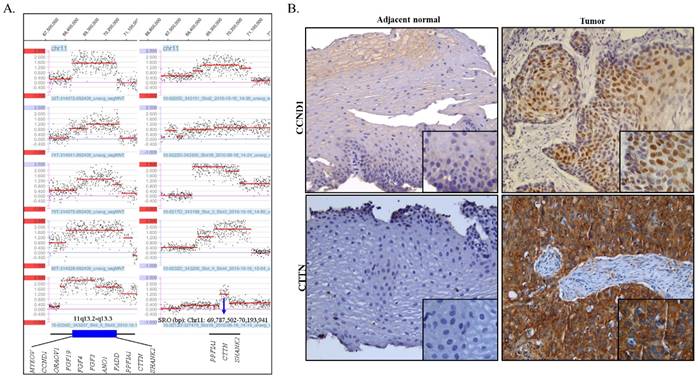
The amplifications, which showed high-level copy number gains defined as log2 ratios of more than 0.5, were observed in 41 segmental chromosome regions and are summarized in Table S1. Of these, the 7p11.2 region was amplified in 3 cases and gained in 7 cases and the region of 11q13.3 was amplified in 10 cases and gained in 4 cases and was the most prominent feature in our sample set. Amplification of 7p11.2 was separated by two regions. The size of the smallest region of overlap (SRO) of distal 7p11.2 is estimated to be ~ 631.0 kb and includes the EGFR gene. The size of the SRO of proximal 7p11.2 is estimated to be ~1.4 Mb and includes nine genes, which are ZNF713, MRPS17, GBAS, PSPH, SUMF2, PHKG1, CHCHD2, CCT6A, and LOC389493. The SRO of the 11q13.3 amplification is estimated to be ~ 406.4 kb in size, and includes PPFIA1, CTTN, and SHANK2 (Fig 2A).
(A) Amplification of 11q13.2-q13.3 as detected by the array CGH (log2>0.5). The X-axis indicates genomic location and the Y-axis indicates log2 ratio. SRO: smallest region of overlap. (B) Representative IHC images of CCND1 (cyclin D1) and CTTN (cortactin) in ESCC (case TL0134). Tumor cells showed strongly positive nuclear staining of CCND1 and cytoplasmic CTTN compared to adjacent normal cells which are negative for CCND1 and CTTN. Original magnification, ×200 (large image) and ×400 (small image).
Two interesting possible homozygous losses with a log2 ratio less than -0.4, that are smaller than 1 Mb were identified (Table S2). These loci harbored putative tumor suppressor genes (TSGs) including FHIT and CDKN2.
Overexpression of CTTN (cortactin) and CCND1 (cyclin D1) on 11q13
IHC staining was performed using antibodies against proteins cortactin and cyclin D1 which are encoded by CTTN and CCND1, respectively, on FFPE tissue slides of ESCC as well as of normal esophageal epithelia (Fig 2B and Table 3). The correlation of genomic copy number gain/amplification and protein expression of CTTN and CCND1 genes is summarized in table 3. All 17 cases, that were available for performing IHC studies, exhibited strong CTTN positive staining. The consistency of the genomic CNCs with the protein expression level of CTTN was 76.5% (13/17). Positive staining of CCND1 was observed in eight out of ten cases tested, including one case without genomic copy number gain or amplification, and the consistency of genomic CNC with protein expression levels of CCND1 was found to be 70% (7/10) in the ESCC cases. The normal epithelia of the esophagus showed negative immunoreactions for both CTTN and CCND1.
Copy number variation and protein expression of CCND1 and CTTN in ESCC samples
| Case ID | CCND1 | CTTN | ||
|---|---|---|---|---|
| Copy number variation | Protein expression | Copy number variation | Protein expression | |
| 33T | Amplification | Strongly positive | Amplification | Strongly positive |
| 39T | Gain | Positive | Gain | Strongly positive |
| 44T | Normal | Negative | Normal | Strongly positive |
| 57T | Gain | Strongly positive | Gain | Strongly positive |
| 61T | Normal | Positive | Normal | Strongly positive |
| 74T | Amplification | Strongly positive | Amplification | Strongly positive |
| 79T | Amplification | NA | Amplification | Strongly positive |
| 80T | Amplification | Strongly positive | Amplification | Strongly positive |
| 97T | Gain | Negative | Gain | Strongly positive |
| TL0105 | Normal | N/A | Normal | Strongly positive |
| TL0110 | Normal | N/A | Normal | N/A |
| TL0122 | Gain | N/A | Gain | Strongly positive |
| TL0123 | Amplification | N/A | Amplification | N/A |
| TL0124 | Amplification | N/A | Amplification | Strongly positive |
| TL0127 | Amplification | N/A | Amplification | Strongly positive |
| TL0128 | Amplification | N/A | Amplification | Strongly positive |
| TL0129 | Normal | N/A | Normal | Strongly positive |
| TL0134 | Amplification | Strongly positive | Amplification | Strongly positive |
| TL0140 | Gain | Strongly positive | Amplification | Strongly positive |
Abbreviations: N/A: not available
Discussion
We investigated genomic CNCs in 19 ESCC cases by whole genomic array CGH. It was recognized that total number of gains/amplifications (280) was 1.3 times more frequent than the total number of losses (211). Of 19 cases with genomic imbalances, 13 cases had net-genomic gain (24.1 - 694.4 Mb) and 6 cases had net-genomic loss (79.1 - 663.4 Mb), indicating that net genomic gains are more common than losses. The most frequent genomic imbalances detected in our samples were gains of 1q21.3-qter (8/19), 3q13.11-qter (8/19), 5pter-p11 (10/19), 7pter-p15.3 (9/19), 7p12.1-p11.2 (9/19), 7q11-q11.2 (8/19), 8p12-qter (9/19), 11q13.2-q13.3 (14/19), 12pter-p13.31 (9/19), 17q24.2 (8/19), 20q11.21-qter (11/19), and 22q11.21-q11.22 (9/19); and losses of 3pter-p11.1 (12/19), 4pter-p12 (8/19), 4q28.3-q31.22 (8/19), 4q31.3-q32.1 (8/19), 9pter-p12 (8/19), 11q22.3-qter (9/19), and 13q12.11-q22.1 (8/19) (Table 2). These findings are compatible with previous findings by other groups.[10-12] Moreover, gains of 3q, 8q23-qter, 11q13.2, and 20q and loss of 7q34, 11q22-qter, and 18q21.1-q23 have been positively associated with poor outcome in ESCCs.[13-16]
Interestingly, the reciprocal loss of 3p and gain of 3q was observed in 8 of 19 cases in our study. The reciprocal loss of 3p and gain of 3q is a frequent phenomenon in various epithelial tumors. Especially, the isochromosome 3q was visualized in lung cancer, squamous cell carcinomas of the vulva, oral, and the head and neck, as well as in the ESCC cell line KYSE 410-4,[17-21], suggesting that isochromosome 3q formation is a mechanism of somatic chromosomal aberrations, resulting in reciprocal loss of 3p and gain of 3q during epithelial cell carcinogenesis.
Amplifications were observed in 41 segmental regions, of which 7p11.2 and 11q13.3 were the most repeatedly involved interesting regions (Table S1). Amplification of 11q13.3 was the most prominent finding in our study. A total of 14 cases out of 19 showed copy number gain of 11q13.3. Of these 14 cases with gains, 10 cases showed amplification of different sizes ranging from 406.4 kb to 5.9 Mb (Fig 2A). The various sizes of the 11q13 amplification containing various oncogenes is one of the most frequent amplification events, which is observed in 28-70 % of ESCC cases [22-24] and a significant positive correlation between copy number gain and mRNA expression levels has been reported in this region.[13] Previous studies have especially proposed the important role of CCND1 and CTTN in ESCC.[25,26] Regarding the collaborative function of these two genes, it can be hypothesized that overexpression of CCND1 results in cell proliferation along with overexpression of CTTN, and may facilitate invasive and metastatic behavior in tumor cells. In the present study, subsequent examination of CCND1 and CTTN protein expression levels confirmed that genomic amplification status parallels the increased protein level. Moreover, CTTN amplification is likely the most prominent mechanism of cortactin overexpression encoded by CTTN. Since five cases without genomic amplification also showed high levels of CTTN protein expression, mechanisms other than genomic amplification, such as the CALR-STAT3-CTTN-Akt pathway may also be involved in the upregulation of CTTN expression.[27] It is unfortunate that we were not able to evaluate the statistical significance of the relationship between the amplification/overexpression level of CCND1/CTTN and clinicopathological characteristics such as Tumor, Node, Metastasis (TNM) stage due to limitation of case number and the late stage of cancer in the patient. However, this can be supported by a previous study showing that overexpression of CTTN in ESCC was significantly associated with poor prognosis in patients,[28] suggesting the possibility of CTTN as a valuable marker of ESCC.
Amplification of 7p11.2 harbored an oncogene EGFR, which is one of the tyrosine kinase receptors that is broadly distributed in the human epithelial cell membrane. Amplification and overexpression of EGFR has been reported in ESCC and was significantly associated with a poor prognosis in ESCC patients indicating that it may play an important role in ESCC progression.[29,30]
The possible homozygous losses smaller than 1 Mb that encompass interesting putative tumor suppressor genes (TSG), such as FHIT and CDKN2A were identified (Supplementary Table 2). Additional sequencing analysis of CDK2NA revealed a somatic mutation in exon 2 (c.31_32dupCC;p.S12Lfs*15) leading to a stop codon, in one tumor case (TL 0122) of 19 (Fig S2) without the mutation in adjacent normal tissues. FHIT and CDKN2A are virtually known as the most frequently affected genes after TP53 in the context of homozygous deletion, promoter hypermethylation, loss of heterozygosity (LOH), and point mutations in various human cancers including ESCC.[31-36]
Conclusion
Our study further evidences the important role of CTTN and CCDN1 in 11q13 amplification/expression and the losses of TSGs, such as CDKN2A and FHIT, in advanced stages of ESCC. In future studies, a larger sample size and more early-stage samples are needed to obtain more statistically reliable data and to verify valuable markers for the early detection and targeted therapy of ESCC.
Supplementary Material
Supplementary Methods. Table S1 High copy number amplification/gain segments and genes and ESCC samples. Table S2 Possible homozygous loss that is smaller than 1.0 Mb. Figure S1. Net genomic imbalances in 19 ESCC samples. Figure S2 A somatic mutation in exon2 of CDKN2A c.331_32dupCC (p.S12Lfs*15) was detected in one ESCC tumor tissue (red box) but not in the adjacent normal tissue.
Acknowledgements
We acknowledge the help of Dr. Zhongxin Yu from Department of Pathology, University of Oklahoma Health Sciences Center for capturing IHC images.
This work was supported by the Basic Science Research Program (NRF-2014R1A2A2A01003566) of the National Research Foundation of Korea (NRF) grant, which is funded by the Ministry of Education, Science and Technology (MEST), Republic of Korea, and Future Planning and Bio-Synergy Research Project (NRF-2014M3A9C4066487) of the Ministry of Science, ICT and Future Planning through the National Research Foundation.
Competing Interests
The authors have declared that no competing interest exists.
References
1. Pickens A, Orringer MB. Geographical distribution and racial disparity in esophageal cancer. Ann Thorac Surg. 2003;76:S1367-9
2. Umar SB, Fleischer DE. Esophageal cancer: epidemiology, pathogenesis and prevention. Nat Clin Pract Gastroenterol Hepatol. 2008;5:517-26
3. Zheng S, Vuitton L, Sheyhidin I, Vuitton DA, Zhang Y, Lu X. Northwestern China: a place to learn more on oesophageal cancer. Part one: behavioural and environmental risk factors. Eur J Gastroenterol Hepatol. 2010;22:917-25
4. Melhado RE, Alderson D, Tucker O. The changing face of esophageal cancer. Cancers (Basel). 2010;2:1379-404
5. Myllykangas S, Tikka J, Bohling T, Knuutila S, Hollmén J. Classification of human cancers based on DNA copy number amplification modeling. BMC Med Genomics. 2008;1:15
6. Beroukhim R, Mermel CH, Porter D. et al. The landscape of somatic copy-number alteration across human cancers. Nature. 2010;463:899-905
7. Brison O. Gene amplification and tumor progression. Biochim Biophys Acta. 1993;1155:25-41
8. Fléjou JF. [WHO Classification of digestive tumors: the fourth edition]. Ann Pathol. 2011;31(Suppl):S27-31
9. H. SL, Wittekind C, International Union against Cancer. TNM classification of malignant tumours. 6th ed. New York: Wiley-Liss. 2002
10. Chattopadhyay I, Singh A, Phukan R. et al. Genome-wide analysis of chromosomal alterations in patients with esophageal squamous cell carcinoma exposed to tobacco and betel quid from high-risk area in India. Mutat Res. 2010;696:130-8
11. Hu N, Wang C, Hu Y. et al. Genome-wide loss of heterozygosity and copy number alteration in esophageal squamous cell carcinoma using the Affymetrix GeneChip Mapping 10 K array. BMC Genomics. 2006;7:299
12. Shi ZZ, Liang JW, Zhan T. et al. Genomic alterations with impact on survival in esophageal squamous cell carcinoma identified by array comparative genomic hybridization. Genes Chromosomes Cancer. 2011;50:518-26
13. Hu N, Wang C, Ng D. et al. Genomic characterization of esophageal squamous cell carcinoma from a high-risk population in China. Cancer Res. 2009;69:5908-17
14. Tada K, Oka M, Tangoku A, Hayashi H, Oga A, Sasaki K. Gains of 8q23-qter and 20q and loss of 11q22-qter in esophageal squamous cell carcinoma associated with lymph node metastasis. Cancer. 2000;88:268-73
15. Dai N, Zheng M, Wang C. et al. Genetic variants at 8q24 are associated with risk of esophageal squamous cell carcinoma in a Chinese population. Cancer Sci. 2014;105:731-5
16. Gen Y, Yasui K, Zen Y. et al. SOX2 identified as a target gene for the amplification at 3q26 that is frequently detected in esophageal squamous cell carcinoma. Cancer Genet Cytogenet. 2010;202:82-93
17. Jee KJ, Kim YT, Kim KR, Kim HS, Yan A, Knuutila S. Loss in 3p and 4p and gain of 3q are concomitant aberrations in squamous cell carcinoma of the vulva. Mod Pathol. 2001;14:377-81
18. Jin C, Jin Y, Wennerberg J, Annertz K, Enoksson J, Mertens F. Cytogenetic abnormalities in 106 oral squamous cell carcinomas. Cancer Genet Cytogenet. 2006;164:44-53
19. Tai AL, Mak W, Ng PK. et al. High-throughput loss-of-heterozygosity study of chromosome 3p in lung cancer using single-nucleotide polymorphism markers. Cancer Res. 2006;66:4133-8
20. Yang Y, Chu J, Wu Y. et al. Chromosome analysis of esophageal squamous cell carcinoma cell line KYSE 410-4 by repetitive multicolor fluorescence in situ hybridization. J Genet Genomics. 2008;35:11-6
21. Manor E, Tetro S, Bodner L. Translocation (12;14) and other chromosome abnormalities in squamous cell carcinoma of the tongue. Eur Arch Otorhinolaryngol. 2010;267:1273-6
22. Ishizuka T, Tanabe C, Sakamoto H. et al. Gene amplification profiling of esophageal squamous cell carcinomas by DNA array CGH. Biochem Biophys Res Commun. 2002;296:152-5
23. Pack SD, Karkera JD, Zhuang Z. et al. Molecular cytogenetic fingerprinting of esophageal squamous cell carcinoma by comparative genomic hybridization reveals a consistent pattern of chromosomal alterations. Genes Chromosomes Cancer. 1999;25:160-8
24. Sakai N, Kajiyama Y, Iwanuma Y. et al. Study of abnormal chromosome regions in esophageal squamous cell carcinoma by comparative genomic hybridization: relationship of lymph node metastasis and distant metastasis to selected abnormal regions. Dis Esophagus. 2010;23:415-21
25. Lu F, Gladden AB, Diehl JA. An alternatively spliced cyclin D1 isoform, cyclin D1b, is a nuclear oncogene. Cancer Res. 2003;63:7056-61
26. Luo ML, Shen XM, Zhang Y. et al. Amplification and overexpression of CTTN (EMS1) contribute to the metastasis of esophageal squamous cell carcinoma by promoting cell migration and anoikis resistance. Cancer Res. 2006;66:11690-9
27. Du XL, Yang H, Liu SG. et al. Calreticulin promotes cell motility and enhances resistance to anoikis through STAT3-CTTN-Akt pathway in esophageal squamous cell carcinoma. Oncogene. 2009;28:3714-22
28. Lu P, Qiao J, He W. et al. Genome-wide gene expression profile analyses identify CTTN as a potential prognostic marker in esophageal cancer. PLoS One. 2014;9:e88918
29. Lin G, Sun XJ, Han QB. et al. Epidermal growth factor receptor protein overexpression and gene amplification are associated with aggressive biological behaviors of esophageal squamous cell carcinoma. Oncol Lett. 2015;10:901-6
30. Jiang D, Li X, Wang H. et al. The prognostic value of EGFR overexpression and amplification in Esophageal squamous cell Carcinoma. BMC Cancer. 2015;15:377
31. Ortega S, Malumbres M, Barbacid M. Cyclin D-dependent kinases, INK4 inhibitors and cancer. Biochim Biophys Acta. 2002;1602:73-87
32. Sherr CJ, Roberts JM. Living with or without cyclins and cyclin-dependent kinases. Genes Dev. 2004;18:2699-711
33. Hu N, Wang C, Su H. et al. High frequency of CDKN2A alterations in esophageal squamous cell carcinoma from a high-risk Chinese population. Genes Chromosomes Cancer. 2004;39:205-16
34. Liu FX, Huang XP, Zhao CX. et al. [Allelic loss and down-regulation of FHIT gene expression in esophageal squamous cell carcinoma]. Ai Zheng. 2004;23:992-8
35. Willem P, Brown J, Schouten J. A novel approach to simultaneously scan genes at fragile sites. BMC Cancer. 2006;6:205
36. Shi ZZ, Shang L, Jiang YY. et al. Consistent and differential genetic aberrations between esophageal dysplasia and squamous cell carcinoma detected by array comparative genomic hybridization. Clin Cancer Res. 2013;19:5867-78
Author contact
![]() Corresponding authors: Yuanyuan Liu, MD., Department of Internal Medicine, The First Teaching Hospital of Jilin University, Jilin, P.R. China. E-mail: Liuyuanyuan1960com or Ji-Yun Lee, Ph.D., Department of Pathology, College of Medicine, Korea University, 73, Inchon-ro, Seongbuk-gu, Seoul 02841, Republic of Korea. Tel: +82-2-920-6141; Fax: +82-2-953-3130; Email: jiyun-leeac.kr
Corresponding authors: Yuanyuan Liu, MD., Department of Internal Medicine, The First Teaching Hospital of Jilin University, Jilin, P.R. China. E-mail: Liuyuanyuan1960com or Ji-Yun Lee, Ph.D., Department of Pathology, College of Medicine, Korea University, 73, Inchon-ro, Seongbuk-gu, Seoul 02841, Republic of Korea. Tel: +82-2-920-6141; Fax: +82-2-953-3130; Email: jiyun-leeac.kr