Impact Factor ISSN: 1449-1907

 Global reach, higher impact
Int J Med Sci 2015; 12(8):625-632. doi:10.7150/ijms.12077 This issue Cite
Short Research Communication
Preventing and Treating Hypoxia: Using a Physiology Simulator to Demonstrate the Value of Pre-Oxygenation and the Futility of Hyperventilation
Anna A. Lerant2 ![]() , Robert L. Hester1, Thomas G. Coleman1, William J. Phillips2, Jeffrey D. Orledge3, W. Bosseau Murray4
, Robert L. Hester1, Thomas G. Coleman1, William J. Phillips2, Jeffrey D. Orledge3, W. Bosseau Murray4
1. Department of Physiology and Biophysics, University of Mississippi Medical Center, University of Mississippi Medical Center, MS
2. Department of Anaesthesiology, Cleveland Clinic, Cleveland, OH, USA
3. Department of Emergency Medicine, University of Mississippi Medical Center, University of Mississippi Medical Center, MS, USA
4. Clinical Simulation Centre, Pennsylvania State University College of Medicine, Hershey, PA, USA
Received 2015-3-9; Accepted 2015-7-7; Published 2015-7-23
Abstract
Introduction: Insufficient pre-oxygenation before emergency intubation, and hyperventilation after intubation are mistakes that are frequently observed in and outside the operating room, in clinical practice and in simulation exercises. Physiological parameters, as appearing on standard patient monitors, do not alert to the deleterious effects of low oxygen saturation on coronary perfusion, or that of low carbon dioxide concentrations on cerebral perfusion. We suggest the use of HumMod, a computer-based human physiology simulator, to demonstrate beneficial physiological responses to pre-oxygenation and the futility of excessive minute ventilation after intubation.
Methods: We programmed HumMod, to A.) compare varying times (0-7 minutes) of pre-oxygenation on oxygen saturation (SpO2) during subsequent apnoea; B.) simulate hyperventilation after apnoea. We compared the effect of different minute ventilation rates on SpO2, acid-base status, cerebral perfusion and other haemodynamic parameters.
Results: A.) With no pre-oxygenation, starting SpO2 dropped from 98% to 90% in 52 seconds with apnoea. At the other extreme, following full pre-oxygenation with 100% O2 for 3 minutes or more, the SpO2 remained 100% for 7.75 minutes during apnoea, and dropped to 90% after another 75 seconds. B.) Hyperventilation, did not result in more rapid normalization of SpO2, irrespective of the level of minute ventilation. However, hyperventilation did cause significant decreases in cerebral blood flow (CBF).
Conclusions: HumMod accurately simulates the physiological responses compared to published human studies of pre-oxygenation and varying post intubation minute ventilations, and it can be used over wider ranges of parameters than available in human studies and therefore available in the literature.
Keywords: simulation, preoxygenation, hyperventilation, intubation, resuscitation
Introduction
Two errors by learners using high fidelity (“robotic”) human simulator scenarios in airway and ventilatory management outside the operating room setting are often observed especially during simulated airway emergencies, where the crisis event includes low saturations.[1] Prior to intubation, pre-oxygenation (also called “denitrogenation”) is often inadequately performed, or even totally omitted.[2] After intubation, during the subsequent manual ventilation, studies indicate that participants tend to hyperventilate the simulated patient at rapid respiratory rates with large tidal volumes: firstly, as an aid to confirm equal and bilateral breath sounds, and secondly, in an attempt to more rapidly improve the saturation.[1;3] These two errors are also frequently observed in clinical practice during emergency intubations performed outside of the operating room or in the pre-hospital setting.[4]
Trainees are frequently not even aware of the deleterious effects (e.g. hyperventilation causing a decrease of cerebral perfusion) of these errors, because similar to clinical practice, the majority of robotic simulators cannot provide a real-time display of H+ concentrations, alveolar O2, N2 and CO2 concentrations, nor of cerebral perfusion. Additionally, this is a physiologically unstable phase and the end-tidal CO2 concentrations (EtCO2) may not reflect the actual CO2 concentrations of various tissue compartments which are rapidly changing (e.g. central nervous system, CNS). Currently, there are no robotic simulator displays indicating cerebral blood flow (CBF).
Similar to the experience in simulation, inconsistent pre-oxygenation and excessive hyperventilation are also frequently present in clinical practice, especially outside the operating room, during “codes” or in the pre-hospital setting.[1-3] A recent retrospective, observational study of in situ pediatric mock codes in a hospital ward setting indicated that hyperventilation was present in every mock code reviewed.[1] The mean rates of ventilation by all providers, in all scenarios were about 2-5 times higher[1] than specified by Advanced Cardiovascular and Pediatric Life Support (ACLS and PALS) guidelines [5] It is possible that the practice demonstrated during simulation is both a reflection of what is being observed and learned in clinical practice, as well as an anxiety-driven response to the respiratory emergency at hand.
In daily clinical practice it is difficult to identify and/or quantify hyperventilation used as a method to more rapidly improve oxygenation (“get more oxygen into the patient”). This is because video recordings of clinical emergencies (“codes”) are rare, and medical records usually do not include either the duration of pre-oxygenation, nor of the manual ventilatory rates and/or minute ventilations immediately after intubation. Therefore, even clinicians with much experience with “codes” do not necessarily have “experience” with the deleterious effects of hyperventilation on CBF.
As a method of enabling hands-on, experiential learning, we propose the hands-on use of screen based (computer based) training, using programs running mathematically modelled human physiology. As an example, we present a variety of simulation studies using a screen-based physiological simulator, HumMod (Version number 2.0.66, HC Simulation, LLC, http://hummod.org). The HumMod physiology simulator operates with more than 7,500 variables and parameters,[6;7] of which we only present a few in this paper. This simulator can be used to expeditiously demonstrate a large number of combinations of variables to demonstrate the value of adequate pre-oxygenation as well as the futility and ineffectiveness of post-intubation hyperventilation to enhance oxygenation. The accuracy of the HumMod physiological model has been demonstrated in several studies.[7-9]
Our aim in this study is to use HumMod to demonstrate the deleterious effects of poorly performed pre-oxygenation, as well as the futility of post-intubation hyperventilation to more rapidly improve saturation. Using this simulation modality, it is possible to present data and parameters (such as cerebral blood flow - CBF) that cannot be demonstrated either in the clinical setting, or in the presently available simulator settings using robotic simulators.
Methods
HumMod Experiments
To establish a stable baseline for our studies, we used steady-state initial conditions in HumMod (Version number 2.0.66, HC Simulation, LLC, http://hummod.org), with a healthy, 30-year-old 75 kg male as the simulated patient with a tidal volume of 450 ml, basal respiratory rate of 11, and a dead space of 151 ml. This results in a minute ventilation of 5.0 L/min and an alveolar ventilation of 3.3 L/min. Baseline arterial blood pH was 7.45. Partial pressures of arterial O2 (PaO2) and arterial CO2 (PaCO2) were 94 mmHg and 37 mmHg, respectively. For data collection for these simulations, the time interval between data points was 15 seconds.
Duration of pre-oxygenation or de-nitrogenation: effects on the onset of hypoxia during apnoea
For the first set of experiments, to study the effects of pre-oxygenation before apnoea, the simulated patient was set to breathe spontaneously with a tidal volume of 450 mL at 11 breaths/min with an inspired O2 percentage of 100% for 0, 0.5, 1, 3, 5 and 7 minutes. Thereafter, to simulate apnoea, the ventilatory rate was set to zero. The experiment ended when the simulation indicated that a PaO2 of 30 mmHg had been reached. While the program actually calculates and stores 7,500 parameters, for this first set of experiments we collected O2 saturation (SpO2), cerebral blood flow, (CBF), heart rate, mean arterial blood pressure, PaO2, PaCO2, and pH data at 15 second intervals.
Hyperventilation: effects on SpO2 and cerebral blood flow
For the second set of experiments, we used the same healthy, 30-year-old 75 kg male as the simulated patient with a tidal volume of 450 ml, basal respiratory rate of 11, and a dead space of 151 ml as before. First, we created a stable, hypoxic, baseline state as follows:
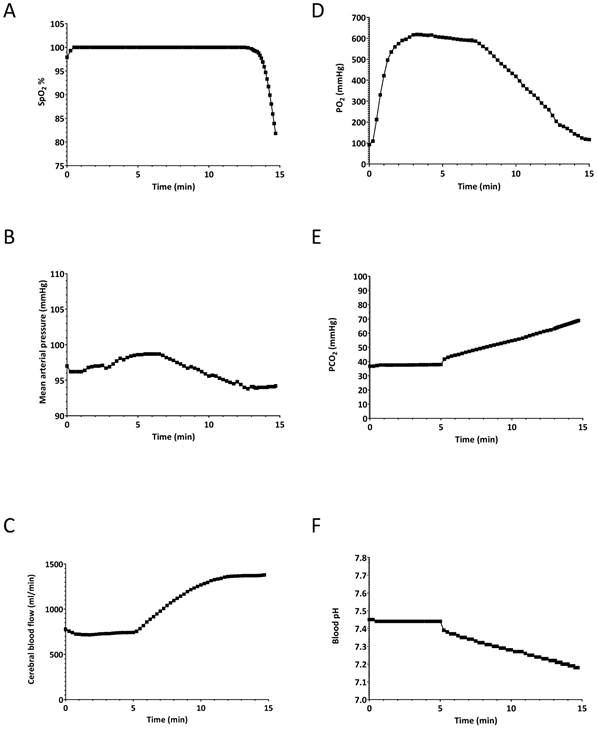
The simulated patient was set to breathe spontaneously for 5 minutes at a rate of 11 breaths/minute at an inspired O2 percentage of 100%. The tidal volume was model driven, and was 450 ml per breath, giving a typical minute ventilation of 5 L/min. After 5 minutes, to simulate apnoea, the simulated patient's respiratory rate was set to zero as would be expected to occur during difficult intubation efforts, resulting in apnoea. The simulation was stopped when the SpO2 decreased to 80%. At that point (9.8 minutes), the simulation was stopped and all physiological parameters were saved. This set of parameters served as a baseline for the second set of simulations (i.e. hyperventilation scenarios). The oxygen saturation, CBF, heart rate, mean arterial pressure, arterial O2 and CO2 partial pressures as well as arterial blood pH during the apnoeic period are shown in Figure 1. The values at the 9.8 min point in Figure 1 represent our stable, baseline, hypoxic patient, which we used for the next set of experiments.
Effects of 5-min pre-oxygenation and subsequent apnoea to establish a “baseline” patient for the hyperventilation experiments. A) oxygen saturation (SpO2), B) mean arterial pressure (MAP), C) cerebral blood flow, D) arterial partial O2 pressure (PaO2), E) arterial partial CO2 pressure (PaCO2) F) arterial blood pH. The simulated patient was set to breathe spontaneously for 5 minutes at a rate of 11 breaths/minute at an inspired O2 percentage of 100%. At 5 minutes, to simulate apnoea, the simulated patient's respiratory rate was set to zero. The simulation was stopped when the SpO2 decreased to 80% to simulate a desaturation episode. At that point the simulation was stopped and all physiological parameters were saved.
Starting from this saved baseline state at the SpO2 of 80%, the simulated patient was ventilated with 100% oxygen at a constant tidal volume of 450 ml, and increasing respiratory rates of 5, 10, 20, 30, and 40 breaths/minute. This simulated, and enabled comparison of, the effects of hypoventilation, normal ventilation, and hyperventilation on the return to normal values, of the SpO2 and changes on other parameters, such as the cerebral blood flow. The simulation was stopped after 20 minutes at each respiratory rate. All reported parameters were saved at 15 sec intervals.
Data analysis and presentation
From HumMod software, the data were downloaded as comma delimited files into Excel spreadsheets (Office 2013, Microsoft Corporation, Redmond, WA). Data then were copied into Prizm (Version 6.05, GraphPad Software, La Jolla, CA) and graphs were produced.
Results
Duration of pre-oxygenation: effects on SpO2 during subsequent apnoea
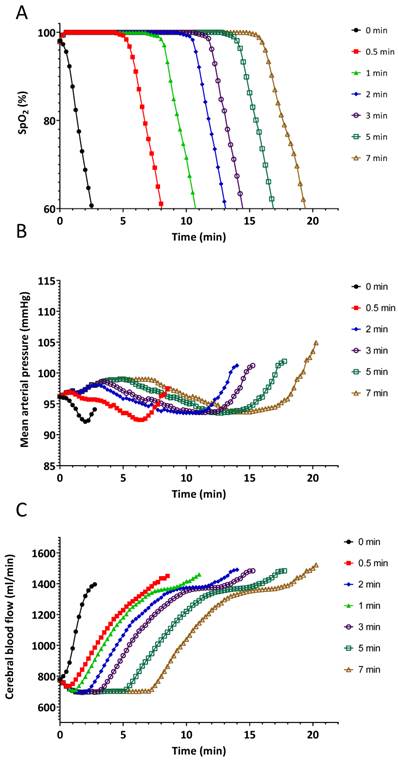
The results of the pre-oxygenation experiment are summarized in Figures 2 and 3. The effects of various durations of pre-oxygenation are shown in the first section of each line in the graph. Apnoea started at the indicated time periods for each line on the graph. Pre-oxygenation had a clinically relevant effect on increasing the duration of apnoea before desaturation occurred (Figure 2A). With no pre-oxygenation, SpO2 started at 98%, it dropped to 95% in 30 seconds and to 90% in an additional 20 seconds (Figure 2A). With pre-oxygenation for 3 min, SpO2 started at 100%, remained at 100% for 7 minutes (420 seconds), dropped to 95% after 30 additional seconds, and reached 90% after another 20 seconds (Figure 2A). A plateau effect of pre-oxygenation was reached by 3 min.: this is shown by the time to the start of the decrease of SpO2 that was quite similar at 5 and 7 min of pre-oxygenation. A critical key physiologic learning point demonstrated was that once SpO2 started to decrease, the rate of change was rapid, irrespective of the duration of pre-oxygenation. (Figure 2A).
Effects of different durations of pre-oxygenation on A.) oxygen saturation (SpO2), B.) mean blood pressure and C.) cerebral blood flow during apnoea. Solid black line with circles indicates no pre-oxygenation on room air. During the pre-oxygenation time 0.5-7 min the simulated patient was set to breathe 450 mL/min spontaneously at 11 breaths/minute with inspired oxygen of 100% for different durations.
Effects of different durations of pre-oxygenation on A.) arterial O2 partial pressure (PaO2), B.) arterial CO2 partial pressure (PaCO2), and C.) arterial pH during apnoea. Solid black line with squares indicates no pre-oxygenation on room air. During the pre-oxygenation time 0.5-7 min the simulated patient was set to breathe 450 mL/min spontaneously at 11 breaths/minute with inspired oxygen of 100% for different durations.

Delays in changes in haemodynamic parameters during apnoea correlated with the length of pre-oxygenation (Figures 2 B and C).
Figure 3 demonstrates the effects of pre-oxygenation on arterial PaO2, PaCO2 and pH during apnoea. Pre-oxygenation is associated with a delay in CO2 accumulation and subsequent acidosis.
Hyperventilation: effects on recovery of SpO2 and cerebral blood flow
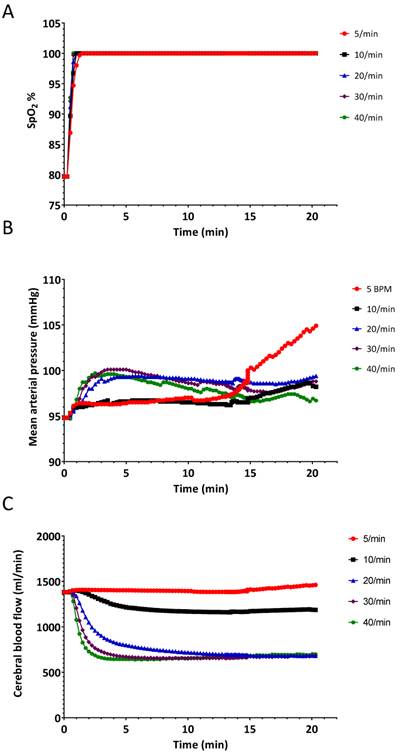
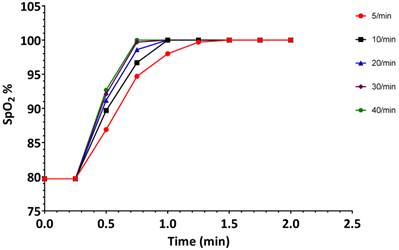
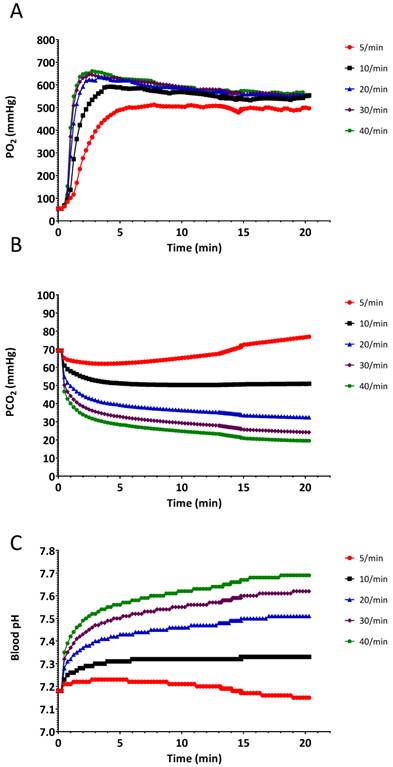
The results of the hyperventilation simulation experiment are summarized in Figures 4-6. Oxygen saturation increased from the baseline reading of 80% and reached 98% within 60 seconds for each of the ventilatory rates (Figure 4A and Figure 5), indicating no benefit of increased ventilatory rates, (or increased minute ventilation) on the recovery to an adequate level of oxygenation. In our simulation experiments, hyperventilation (due to increased respiratory rates with normal tidal volumes) had minimal effects on mean arterial pressure (Figure 4B), thereby not alerting clinicians to potential problems. Figure 4C shows the cerebral blood flow values, which are increased at baseline (due to hypoxia and auto-regulation), thereupon decrease rapidly correlating with PaCO2. Our simulated results indicate that over 20 min, PaCO2 increased from 70 mmHg to 80 mmHg at a ventilation rate of 5 breaths/min, while hyperventilation at 40 breaths/min decreased PaCO2 to 30 mmHg in 120 seconds (Figure 6B).
Changes in A.) oxygen saturation (SpO2) B.) mean arterial pressure and C.) cerebral blood flow when the simulated patient was ventilated at different rates. Experiment was started from a state when the SpO2 was 80%.
Changes in oxygen saturation (SpO2) during the first 2 minutes when the simulated patient was ventilated at different rates. Experiment was started from a state when SpO2 was 80%. Data are the same as in Figure 3A.
Changes in A.) arterial O2 partial pressure (PaO2), B.) arterial CO2 partial pressure (PaCO2), and C.) arterial pH, when the simulated patient was ventilated at different rates. Experiment was started from a baseline state when SpO2 was 80%.
Discussion
Our study strongly supports the ACLS recommendation to avoid hyperventilation. Our data indicate that oxygen saturation does not increase faster if hyperventilation is instituted, and that normal ventilation is a physiologically superior technique with less deleterious effects on the cerebral blood flow.
When a large proportion of trainees exhibit the same behavior in simulation (such as poor pre-oxygenation and post-intubation hyperventilation), it is possible that this is a reflection of their learning and clinical practice.
To promote an improvement in clinical practice, an experiential, hands-on learning session might prove to be more useful than a didactic platform (“lecture”). This is especially important when dealing with a complex task which includes several learning domains. For instance, the trainees: 1.) have to acquire the knowledge (“facts”) as well as understand and apply the knowledge; 2.) have to have the psycho-motor skills to perform the task; 3.) have to have the willingness and attitude to want to change their behavior.
Trainees have been correctly taught that hypoventilation and an increased CO2 concentration are bad for a traumatized brain (with loss of auto-regulation of CBF) as it further increases the intra-cranial pressure. Trainees therefore have a tendency to hyperventilate all patients. We therefore present the cerebral blood flow graphic in Figure 1C deliberately to demonstrate to trainees that, with normal autoregulation, cerebral perfusion INCREASES with an increase in PaCO2 concentration, and that the converse is also true - with NORMAL auto-regulation, a decrease in PaCO2 leads to a decreased cerebral perfusion, which can be deleterious. This use of HumMod clearly demonstrates the value of such a comprehensive modelled simulator. Similarly, the terminal increases in blood pressure in Figure 2B due to hypoxia are demonstrated - this represents the “last-ditch” response of the sympathetic system when a critically low oxygen tension (around 40 mmHg) is reached. This pre-terminal increase in blood pressure is also seen in Figure 4B with the lowest respiratory rate of 5 breaths per minute.
Our results indicate that with the HumMod screen-based human physiology simulator, we were able to closely reproduce the effects of pre-oxygenation presented in other human studies.[10-12] The accuracy of the haemodynamic parameters of HumMod has also been validated, although in a different model.[9] We found a rapid decrease in saturation observed after 50 seconds with apnoea after breathing room air. This rapidity is due to the simulated patient in our model being apnoeic at functional residual capacity (FRC), rather than after a vital capacity inhalation,[13] as would be typical in breath hold diving. Furthermore, the typical pulse oxygen monitor presents a running average of the last 15 pulses on the screen,[14] which further delays the “observed” decrease in saturation in human studies. The mathematical model (HumMod) presents the “real time” saturation in the arterial blood, and it is therefore expected to present a more rapid decline in saturation. As an example, one of the first commercially available oxygen monitors in 1984 (prior to the concept of the running average) showed a decrease in saturation within the breath holding time of Navy divers.[15]
Clinical practice guidelines emphasize the importance of pre-oxygenation [16] as a key technique to increase the “safe” duration of apnoea without desaturation, which would allow more time for intubation. Pre-oxygenation (“denitrogenation”) for 3-5 min at an inspired O2 percentage of 100%, affords a safe SpO2 of 100% for 5-8 minutes while the patient is apnoeic and endotracheal intubation is being performed. Trainees are typically unprepared for the rapid decrease in saturation, once it starts to decrease. This rapid decrease is due to the steepness of the haemoglobin-oxygen dissociation curve. Seeing it several times in succession in a physiologically based, validated simulator, with the ability and time to reflect on the experience, we believe would have a beneficial effect on learning and retention. This prepares the trainee for expecting, observing, and learning from such a rapid decrease in a patient. For example, during an acute crisis event, without prior preparation, the trainees are focused on performing tasks to manage the crisis: they tend to be overwhelmed [17], and learning is compromised.[18] Furthermore, after the crisis event, there is seldom time for debriefing and reflective learning.[19] The first three steps of the Kolb's Learning Cycle can be comprehensively addressed by the learning using the simulation program. This learning will prepare the trainees for the 4th step, where the learner applies the new understandings in clinical practice. [19]
The 2010 Advanced Cardiovascular Life Support (ACLS) guidelines [5] strongly emphasize the importance of ventilatory rates of less than 8-10 breaths/min in adults, thereby avoiding the unwanted effects of hyperventilation and hypocarbia with the resulting decreased cerebral and intrathoracic blood flow. Unfortunately, these guidelines are frequently not followed during the excitement of resuscitation in emergency patient care settings, where hyperventilation is one of the most common mistakes made during resuscitation.[20] Another example of the deleterious effects of hyperventilation is the study by Aufderheide et al.[3] They found a mortality rate of 100% when an average percentage of time of inspiratory positive pressure of 47% was recorded in the lungs.[3] They also found in their study [3] that the patients were ventilated at rates of 30 breaths/min, and the average duration of each inspiration and exhalation was 1 second each.
Our study supports the ACLS recommendation to avoid hyperventilation. The effect of hyperventilation is difficult to appreciate on standard monitors used in the emergency setting, as well as in the anesthesia setting. Trainees and practitioners focus on the saturation: they are relieved when SpO2 is 100% before an intubation, or when the crisis period has been solved by placing the endotracheal tube. Since the hemodynamic effects of hyperventilation are not reflected by dramatic changes in heart rate and systemic blood pressure (see Figures 3c and 3d), the providers are typically unaware of the effects of hyperventilation on the physiology. Our observations, and published data obtained during high fidelity simulation mock codes,[1] both confirm that once SpO2 drops to 80%, most health care providers tend to hyperventilate the patients with the “mistaken” concept that “more oxygen delivered faster into the lungs, is better.” Robotic simulation using standard monitors does not seem to be effective to changing this behavior. However, model-driven simulators (robotic and/or flat screen) have the capability for the instructor to extract all the physiological variables from the model as an aid to teaching and understanding.
Hyperventilation has profound effects on the central and systemic circulations.[21;22] Experimental studies in pigs indicate that blood flow to the brain stem and cerebellum decreases soon after hyperventilation starts. Mechanical hyperventilation with low frequency and large tidal volumes decreases cardiac output and reduces the flow to most tissues, including the brain and coronary arteries.[3;23] If hyperventilation is induced by an increased frequency at normal tidal volumes, as in our simulation experimental setting, cardiac and cerebral blood flow decreases without major changes in cardiac output.[23]
Noting the short time courses of the changes in saturation, we believe it is important for simulation instructors to base the physiology in their simulation sessions on scientifically based, model driven data, rather than on their impressions, especially given the low incidence and infrequent opportunities to manage patients presenting with low FRCs (fever, pregnancy, obesity, etc.) where minimal pre-oxygenation occurred.[24] Since there is a lack of sophistication of existing physiologic monitoring capability outside of the OR and the ICU, few clinicians will have extensive experience with a controlled range of minute ventilations in patients with saturations of 80% after prolonged intubation attempts. Furthermore, during typical clinical cases existing standard monitors are not able to provide data on minute by minute estimations of H+, PaCO2, CBF, etc. Therefore, simulation instructors can use such a physiologically based simulation program to generate “realistic” parameters when using a robotic simulator in an “instructor driven”, override mode. We suggest the combined use of model driven, scientifically based programs to support and inform the development of instructor driven simulation scenarios.
Limitations to our study include: i) We could only study a small fraction of the available parameters in the model. For instance, PEEP/CPAP (positive end expiratory pressure and continuous positive airway pressure) would be expected to influence the results via affecting not only FRC, but also the shunt fraction, cardiac output, distribution of blood contained in each vascular bed, etc. This should be addressed in a future study, once PEEP and CPAP, and their effect on the shunt fraction, have been built into the model. ii) Apneic oxygenation, e.g. with a channel conducting oxygen (rather than being used as a suction channel) close to the glottis opening would also affect the results by effectively decreasing the anatomic dead space. In a future study, the minimum and optimal oxygen flow rates could be studied to provide guidance for the design and utilization of such equipment.[25]
Based on the demonstrated accuracy of the HumMod program, we propose that simulation instructors calibrate and validate their scenarios using physiology-based, mathematically modelled, simulation programs, such as HumMod.
We also believe that the ability of the mathematical simulation models to “look inside” the simulated patient will give the trainees a greater understanding of the value and need for pre-oxygenation, as well as the futility and dangers of hyperventilation during stressful circumstances. We believe such understanding might lead to a beneficial change in behaviors.
Competing Interests
The authors have declared that no competing interest exists.
References
1. Niebauer JM, White ML, Zinkan JL, Youngblood AQ, Tofil NM. Hyperventilation in pediatric resuscitation: performance in simulated pediatric medical emergencies. Pediatrics. 2011;128(5):e1195-e1200
2. Gebremedhn EG, Mesele D, Aemero D, Alemu E. The incidence of oxygen desaturation during rapid sequence induction and intubation. World J Emerg Med. 2014;5(4):279-285
3. Aufderheide TP, Lurie KG. Death by hyperventilation: a common and life-threatening problem during cardiopulmonary resuscitation. Crit Care Med. 2004;32(9 Suppl):S345-S351
4. Park SO, Shin DH, Baek KJ, Hong DY, Kim EJ, Kim SC. et al. A clinical observational study analysing the factors associated with hyperventilation during actual cardiopulmonary resuscitation in the emergency department. Resuscitation. 2013;84(3):298-303
5. Neumar RW, Otto CW, Link MS, Kronick SL, Shuster M, Callaway CW. et al. Part 8: adult advanced cardiovascular life support: 2010 American Heart Association Guidelines for Cardiopulmonary Resuscitation and Emergency Cardiovascular Care. Circulation. 2010;122(18 Suppl 3):S729-S767
6. Abram SR, Hodnett BL, Summers RL, Coleman TG, Hester RL. Quantitative Circulatory Physiology: an integrative mathematical model of human physiology for medical education. Adv Physiol Educ. 2007;31(2):202-210
7. Hester RL, Brown AJ, Husband L, Iliescu R, Pruett D, Summers R. et al. HumMod: A Modeling Environment for the Simulation of Integrative Human Physiology. Front Physiol. 2011;2:article12
8. Summers RL. Computer simulation studies and the scientific method. J Appl Anim Welf Sci. 1998;1(2):119-131
9. Summers RL, Ward KR, Witten T, Convertino VA, Ryan KL, Coleman TG. et al. Validation of a computational platform for the analysis of the physiologic mechanisms of a human experimental model of hemorrhage. Resuscitation. 2009;80(12):1405-1410
10. Benumof JL, Dagg R, Benumof R. Critical hemoglobin desaturation will occur before return to an unparalyzed state following 1 mg/kg intravenous succinylcholine. Anesthesiology. 1997;87(4):979-982
11. Stewart IB, Bulmer AC, Sharman JE, Ridgway L. Arterial oxygen desaturation kinetics during apnea. Med Sci Sports Exerc. 2005;37(11):1871-1876
12. Tanoubi I, Drolet P, Donati F. Optimizing preoxygenation in adults. Can J Anaesth. 2009;56(6):449-466
13. Villars PS, Kanusky JT, Levitzky MG. Functional residual capacity: the human windbag. AANA J. 2002;70(5):399-407
14. Vagedes J, Poets CF, Dietz K. Averaging time, desaturation level, duration and extent. Arch Dis Child Fetal Neonatal Ed. 2013;98(3):F265-F266
15. Foster P, Murray W, Schneeberger J, Howell L. Oxygen saturation during breath-holding, Pulse Oximetry. Payne J, Severinghaus J, editors. London: Springer Verlag. 1986:143-150
16. Weingart SD, Levitan RM. Preoxygenation and prevention of desaturation during emergency airway management. Ann Emerg Med. 2012;59(3):165-175
17. Yerkes RM, Dodson JD. The Relation of Strength of Stimulus to Rapidity of Habit-Formation. Journal of Comparative Neurology and Psychology. 1908;18:459-482
18. Mackenzie CS, Wiprzycka UJ, Hasher L, Goldstein D. Associations between psychological distress, learning, and memory in spouse caregivers of older adults. J Gerontol B Psychol Sci Soc Sci. 2009;64(6):742-746
19. Schultz K, McEwen L, Griffiths J. Applying Kolb's Learning Cycle to Competency-Based Residency Education. Acad Med. 2014
20. O'Neill JF, Deakin CD. Do we hyperventilate cardiac arrest patients? Resuscitation. 2007;73(1):82-85
21. Inglesby TV, Costin JC, Hanley HG, Berry PE, Skinner NS Jr. Reflex regulation of peripheral blood flow during lung hyperinflation. Am J Cardiol. 1972;29(5):650-658
22. Pitts S, Kellermann AL. Hyperventilation during cardiac arrest. Lancet. 2004;364(9431):313-315
23. Karlsson T, Stjernstrom EL, Stjernstrom H, Norlen K, Wiklund L. Central and regional blood flow during hyperventilation. An experimental study in the pig. Acta Anaesthesiol Scand. 1994;38(2):180-186
24. Langeron O, Birenbaum A, Le SF, Raux M. Airway management in obese patient. Minerva Anestesiol. 2014;80(3):382-392
25. Boedeker BH, Bernhagen M, Miller DJ, Murray WB. User preference comparing a conventional videolaryngoscope blade vs. a novel suction videolaryngoscope blade in simulated hemorrhagic airway intubation. Stud Health Technol Inform. 2012;173:72-74
Author contact
![]() Corresponding author: ANNA A. LERANT, MD, Department of Anaesthesiology, University of Mississippi Medical Center, University of Mississippi Medical Center, 2500 N. State Street Jackson, MS 39216-4505. Phone: 601-815-7485; FAX: 601-815-9182; Email: alerantedu
Corresponding author: ANNA A. LERANT, MD, Department of Anaesthesiology, University of Mississippi Medical Center, University of Mississippi Medical Center, 2500 N. State Street Jackson, MS 39216-4505. Phone: 601-815-7485; FAX: 601-815-9182; Email: alerantedu