Impact Factor ISSN: 1449-1907

 Global reach, higher impact
Int J Med Sci 2015; 12(5):362-368. doi:10.7150/ijms.10540 This issue Cite
Research Paper
Association of Vitamin D Levels with Type 2 Diabetes in Older Working Adults
Daniel Mauss1 ![]() , Marc N. Jarczok1, Kristina Hoffmann1, G. Neil Thomas1,2, Joachim E. Fischer1
, Marc N. Jarczok1, Kristina Hoffmann1, G. Neil Thomas1,2, Joachim E. Fischer1
1. Mannheim Institute of Public Health, Social and Preventive Medicine, Medical Faculty Mannheim, Heidelberg University, Mannheim, Germany.
2. Department of Public Health, Epidemiology and Biostatistics, School of Health and Population Sciences, University of Birmingham, United Kingdom.
Received 2014-9-14; Accepted 2015-3-4; Published 2015-5-1
Abstract
OBJECTIVES: Increasing evidence suggests that vitamin D plays a role in the development of chronic diseases including type 2 diabetes (DM). Aim of the study was to explore the association of vitamin D levels with prevalent DM in a sample of predominantly healthy working adults older than 45 years.
METHODS: This cross-sectional study (2009-2011) involved 1821 employees of a German engineering company (83.1% male, mean age 51.9 ±5.6 years). Sociodemographics and medical history were assessed by self-report. Clinical characteristics were obtained including blood samples to determine vitamin D levels and diabetes status by fasting plasma glucose (FPG) and glycosylated hemoglobin (HbA1c). Vitamin D was grouped into one of four categories (<10 ng/ml, 10-19.9 ng/ml, 20-29.9 ng/ml, ≥30 ng/ml). Bivariate associations between vitamin D categories and a composite indicator for DM (FPG ≥126 mg/dl or HbA1c ≥6.5% or self-reported diagnosis) were calculated; multivariable models tested this association further, controlling for potential confounders.
RESULTS: Severe vitamin D deficiency (<10 ng/ml) was associated with increasing FPG (β 3.13; 95%CI: 0.78, 5.47; p≤0.01) and HbA1c (β 0.15; 95%CI: 0.08, 0.23; p≤0.001) values in adjusted linear regression models. In multivariable models, severe vitamin D deficiency was associated with DM (OR 2.55; 95%CI 1.16, 5.62; p≤0.05) after controlling for potential confounders.
CONCLUSIONS: Vitamin D deficiency is associated with prevalent DM in working older adults. The findings highlight that the workplace may be a unique location for conducting large-scale health screening to identify those at risk of DM using vitamin D.
Keywords: 25-hydroxyvitamin D, cardiovascular disease, diabetes mellitus, employees, work health check
Introduction
The global prevalence of vitamin D (25-hydroxyvitamin D) deficiency is estimated at 30-87% [1]. In Germany, these estimates range between 15-30% in the general population [2]. Deficiency of 25-hydroxyvitamin (25(OH)D) has been characterized as values <20 ng/ml (50 nmol/l) and has been recognized as a cause of childhood rickets and adult osteomalacia since the early 19th century. Severe deficiency has been defined as less than 10 ng/ml (25 nmol/l) [3]. In the last 40 years, observational studies have linked 25(OH)D deficiency to the development of chronic conditions including cardiovascular disease [4] and diabetes mellitus [5]. While national and international guidelines have been developed to ensure good calcium homeostasis [6], few address the maintenance of adequate 25(OH)D levels as a means of preventing chronic diseases because of limited scientific evidence for a causal link [7,8].
The prevalence of type 2 diabetes has increased in industrial countries and is expected to reach a world-wide prevalence of 4.4% by 2030 [9]. Previous work also documents that the mean age of type 2 diabetes diagnosis has decreased in some settings from 52 to 46 years between 1988 and 2000 [10]. Both trends are therefore increasingly likely to impact on adults of working age, compounding their economic and social effects and highlighting their relevance to public health. Diabetes prevention is now a public health priority in many countries worldwide.
Deficiency of 25(OH)D has been implicated in the pathogenesis of diabetes although exact pathophysiological pathways remain unclear [5]. Previous observational work, however, calls this association into question. Although perhaps related to small sample sizes and reduced power to detect small but meaningful associations, some studies report no association [11]. Furthermore, many of these have explored the association of diabetes and vitamin D levels in older and chronically ill participants, but not in healthy adults like working populations.
Although chronic diseases such as cardiovascular disease or type 2 diabetes were once thought to be a problem of older age groups, there is a shift toward onset during the population´s working age [12]. Apparently healthy people can suffer from 25(OH)D deficiency as well as from type 2 diabetes. The occupational physician and the workplace is therefore a promising setting for screening and prevention. Following the guidelines of the American Diabetes Association 2011 [13] type 2 diabetes screening of healthy adults should start at the age of 45 every 3 years. Unfortunately only few healthy employees of this age turn to a general practitioner (GP) on a regular basis. The compliance of routine screenings, particularly the so-called “check-up 35” offered by the GP and paid by the public health insurance in Germany is only 25% [14]. Workplace settings should exceed the participation rate of this public approach. Likewise, a workplace setting can lead to early detection of 25(OH)D deficiency as this is prevalent in all age groups [3] and a substantial numbers of previously unrecognized diabetes cases [15]. The question if vitamin D deficiency and diabetes mellitus are linked together in the workforce is still unanswered. The aim of the present study is to investigate the relationship between vitamin D levels and the prevalence of type 2 diabetes in working adults older than 45 years.
Methods
Study sample
This report is based on cross-sectional data from the Mannheim Industrial Cohort Study (MICS). All full- and part-time workers ≥45 years (n=4,539) at four subsidiary sites of an engineering company in Southern Germany were invited to participate in a health assessment in the workplace. Participation was voluntary and recruitment took place during working hours. No incentives except a full personal health report were provided.
Ethics permission
Secondary analysis of all data was approved by the Ethics Committee of the Mannheim Medical Faculty, Heidelberg University. Written informed consent was given by each participant.
Work health check
Participants were recruited and examined between September 2009 and May 2011. Data were collected between 7am and 5pm using participant-completed questionnaires and a clinical examination.
Self-reported characteristics
Online and paper questionnaires comprised of 25 items assessed respondents' age, gender, management level, and medical history for chronic diseases (cardiovascular disease, arterial hypertension, type 2 diabetes). The work-related stress level was measured by the effort-reward ratio, which has been previously shown to be related to diabetes mellitus [16]. Questionnaire items also assessed health behaviors including current smoking status (current, past, never), fish consumption (< or ≥ 2 times a week), alcohol consumption (no alcohol, 1-2 times /month, 1-2 times /week, 3-5 days/week, 6-7 days/week), and physical exercise level (3 times a week, more than once a week, once a week, 1-3 times a month, seldom or never).
Clinically-assessed characteristics
The clinical examination assessed anthropometric indices (body mass index, waist circumference), physiological measures including diastolic and systolic blood pressure measurements, and collection of blood and urine specimens. The body mass index was calculated in the usual manner (weight in kilograms/height in meters²) with the participant dressed in light clothes and without shoes. The waist circumference was measured in centimeters horizontally around the smallest circumference between the ribs and iliac crest, or at the navel if no natural waistline was present. Blood pressure was recorded twice with the participant in a seated position using an automated Critikon Dinamap Portable and Neonatal Vital Signs Monitor (Model 8100). Readings, expressed in millimeters of mercury (mmHg), were made using the dominant arm after a standardized five minutes rest period. We used the mean of these measures in our analysis. Arterial hypertension was considered to be present if one of the following criteria was met according to definitions of the WHO [17]: (1) diastolic blood pressure ≥90 mmHg; (2) systolic blood pressure ≥140 mmHg; (3) self-reported hypertension. A spot morning urine sample was obtained to assess urine albumin and fasting a.m. blood samples assessed the following biochemical markers: serum C-reactive protein (CRP), creatinine, glycosylated hemoglobin (HbA1c), 25-hydroxyvitamin D, and fasting plasma glucose (FPG). All urine and blood samples were processed at a single laboratory at which standardization procedures were followed daily for each assay. Specifically, FPG was measured by the glucose hexokinase enzymatic assay (Olympus Glucose OSR6121) and HbA1c by the Roche second generation hemoglobin A1c immunoassay. Vitamin D samples were analyzed with standard laboratory procedures using the Roche Modular Analytics E170 Vitamin D3 (25-OH) assay.
Diagnosis of type 2 diabetes
Following the criteria of the American Diabetes Association [18] and consensus statements issued by the World Health Organization (WHO), International Diabetes Federation, and European Association for the Study of Diabetes [19] diabetes mellitus was considered present if at least one of the following was met: (1) FPG ≥126 mg/dl (7.0 mmol/l); (2) HbA1c ≥6.5% (48 mmol/mol); (3) self-reported diabetes with confirmation of physician diagnosis.
Classification of vitamin D levels
We used widely accepted cut-off values for 25(OH)D to create four vitamin D categories: severe deficiency, <10 ng/ml (25 nmol/l); moderate deficiency, 10-19.9 ng/ml (25-49.9 nmol/l); insufficiency, 20-29.9 ng/ml (50-74.9 nmol/l); sufficiency, ≥30 ng/ml (75 nmol/l) [3,5].
Data analysis
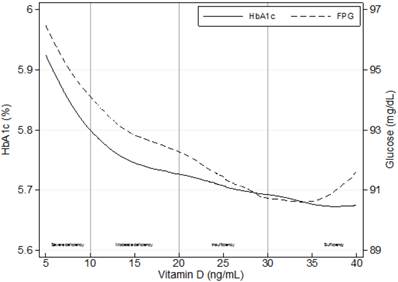
We present descriptive, univariate analysis using means and standard deviations. In cases in which the distribution of a parameter was skewed, we applied a transformation (e.g., logarithmic, squared, square root, or 1/square root) to better approximate a normal distribution. Due to the transformation, the sign of a number appear in some cases negative, where positive is expected. Next, we tested linear trend for continuous variables and used the p for linear-by-linear test for categorical variables. Bivariate correlations between our indicator of prevalent type 2 diabetes and a range of self-reported (demographic and behavioral) and clinically-related variables were assessed using Cramers V for categorical variables. Biserial correlations were used to correlate continuous with dichotomous variables. Bivariate correlations were assessed between vitamin D levels and HbA1c and FPG levels using Pearson correlation coefficient. Additionally, figure 1 displays locally weighted regression (LOWESS) of HbA1c with 25(OH)D and FPG with 25(OH)D.
Crude associations of mean levels of glycosylated hemoglobin (HbA1c) and fasting plasma glucose (FPG) with 25-hydroxyvitamin D levels using locally weighted regressions (LOWESS), n=1,821.
Separate linear regression models tested the association of continuous values for FPG and HbA1c with the four categories of 25(OH)D levels. We used a two-step approach, controlling for all variables that showed significant correlation within bivariate comparisons (age, body mass index, hypertension, and C-reactive protein) complemented by variables (smoking, work stress, alcohol consumption, and physical exercise) which have been previously reported to be associated with type 2 diabetes before. A backward elimination modeling approach was then applied to limit the number of confounders for predictive modeling, starting with a one-by-one elimination of the least significant confounder. The stopping rule for exclusion was a standard significance level (p≤0.05). Identified confounders were age, body mass index, smoking, and urine albumin. In a final step, we conducted multivariable logistic regression analyses and used odds ratios (OR) with 95% confidence intervals (95% CI) to demonstrate the association of 25(OH)D categories with prevalent diabetes mellitus. As before, backward elimination was used to reduce risk of overfitting the model. We used Stata 12.1 MP (College Station, TX: StataCorp LP) for all statistical analysis.
Results
Demographics
A total of 2,056 employees participated in the study (45% response rate). Of these, 1,821 participants provided complete data for the analysis (site A, n=410; site B, n=200; site C, n=697; site D, n=514). The mean age of this final sample size was 51.9 ±5.6 years, 17% of participants were female, and 15% were current smokers (Table 1). The excluded subjects did not differ significantly from those included in the analysis with respect to age, gender, and smoking status.
Characteristics of study population (n=1,821) according to 25-hydroxyvitamin D levels
| Total N=1821 | Sufficiency (≥30 ng/ml) N=402 (22%) | Insufficiency (20-29.9 ng/ml) N=578 (32%) | Moderate deficiency (10-19.9 ng/ml) N=607 (33%) | Severe deficiency (<10 ng/ml) N=234 (13%) | p trend | ||||||
|---|---|---|---|---|---|---|---|---|---|---|---|
| mean | SD | mean | SD | mean | SD | mean | SD | mean | SD | ||
| Age (years) | 51.9 | ±5.6 | 51.8 | ±6.0 | 51.9 | ±5.4 | 51.8 | ±5.6 | 52.4 | ±5.6 | 0.84 |
| Gender (% female) | 16.9 | 13.4 | 15.4 | 17.5 | 24.8 | ≤0.001 | |||||
| Upper management (%) | 10.2 | 10.7 | 10.7 | 9.1 | 11.1 | 0.74 | |||||
| BMI (kg/m²) | 24.4 | ±3.8 | 23.8 | ±3.2 | 24.6 | ±3.9 | 24.5 | ±3.9 | 24.6 | ±4.0 | 0.027 |
| Waist circumference (cm) | 95.3 | ±11.5 | 93.3 | ±10.5 | 95.6 | ±11.5 | 95.9 | ±11.6 | 96.1 | ±12.3 | 0.01 |
| Systolic BP (mmHg) | 140 | ±15.3 | 140 | ±15.1 | 140 | ±15.2 | 140 | ±15.2 | 142 | ±16.3 | 0.99 |
| Diastolic BP (mmHg) | 83.1 | ±11.3 | 83.2 | ±11.1 | 82.8 | ±11.1 | 83 | ±11.5 | 83.8 | ±11.9 | 0.92 |
| Hypertension (%) | 56.9 | 54.2 | 56.7 | 56.3 | 63.2 | 0.14 | |||||
| CRP (mg/l) | 1.8 | ±3.1 | 1.6 | ±2.5 | 1.8 | ±4.0 | 1.7 | ±2.5 | 1.9 | ±2.9 | 0.50 |
| FPG (mg/dl) | 92.0 | ±15.3 | 90.1 | ±10.0 | 92.0 | ±13.9 | 92.6 | ±16.1 | 93.9 | ±22.4 | 0.006 |
| HbA1c (%) | 5.73 | ±0.48 | 5.67 | ±0.28 | 5.72 | ±0.43 | 5.74 | ±0.53 | 5.83 | ±0.68 | ≤0.001 |
| Serum creatinine (mg/dl) | 1.09 | ±0.16 | 1.12 | ±0.16 | 1.09 | ±0.17 | 1.08 | ±0.16 | 1.07 | ±0.15 | ≤0.001 |
| Urine albumin (mg/l) | 6.8 | ±31.3 | 9.0 | ±50.4 | 6.4 | ±31.2 | 6.4 | ±16.0 | 5.5 | ±14.5 | 0.05 |
| Diabetes mellitus (%) | 6.1 | 3.2 | 6.8 | 6.9 | 7.3 | 0.09 | |||||
| ERI | 1.3 | +0.5 | 1.3 | ±0.5 | 1.3 | ±0.5 | 1.3 | ±0.5 | 1.2 | ±0.4 | 0.013 |
| Alcohol consumption (%) | 15.2 | 17.7 | 15.7 | 14.7 | 10.7 | ≤0.001 | |||||
| Fish consumption (%) | 13.1 | 11.2 | 11.3 | 15.5 | 15.0 | 0.027 | |||||
| Physical exercise (%) | 44.0 | 59.2 | 43.6 | 38.6 | 33.3 | ≤0.001 | |||||
| Current smoker (%) | 14.8 | 18.7 | 12.6 | 15.5 | 12.0 | 0.019 | |||||
BMI=body mass index; BP=blood pressure; CRP=C-reactive protein; FPG=fasting plasma glucose; HbA1c=glycosylated hemoglobin; ERI=effort-reward ratio; fish consumption=at least twice a week; alcohol=6-7 days/week; physical exercise=more than once a week; upper management=individuals who are in charge of leading other managers of the company
Clinically-assessed characteristics
A total of 111 participants (6%) fulfilled criteria for prevalent diabetes mellitus with two-thirds self-reporting the diagnosis. The overall mean 25(OH)D level was 22.1 ±10.8 ng/ml with severe deficiency present in 13% of participants and moderate deficiency in 33%. Participants with severe 25(OH)D deficiency were more likely to be female and to have significantly higher values for waist circumference, FPG, and HbA1c (p trend≤0.01). In contrast, those within the highest 25(OH)D category were more likely to consume alcohol and actively smoke, yet are also more physically active. Systolic and diastolic blood pressure did not differ between groups. The proportion of participants with prevalent diabetes mellitus increased with decreasing levels of 25(OH)D (3% to 7%).
Compared to those in the non-diabetic group, participants with prevalent diabetes showed lower levels of 25(OH)D (22.0 ±10.8 ng/ml vs. 20.3 ±10.0 ng/ml, p≤0.05).
Data analyses
Bivariate comparisons of diabetes mellitus with multiple variables (Table 2) showed highly significant (p≤0.001) correlations with age, a diagnosis of arterial hypertension, urine albumin, body mass index, and waist circumference. Although correlations were somewhat smaller, we observed significant associations between prevalent diabetes mellitus and systolic blood pressure and CRP (p≤0.01) as well as diastolic blood pressure (p≤0.05). Recruitment period was not associated with diabetes mellitus.
Bivariate correlations of multiple variables with prevalence of type 2 diabetes, n=1,821
| Diabetes mellitus (r) | |
|---|---|
| Self-reported characteristics | |
| Age¶ | 0.126*** a |
| Gender | -0.004 b |
| Upper management | -0.010 b |
| ERI§ | -0.017 a |
| Physical exercise | 0.069# b |
| Fish consumption | 0.010 b |
| Alcohol consumption | 0.024 b |
| Recruitment period | 0.038 b |
| Current smoker | 0.042# b |
| Clinically-assessed characteristics | |
| 25-hydroxyvitamin D | -0.039# a |
| Urine albumin | 0.107*** a |
| Serum creatinine$ | -0.035 a |
| Systolic BP† | -0.072** a |
| Diastolic BP | 0.005* a |
| Hypertension | 0.092*** b |
| BMI† | -0.196*** a |
| Waist circumference$ | 0.207*** a |
| C-reactive protein | 0.062** a |
***p≤0.001, **p≤0.01, *p≤0.05, #p≤0.10
Transformation: §=log; $=sqrt; †=1/(square root); ¶=square
The transformations lead to reversed sign in BMI, creatinine, and systolic blood pressure.
a=Biserial correlation for continuous to dichotomous variables
b=Cramers V for categorical variables
BMI=body mass index; BP=blood pressure; ERI=effort-reward imbalance; fish consumption=at least twice a week; alcohol=6-7 days/week; physical exercise=more than once a week; recruitment period=month of examination; upper management=individuals who are in charge of leading other managers of the company
Continuous values for HbA1c (r=-0.088; p≤0.01) and FPG (r=-0.064; p≤0.01) were negatively associated with 25(OH)D levels (Figure 1). Linear regression analysis indicated independent associations of both parameters with severe 25(OH)D deficiency (FPG: β=3.13, p≤0.01; HbA1c: β=0.15, p≤0.001) after adjusting for potential confounders using a backward elimination (Table 3).
Independent association of 25-hydroxyvitamin D categories with continuous values of FPG and HbA1c, n=1,821#
| Sufficiency (≥30 ng/ml) | Insufficiency (20-29.9 ng/ml) | Moderate deficiency (10-19.9 ng/ml) | Severe deficiency (<10 ng/ml) | ||||
|---|---|---|---|---|---|---|---|
| Reference category | β | 95%CI | β | 95%CI | β | 95%CI | |
| Backward elimination | |||||||
| FPG | 1 | 1.08 | -0.76, 2.92 | 1.85* | 0.02, 3.67 | 3.13** | 0.78, 5.47 |
| HbA1c | 1 | 0.04 | -0.02, 0.10 | 0.06* | 0.03, 0.12 | 0.15*** | 0.08, 0.23 |
***p≤0.001; **p≤0.01; *p≤0.05
FPG=fasting plasma glucose
HbA1c=glycosylated hemoglobin
95%CI=95% confidence interval
#adjusted for age, body mass index, smoking, and urine albumin
Compared with those with sufficient 25(OH)D levels, participants with insufficient, deficient and severely deficient 25(OH)D levels had higher odds of prevalent diabetes (Table 4). For those in the severely deficient category, OR was 2.34 (95%CI: 1.12, 4.92) for prevalent diabetes mellitus. In each case, associations increased modestly rather than being attenuated following adjustment for a range of potential confounders and remained statistically significant (OR 2.55 [95%CI: 1.16, 5.62]).
Crude and adjusted association of 25-hydroxyvitamin D categories with prevalent type 2 diabetes, n=1,821
| Sufficiency (≥30 ng/ml) | Insufficiency (20-29.9 ng/ml) | Moderate deficiency (10-19.9 ng/ml) | Severe deficiency (<10 ng/ml) | ||||
|---|---|---|---|---|---|---|---|
| Reference category | OR | 95%CI | OR | 95%CI | OR | 95%CI | |
| Model 1 | |||||||
| DM | 1 | 2.17* | 1.14, 4.11 | 2.22** | 1.18, 4.20 | 2.34* | 1.12, 4.92 |
| Model 2 | |||||||
| DM | 1 | 2.18* | 1.10, 4.31 | 2.29* | 1.17, 4.50 | 2.55* | 1.16, 5.62 |
**p≤0.01; *p≤0.05
DM=Diabetes mellitus, defined as HbA1c ≥6.5%, fasting plasma glucose ≥126 mg/dl or self-reported diagnosis confirmed by a physician
95%CI=95% confidence interval
OR=odds ratio
Model 1 unadjusted
Model 2 backward elimination, adjusted for age, body mass index, smoking, and urine albumin
Discussion
This cross-sectional study is the first study that observed an association between 25(OH)D levels and laboratory indicators of type 2 diabetes in a large sample of healthy older adults in the workforce, as far as we know. When the dependent variable was defined in terms of prevalence and used either self-reported diagnosis or threshold values for laboratory indicators, an association was present for those with insufficient, deficient and severely deficient levels, compared with those with a normal level. Importantly, these associations remained robust to adjustment by a range of potential confounders.
In our population, severe 25(OH)D deficiency (<10 ng/ml) was present in 13% of all participants; 33% had levels consistent with moderate deficiency (10-19.9 ng/ml). These findings are slightly lower than in a population-based German study, which reported a 16% prevalence of severe deficiency in individuals aged 18-79 years [3]. Deficiency of 25(OH)D was associated with female gender and overweight, whereas sufficient levels were associated with regular physical exercise, smoking and alcohol intake. The association of life style factors has been explored before [20]. Elevated body mass index and less physical exercise were associated with 25(OH)D deficiency. These findings may be related as physical inactivity may be more present among obese people. A lot of physical exercise is normally done outdoors and thus allows photosynthesis of vitamin D. Furthermore, vitamin D is a lipophilic vitamin and stored in body fat cells which makes it more difficult for obese people to take advantage of this vitamin. The association of 25(OH)D deficiency and female gender is common in Arabian countries due to the practice of purdah whereby all skin is covered [21], but not in European areas in general. Only 17% of our study population were female with a mean age of 51.8 years. This association could be related to postmenopausal effects which has been shown before [22]. Surprisingly, 25(OH)D deficiency was inversely associated with smoking and regular alcohol intake. A Danish study showed as well that people abstaining from alcohol intake were more likely to suffer from 25(OH)D deficiency [20]. Our finding regarding smoking is contrary to most of the present literature [23]. Higher 25(OH)D levels may have been observed in smokers in this sample because of legal regulations requiring employees to smoke outside the company buildings. This regulation may therefore have led to more frequent sunlight exposure and greater production of vitamin D precursors in the skin. Another reason could be the use of a Roche assay that overestimates 25(OH)D levels in smokers by unknown mechanisms [24].
Diabetes was present in 6% of our study population, which is comparable to explorations of other employers [15]. Although we found a significant association of both FPG and HbA1c with severe 25(OH)D deficiency, similar findings have been reported inconsistently in previous work. While an inverse association of 25(OH)D and FPG has been observed several times in different populations [5,25,26], inverse associations with HbA1c were not detected in younger Americans [25] but detected in older Germans [5]. There are several lines of evidence to support that vitamin D influences impaired β-cell function, insulin resistance and systematic inflammation [27]. It has been demonstrated that vitamin D receptors exist in many tissues including pancreatic β-cells [4], allowing vitamin D to potentially modulate the insulin response to elevated blood glucose.
One third (33%) of all diabetes cases in our apparently healthy study sample were newly detected reflecting the presence of a high proportion of undiagnosed diabetes cases in the population. Therefore, the workplace is a valuable setting for health screenings [15]. To our knowledge, the current study is the first to explore the association of 25(OH)D deficiency and the prevalence of type 2 diabetes in healthy working adults. The German LURIC study found that higher 25(OH)D levels were significantly associated with better glycemic status in 3,316 elderly patients scheduled for coronary angiography [5]. Similar results were described by a Korean study group exploring 12,263 subjects of the Korea National Health and Nutrition Examination Survey older than 19 years [28]. Additionally a meta-analysis with 3,612 diabetes cases (mean age 61.6 years) demonstrated an inverse association between circulating 25(OH)D and incident type 2 diabetes [29]. Another meta-analysis with 4,996 cases showed that each 10 nmol/L increment in 25(OH)D levels was significantly associated with a 4% lower risk of type 2 diabetes [30]. Nevertheless, while some recent publications report associations of 25(OH)D levels and type 2 diabetes [31,32] there are others stating the opposite [33,34] indicating a lack of reliable evidence. Furthermore, current research is inconclusive whether vitamin D supplements are beneficial for otherwise healthy adults in preventing diseases beyond bone disorders [35]. Results of a large clinical trial at Harvard University (VITAL study) with 25,875 older participants should soon arrive to get a better understanding of multiple clinical outcomes.
When interpreting our findings, several limitations must be taken into consideration. First, as the study design is cross-sectional, it is not possible to draw any causal conclusion about the direction of effects in the associations we observed. Second, the generalizability of our findings is somewhat limited as our sample consisted predominantly of male industrial workers in Germany. Our findings might not be generalizable to other ethnic groups or females. Nevertheless, the homogeneous study sample may have reduced a potential bias of vitamin D variations as other ethnic groups tend to have different vitamin D levels. Third, we did not assess anti-diabetic medication and status of type 1 diabetes of participants. Although prevalence of type 1 diabetes is less than 0.3% in Western Europe, this information should be included in the medical history assessment of further studies.
Conclusion
In conclusion, the findings of our study suggest that vitamin D is inversely associated with type 2 diabetes in German industrial workers older than 45 years. Further longitudinal studies should seek to establish clearly the temporal sequence of this association. Ultimately, randomized controlled trials are needed to examine whether vitamin supplementation is a useful intervention in preventing or delaying the onset of type 2 diabetes. While vitamin D screenings of healthy adults cannot be recommended due to missing evidence at present, people at risk for type 2 diabetes could possibly benefit from a screening for 25(OH)D deficiency in addition to the Endocrine Society guideline [36]. The workplace seems to be a promising setting for that.
Acknowledgements
We are indebted to HealthVision Ltd, Berlingen Switzerland for providing the data. We also gratefully acknowledge Professor David Litaker from Case Western Reserve University for his valuable comments during the preparation of this manuscript. We thank Professor Jos Bosch from University of Amsterdam and Jennifer Hilger from Mannheim Institute of Public Health for their intellectual support.
Competing interests
Prof. Dr. Joachim Fischer is the major shareholder of HealthVision Ltd, which organized the conduct of this study. The other authors declare that they have no competing interests.
References
1. Hilger J, Friedel A, Herr R, Rausch T, Roos F, Wahl DA. et al. A systematic review of vitamin D status in populations worldwide. Br. J. Nutr. 2013;9:1-23
2. Zittermann A. The estimated benefits of vitamin D for Germany. Mol Nutr Food Res. 2010;54:1164-71
3. Hintzpeter B, Mensink GBM, Thierfelder W, Muller MJ, Scheidt-Nave C. Vitamin D status and health correlates among German adults. Eur J Clin Nutr. 2008;62:1079-89
4. Anagnostis P, Athyros VG, Adamidou F, Florentin M, Karagiannis A. Vitamin D and cardiovascular disease: a novel agent for reducing cardiovascular risk? Curr Vasc Pharmacol. 2010;8:720-30
5. O'Hartaigh B, Neil Thomas G, Silbernagel G, Bosch JA, Pilz S, Loerbroks A. et al. Association of 25-hydroxyvitamin D with type 2 diabetes among patients undergoing coronary angiography: cross-sectional findings from the LUdwigshafen Risk and Cardiovascular Health (LURIC) Study. Clin Endocrinol. 2013;79:192-98
6. http://ec.europa.eu/food/fs/sc/scf/out157_en.pdf
7. Thomas GN, Scragg R, Jiang CQ, Chan W, Marz W, Pilz S. et al. Hyperglycaemia and vitamin D: a systematic overview. Curr Diabetes Rev. 2012;8:18-31
8. Ye Z, Sharp SJ, Burgess S, Scott RA, Imamura F, Langenberg C. et al. Association between circulating 25-hydroxyvitamin D and incident type 2 diabetes: a mendelian randomisation study. The Lancet Diabetes & Endocrinology. 2014;3:35-42
9. Wild S, Roglic G, Green A, Sicree R, King H. Global prevalence of diabetes: estimates for the year 2000 and projections for 2030. Diabetes Care. 2004;27:1047-53
10. Koopman RJ, Mainous AG, Diaz VA, Geesey ME. Changes in age at diagnosis of type 2 diabetes mellitus in the United States, 1988 to 2000. Ann Fam Med. 2005;3:60-63
11. Del Gobbo LC, Song Y, Dannenbaum DA, Dewailly E, Egeland GM. Serum 25-hydroxyvitamin D is not associated with insulin resistance or beta cell function in Canadian Cree. J. Nutr. 2011;141:290-95
12. Mattke S, Liu H, Caloyeras JP, Huang CY, van Busum KR, Khodyakov D. et al. Workplace wellness programs study: Final report; 2013.
13. American Diabetes Association. Standards of Medical Care in Diabetes-2011. Diabetes Care. 2010;34:11-61
14. Freund T, Lekutat C, Schwantes U, Szecsenyi J, Joos S. Gesundheitsuntersuchung und Impfstatus-Ergebnisse einer Patientenbefragung in deutschen Hausarztpraxen. Gesundheitswesen. 2010;72:804-07
15. Oberlinner C, Neumann SM, Ott MG, Zober A. Screening for pre-diabetes and diabetes in the workplace. Occup Med. 2008;58:41-45
16. Li J, Jarczok MN, Loerbroks A, Schöllgen I, Siegrist J, Bosch JA. et al. Work Stress is Associated with Diabetes and Prediabetes: Cross-Sectional Results from the MIPH Industrial Cohort Studies. Int J Behav Med. 2013;20:495-503
17. Whitworth JA. World Health Organization/International Society of Hypertension: statement on management of hypertension. J Hypertens. 2003;21:1983-92
18. American Diabetes Association. Diagnosis and Classification of Diabetes Mellitus. Diabetes Care. 2009;33:62-69
19. World Health Organization. Use of glycated haemoglobin (HbA1c) in the diagnosis of diabetes mellitus: Abbreviated report of a WHO consultation. Diabetes Research and Clinical Practice. 2011;93:299-309
20. Thuesen B, Husemoen L, Fenger M, Jakobsen J, Schwarz P, Toft U. et al. Determinants of vitamin D status in a general population of Danish adults. Bone. 2012;50:605-10
21. Muhairi SJ, Mehairi AE, Khouri AA, Naqbi MM, Maskari FA, Kaabi JA. et al. Vitamin D deficiency among healthy adolescents in Al Ain, United Arab Emirates. BMC Public Health. 2013;13:33
22. Narula R. Vitamin D Deficiency Among Postmenopausal Women with Osteoporosis. JCDR. 2013;7:336-38
23. Cutillas-Marco E, Fuertes-Prosper A, Grant WB, Morales-Suárez-Varela M. Vitamin D deficiency in South Europe: effect of smoking and aging. Photodermatol Photoimmunol Photomed. 2012;28:159-61
24. Grimnes G, Almaas B, Eggen AE, Emaus N, Figenschau Y, Hopstock LA. et al. Effect of smoking on the serum levels of 25-hydroxyvitamin D depends on the assay employed. Eur. J. Endocrinol. 2010;163:339-48
25. Ford ES, Zhao G, Tsai J, Li C. Associations between concentrations of vitamin D and concentrations of insulin, glucose, and HbA1c among adolescents in the United States. Diabetes Care. 2011;34:646-48
26. Husemoen LLN, Thuesen BH, Fenger M, Jørgensen T, Glümer C, Svensson J. et al. Serum 25(OH)D and type 2 diabetes association in a general population: a prospective study. Diabetes Care. 2012;35:1695-700
27. Pittas AG, Lau J, Hu FB, Dawson-Hughes B. The role of vitamin D and calcium in type 2 diabetes. A systematic review and meta-analysis. J. Clin. Endocrinol. Metab. 2007;92:2017-29
28. Rhee SY, Hwang Y, Chung HY, Woo J. Vitamin D and diabetes in Koreans: analyses based on the Fourth Korea National Health and Nutrition Examination Survey (KNHANES), 2008-2009. Diabet. Med. 2012;29:1003-10
29. Forouhi NG, Ye Z, Rickard AP, Khaw KT, Luben R, Langenberg C. et al. Circulating 25-hydroxyvitamin D concentration and the risk of type 2 diabetes: results from the European Prospective Investigation into Cancer (EPIC)-Norfolk cohort and updated meta-analysis of prospective studies. Diabetologia. 2012;55:2173-82
30. Song Y, Wang L, Pittas AG, Del Gobbo LC, Zhang C, Manson JE. et al. Blood 25-hydroxy vitamin D levels and incident type 2 diabetes: a meta-analysis of prospective studies. Diabetes Care. 2013;36:1422-28
31. Anderson JL, May HT, Horne BD, Bair TL, Hall NL, Carlquist JF. et al. Relation of vitamin D deficiency to cardiovascular risk factors, disease status, and incident events in a general healthcare population. Am J Cardiol. 2010;106:963-68
32. Schöttker B, Herder C, Rothenbacher D, Perna L, Müller H, Brenner H. Serum 25-hydroxyvitamin D levels and incident diabetes mellitus type 2: a competing risk analysis in a large population-based cohort of older adults. Eur J Epidemiol. 2013;28:267-75
33. Buijsse B, Boeing H, Hirche F, Weikert C, Schulze MB, Gottschald M. et al. Plasma 25-hydroxyvitamin D and its genetic determinants in relation to incident type 2 diabetes: a prospective case-cohort study. Eur J Epidemiol. 2013;28:743-52
34. Schafer AL, Napoli N, Lui L, Schwartz AV, Black DM. Serum 25-hydroxyvitamin D concentration does not independently predict incident diabetes in older women. Diabet Med. 2014;31:564-69
35. Seida JC, Mitri J, Colmers IN, Majumdar SR, Davidson MB, Edwards AL. et al. Clinical review: Effect of vitamin D3 supplementation on improving glucose homeostasis and preventing diabetes: a systematic review and meta-analysis. J. Clin. Endocrinol. Metab. 2014;99:3551-60
36. Holick MF, Binkley NC, Bischoff-Ferrari HA, Gordon CM, Hanley DA, Heaney RP. et al. Evaluation, treatment, and prevention of vitamin D deficiency: an Endocrine Society clinical practice guideline. J Clin Endocrinol Metab. 2011;96:1911-30
Author contact
![]() Corresponding author: Daniel Mauss, Mannheim Institute of Public Health, Social and Preventive Medicine, Medical Faculty Mannheim, Heidelberg University, Ludolf-Krehl-Str. 7-11, D-68167 Mannheim, Germany. E-mail: dmousetrapcom, phone: +49 8192 998953
Corresponding author: Daniel Mauss, Mannheim Institute of Public Health, Social and Preventive Medicine, Medical Faculty Mannheim, Heidelberg University, Ludolf-Krehl-Str. 7-11, D-68167 Mannheim, Germany. E-mail: dmousetrapcom, phone: +49 8192 998953