Impact Factor ISSN: 1449-1907
- Issue 9; 2026
- Issue 8; 2026
- Issue 7; 2026
- Issue 6; 2026
- Issue 5; 2026
- Volume 23; 2026
- Past Issues
- Editorial Board
- Cover Images
- Index & Coverage
- Cover Suggestion
- Special Issues
Introduction
Materials and Methods
Results
Discussion
Supplementary Material
Acknowledgements
References

 Global reach, higher impact
Int J Med Sci 2015; 12(1):7-16. doi:10.7150/ijms.8352 This issue Cite
Research Paper
The Expression Levels of Transcription Factors T-bet, GATA-3, RORγt and FOXP3 in Peripheral Blood Lymphocyte (PBL) of Patients with Liver Cancer and their Significance
Ze-Wei Lin1, Li-Xuan Wu2, Yong Xie1, Xi Ou1, Pei-Kai Tian1, Xiao-Ping Liu1 ![]() , Jun Min3, Jie Wang3, Ru-Fu Chen3, Ya-Jing Chen3, Chao Liu3, Hua Ye3, Qing-Jia Ou3
, Jun Min3, Jie Wang3, Ru-Fu Chen3, Ya-Jing Chen3, Chao Liu3, Hua Ye3, Qing-Jia Ou3
1. Department of HepatobiliaryLaparoscope-Surgery, Peking University Shenzhen Hospital, Shenzhen, Guangdong, 518036, China;
2. Department of Hepatobiliary Surgery, The Central People Hospital of Huizhou City, Huizhou, Guangdong, China 516001;
3. Department of Hepatobiliary Surgery of Sun Yat-Sen Memorial Hospital Sun Yat-Sen University, Guangzhou, Guangdong, 510120, China.
Received 2013-11-2; Accepted 2014-10-24; Published 2015-1-1
Abstract
Objectives: To investigate the expression of transcriptional factors (TFs) T-bet, GATA-3, RORγt and FOXP in peripheral blood mononuclear cells (PBMC) of patients with hepatocellular carcinoma (HCC) and to evaluate the correlation between the imbalances of Th1/Th2, Th17/Treg at the expression levels and liver cancer
Methods: The peripheral venous blood was drawn from 20 HCC-patients (HCC-group) and 20 health participants (C-group). The expression levels of Th1, Th2 and Th17 and the major Treg-specific TFs T-bet, GATA-3, RORγt and FOXP3 in the PBMC were measured with quantitative real-time PCR(RT-qPCR).
Results: The mRNA level of Th1-specific TF T-bet in HCC-group was significantly lower than that of C-group (52.34±34.07 VS 104.01±56.00, P<0.01); the mRNA level of Th2-specifc TF, GATA-3, in HCC group was significantly higher than that in C-group (1.38±1.15 VS 0.58±0.65, P<0.05) and T-bet mRNA/GATA-3 mRNA ratio was significantly lower in HCC-group than in C-group (86.01±116.71 VS 461.88±708.81, P<0.05). The mRNA level of Th17-specific TF RORγt in HCC-group was significantly higher than that of C-group (72.32±32.82 VS 33.07±22.86, P<0.01). Treg-specific TF FOXP3 mRNA level was significant higher in HCC-group than in C-group (3.17±1.59 VS 1.39±1.13, P<0.01)
Conclusion: T-bet mRNA level was reduced whereas GATA-3 mRNA level was increased and T-bet/GATA-3 ratio was significantly reduced in PBMC, indicating that Th1/Th2 ratio was of imbalance at TF levels in PBMC of HCC, displaying Th2 thrift phenomena. The mRNA levels of RORγt and FOXP3 in PBMC of HCC were significantly increased, indicating the existence of a predominant phenomenon of Th17- and Treg-expressing PBMC in HCC.
Keywords: RORγt, Th1, Th2, Th17, Treg, Hepatocellular carcinoma (HCC).
Introduction
Hepatocellular carcinoma (HCC) is one of the most common tumors in the world and the third most frequent cause of cancer deaths. The risk of HCC has been estimated to be 100 times greater in persons who have a history of hepatitis B virus (HBV) infection [1]. HCC is more prevalent in Asian and African countries due to the high frequent HBV infection. In China, HCC is the second most common malignancy, causing approximately 350,000 deaths a year [2]. The current treatment options for advanced HCC are limited and effective approaches for treatment of HCC are needed, A clinical study of dendritic cell (DC)-based immunotherapy for HCC reported that the HCC patients treated with pulsed and boosted therapy had better 1-year survival rates than those treated by pulsed therapy alone, suggesting that DC vaccination and immunotherapy could be a safe treatment for HCC [3]. However, further studies to understand the immunoregulatory system in patients with HCC are needed for improving the efficacy of immunotherapeutic approach.
During recent years, rapid progresses have been made in our understanding on the CD4+-T cells. The classical classification of the accessory T-cells (helper T cells or Th) into Th1 and Th2 has been replaced by the classification of Th cells into Th1, Th2, and Th17 cells, which combine with the regulatory T cells (Treg) to form a regulatory network of CD4+T effector cells. It has been known that differentiation and function of each T cell subset are controlled by a specific master transcription factors including runt-related transcription factors such as Runx1 and Runx3, which directly interplay with T-box expressed in T cells (T-bet) and GATA3 during Th1 versus Th2 commitment to activate or silence transcription of signature cytokine genes, IFNγ and IL4 [4]. The mainstream of the current point of view is that within this regulatory network, Th1, Th2 and Th17 cells are mainly responsible for cellular immunity, body liquid immunity, inflammatory and autoimmunity, respectively, and their corresponding specific transcriptional factors (TFs) are T-bet, GATA-3 and retinoic acid-related orphan receptor gamma or ROR gamma t (RORγt). The Treg cells play an important role in immune-tolerance and autoimmune stability and its specific TF is Forkhead/winged helix transcription factor (FOXP3). It has been illustrated that the balance or imbalance between Th1/Th2 and Th17/Treg plays an important role in a number of physiological and pathological states [5, 6] [1, 2], measurement of the ratio of their corresponding TFs, i.e. T-bet/GATA-3 will more objectively reflect Th1/Th2 differentiation than just simply the measurement of the single type of Th1-type or Th2-tyope cellular factors alone [7] [3]. Thus, it is more significant to investigate the balance of Th1/Th2 and Th17/Treg at their TF level. In this study, we applied fluorescent quantitative real-time PCR (RT-qPCR) to investigate the mRNA expression levels of Th1-, Th2-, Th17- and Treg-specific TFs, T-bet, GATA-3, RORγt and FOXP3, respectively, in the peripheral blood mononuclear cells (PBMC) of 20 patients with primary liver cancer and twenty health participants, aiming at elucidating the relationship between the imbalance of Th1/Th2 and Th17/Treg and liver cancer.
Materials and Methods
Clinical Information
The specimens of twenty cases of patients with primary liver cancer were derived from the first diagnostic and surgical operation-treated patients admitted to Department of Hepatobiliary Surgery, Sun Yat-Sen Memorial Hospital of Sun Yat-Sen (Zhongshan) University. They were all the patients with pathologically confirmed early stage primary hepatocellular carcinoma (HCC) without inter-and intra-hepatic metastasis. They were given no any treatments including transcatherter arterial chemoembolization (TACE) before surgical operation. Twenty cases in the control group were all the health participants who had no autoimmune diseases such as diabetes, hyperthyroidism and the history of immunotherapy. Among twenty patients with HCC, 19 had the background of B-type hepatitis and only one patient did not have the background of B-type hepatitis.
Ethic and Sampling
The research protocols were approved by the Ethics Committee of Peking University Shenzhen Hospital and all the participants signed Informed consent. All the venous blood specimens were collected via a portable vacuum blood collection tube. EDTA was used as the anticoagulant and the measurements were finished within 4 hours.
Measurement of mRNA levels of T-bet, GATA-3, RORγt and FOXP3 via RT-PCR
Equipment and Reagents
ABI7500 auto fluorescent quantitative PCR machine, ABI9700 PCR machine and ABI3900 high throughput DNA Synthesizer were purchased from Applied Biosystems Inc. (Norwalk, CT, USA). MILLI-Q Ultrapure water system was purchased from MILLIPORE (Bedford, MA, USA). ELITE 200 electrophoresis apparatus and Dolphin-DO gel imaging system were obtained from WEALTEC (Sparks, NV, USA). UV1101 ultraviolet spectrophotometer was purchased from Biotech Photometer (Stoke on Trent, England). RCO3000T-5-VBC CO2 cell culture incubator was obtained from KENDRO (Newtown, CT, USA). CK40-32PH inversion microscope was obtained from OLYMPUS (Tokyo, Japan). FM70 ice maker was purchased from GRANT (USA). BT25S quasi-micro analytical balance was obtained from Sartorius (Germany). AG135 analytic balance was purchased from METTLER TOLEDO (Swiss). Trizol RNA isolation kit was obtained from TaKaRa (Daliang, China). Diethylpyrocarbonate (DEPC) and agarose were obtained from INALCO (San Luis Obispo, CA, USA). Reverse transcription buffer (5x), PCR buffer, Taq enzyme and SYBR Green (5x) were purchased from Dana Gene (Guangzhou, China). Human lymphocyte separation tubes were obtained from Dakewe Biotech Company (Shenzhen, China). RPMI1640 cell culture medium was obtained from GIBCO (Grand Island, NY, USA).
Design and Synthesis of PCR primers
Based on mRNA sequences of the targeted genes, T-bet, GATA-3, RORγt and FOXP3, in GenBank, the primers for these genes were designed with Primer express 2.0 software. These primers were synthesized with ABI3900 high through put DNA Synthesizer. The up-stream primer for T-bet was 5'-CGG CTG CAT ATC GTT GAG GT-3' and the down-stream primer was 5'-GTC CCC ATT GGC ATT CCT C-3' with the amplicon size of 107 bp. The up-stream primer for GATA-3 was 5'-TCA TTA AGC CCA AGC GAA GG-3' and its down-stream primer was 5'-GTC CCC ATT GGC ATT CCT C-3' with the amplicon size of 107 bp; The up-stream primer for RORγt was 5-GCA GCG CTC CAA CAT CTT CT-3', and the down-stream primer was 5'-ACG TAC TGA ATG GCC TCG GT-3' with the amplican size of 111bp. The up-stream primer for FOXP3 was 5'-CAC CTG GCT GGG AAA ATG G-3' and its down-stream primer was 5'-GGA GCC CTT GTC GGA TGA-3' with the amplicon size of 63 bp. β-actin was used as the internal control. The up-stream primer for β-actin was 5'-GCA TGG GTC AGA AGG ATT CCT-3' and the down-stream primer was 5'-TCG TCC CAG TTG GTG ACG AT-3' with the amplicon size of 106 bp.
Isolation of Total RNA from the Cells and RT-PCR
Lymphocytes were isolated from peripheral venous blood by using lymphocyte separation tube containing lymphocyte separation liquid. Lymphocytes were adjusted to >1-5×10⁶/ml and incubated at 37oC in 5% CO2 incubator for 4-8 h and allowed the attachment of cells to the walls. The attached and the floated lymphocytes were separated. The floated lymphocytes were collected by centrifuge at 12000 rpm for 15 min. The pellet cells were lysed with Trizol solution. Total RNA was isolated from lymphocytes according to the instructions. Four (4) μl of template RNA was used for reverse transcription reaction with ABI 9700 under the conditions of 37℃ for 1h and then at 95℃for 3min. Five (5) μl of reverse transcribed cDNA template was used for PCR reaction with ABI 7500 auto fluorescent quantitative PCR machine. The positive standard DNA sample and the concentration gradient of the standard DNA samples were prepared. The sterile double distilled water was used as the negative control. The PCR conditions were set as follows: DNA samples were denatured at 93℃ for 3 min, followed by 40 cycles of 93℃, 30s, 55℃, 45s, and 72℃, 45s. After PCR reaction completed, the data were automatically analyzed by the computer software and the copy number of the targeted genes and internal control genes in the samples were calculated. Considering the variations of the total RNA concentrations of different samples, the final calculated results were converted with the following equation: C=A/B, where C was the statistically significant value, A refers to the copy numbers of gene in samples and B refers to the copy numbers of β-actin (The β-actin was used as the internal control).
Statistical methods
SPSS13.0 software was used for statistical analysis of the experimental data and the results of each group were expressed as mean±SD. The differences of the mean values between groups were tested by t-test. When P value was <0.05, the difference between groups was regarded as statistically significant.
Results
Measurement of the mRNA levels of T-bet mRNA and GATA-3 via RT-qPCR
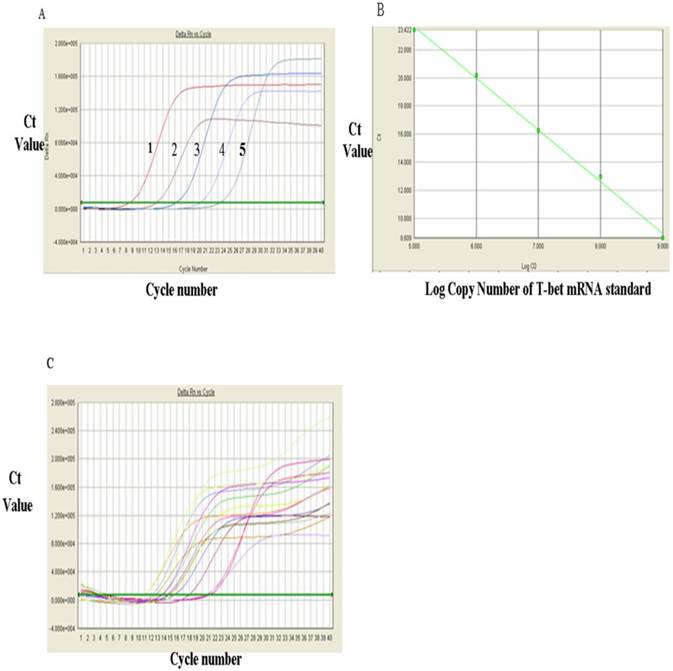
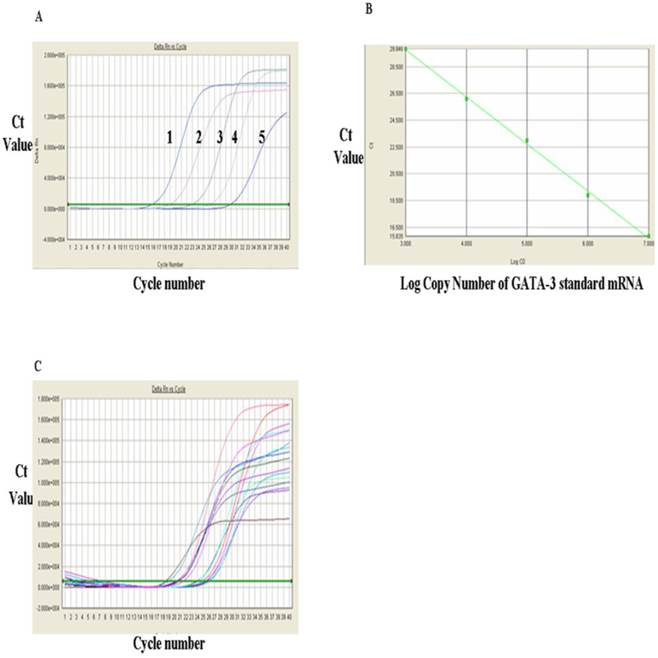
The levels of T-bet mRNA were measured via RT-qPCR and the results were shown in Figure 1. Figure 1A showed the RT-qPCR amplification plot and standard curves of the positive standards of T-bet mRNA and GATA-3 mRNA, respectively. In Figure 1A, each curve represented one concentration of positive standard copy number, from left to right, five values for T-bet mRNA standards were: 1 x 10⁹, 108, 107, 106, and 105 respectively, and the Ct value of amplification plot. The standard curvilinear regression curves were drawn by computer and shown in Fig. 1B. The Y-axis was Ct value and the X-axis was the log value of copy numbers of PCR product. Figure 1B indicated that the log value of the copy numbers of TF T-bet mRNA. Figure 1C was the amplification plots for T-bet mRNA. Each curve represented the experimental results of each sample. The Ct value for each sample was obtained from Figure 1C. After substitution of each Ct value into the standard linear regression curves, the copy numbers of T-bet mRNA in the samples were obtained. Similarly, the levels of GATA-3 mRNA were detected via RT-qPCR and the results were shown in Fig. 2. Fig. 2A showed the RT-qPCR amplification plot with mRNA standards of 1x 10⁷, 106, 105, 104, and 103, respectively. The standard curves and amplification plots of GATA-3 mRNA samples were shown in Fig. 2B and 2C, respectively.
Analysis of T-bet mRNA expression with RT-qPCR. A, RT-qPCR amplification curves of T-bet mRNA standards: 1. 109, 2, 108, 3.107, 4.106 and 5, 106. B, The RT-qPCR linear regression curve with T-bet mRNA standards. C, The RT-qPCR amplification plots of T-bet mRNA sample.
Analysis of GAGA mRNA expression with RT-qPCR. A, FQ-PCR amplification curves of T-bet mRNA standards. 1, 1x10⁷, 2, 106, 3, 105, 4, 104, and 5, 103. B, The RT-qPCR linear regression curve with GATA-3 mRNA standards. C, The RT-qPCR amplification plots of GATA-3 mRNA sample.
The results for these two genes were presented in Tables 1, which showed that the level of T-bet mRNA in PBMC of HCC group was significantly lower than that in the control group (52.34±34.07 VS 104.01±56.00, P<0.01) whereas the data presented in Table 1 indicated that the level of GATA-3 mRNA in PBMC of HCC group (1.38±1.15) was significantly higher than that in control group (0.58±0.65)(P<0.05). Table 1 showed that the ratio of T-bet mRNA/GATA-3 mRNA in PBMC of HCC group was significantly lower than that in control group (86.01±116.71 VS 461.88±708.81, P<0.05), indicating a phenomenon of Th2-thrift.
mRNA Expression levels of T-bet, GATA-3, the ratio of T-bet mRNA/GATA-3 mRNA, the mRNE expression levels of RORγt and FOXP3 in PBMC of HCC group and normal control group.
| Group | HCC group | Control group |
|---|---|---|
| N | 20 | 20 |
| T-bet mRNA (% ±SD) | 52.34±34.07* | 104.01±56.00 |
| GATA-3 mRNA (% ± SD) | 1.38±1.15** | 0.58±0.65 |
| T-bet mRNA/GATA-3 mRNA (% ± SD) | 86.01±116.71** | 461.88±708.81 |
| ROR t mRNA (%±SD) | 72.32±32.82* | 33.07±22.86 |
| FOXP3 mRNA (% ± SD) | 3.17±1.59* | 1.39±1.13 |
Note: Compared to that of control group, *P<0.01.
Note: Compared to normal control group, **P<0.05.
Measurement of RORγt mRNA expression by RT-PCR
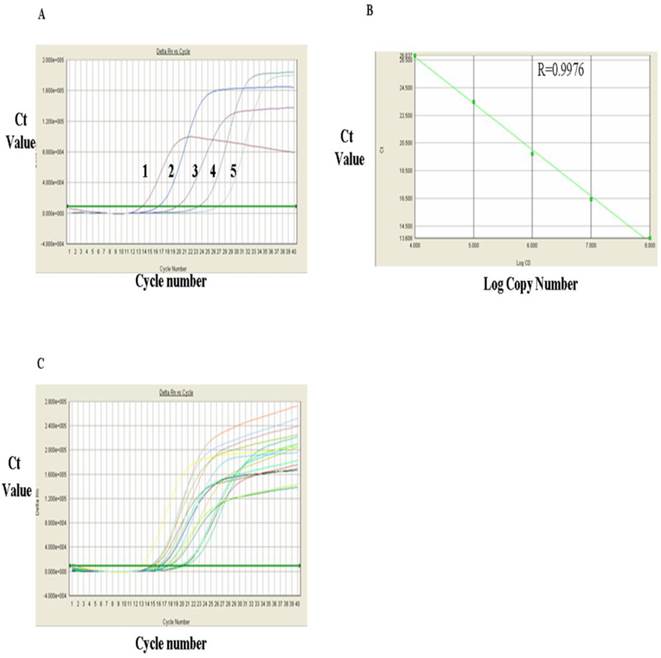
The levels of RORγt mRNA in HCC group and control group were measured with RT-qPCR. Figure 3A showed RT-qPCR amplification plots of the positive RORγt mRNA standard sample. Each curve represented copy number of one concentration of the standard sample from the range of 108, 107, 106, 105 and 104 (from left to right, respectively). The standard linear regression curves (Fig. 3B) indicated a very good correlation between the log value of the copy numbers of RORγt mRNA and the Ct value of the PCR reaction with a correlation coefficient (R) of 0.9976, indicating that the quantitative results are accurate and reliable. Fig. 3C showed the amplification plots of RORγt mRNA samples and each curve represented the experimental result of each sample. Substitution of the Ct values of these sample from Fig. 3C into the standard linear regression curves, the mRNA copy numbers of the samples were obtained and presented in Table 1, which indicated that the expression level of RORγt mRNA was significantly higher in PMBC of primary HCC group than in PMBC of the normal control group (72.32±32.82 VS 33.07±22.86) (P<0.01).
Analysis of RORγt mRNA expression with RT-qPCR. A, FQ-PCR amplification plots of RORγt mRNA standards: 1. 108, 2. 107, 3. 106, 4. 105 and 5, 104. B, FQ-PCR linear regression curves of RORγt mRNA RT-qPCR standards. C, FQ-PCR amplification plots of RORγt mRNA in samples.
Measurement of FOXP3 mRNA via RT-PCR
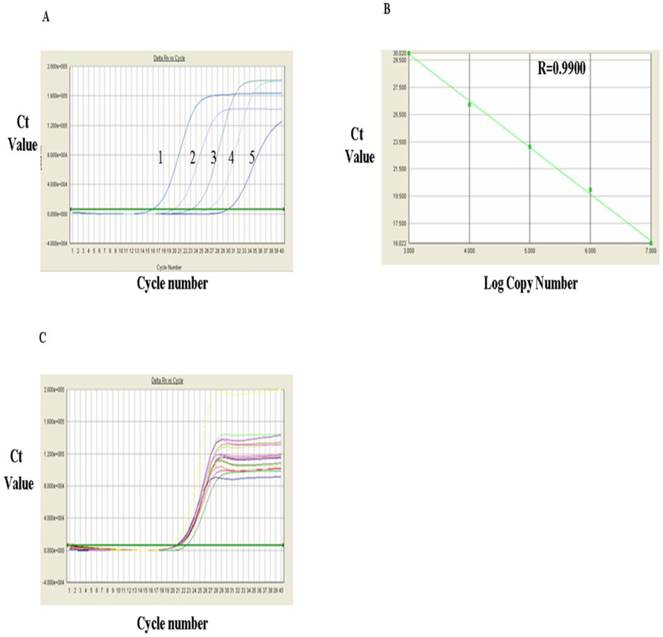
The FOXP3 mRNA levels measured via RT-PCR were shown in Fig. 4 and Table 1. Fig. 4A showed RT-qPCR amplification plots of FOXP3 mRNA positive standards in the range from 1x 10⁷, 106, 105, 104 and 103 (from left to right, respectively). Based on the known copy numbers of the positive standard and the Ct values obtained from the amplification plot, the linear regression curves were drawn by computer and shown in Fig. 4B, which indicated a very good correlation between the copy number of FOXP3 mRNA and the Ct values with a correlation coefficient (R) of 0.9900. Fig.4C showed the amplification plots of FOXP3 mRNA samples. Each curve represented the experimental result of one sample. The Ct value for each sample was obtained from Fig. 4C. After substitution of the Ct value of each sample into the linear regression curve, the copy number for each sample was obtained and presented in Table 1, which indicated that the level of FOXP3 mRNA in PBMC of the HCC group was significantly higher than that of control group (3.17±1.59 VS 1.39±1.13)(P<0.01).
Analysis of FOXP3 mRNA expression with RT-qPCR. A, FQ-PCR amplification plots of the FOXP3 mRNA standards 1. 107, 2, 106, 3.105, 4. 104 and 103. B, FQ-PCR linear regression curve of FOXP3 mRNA standards. C, Amplification plots of FOXP3 mRNA FQ-PCR samples.
RT-qPCR for the internal control gene, β-actin (Note: this section was used as the sulpelmentary materials)
The β-actin was used as the internal control and its mRNA levels were measured by RT-qPCR. The results were shown in Supplementary Material: Fig. S1. The figure showed the amplification plots, the linear regression curves of β-actin standard and the RT-qPCR amplification plots of β-actin in samples, respectively.
Discussion
In this study, we made two novel and important observations. The first one is that the mRNA level of Th1-specific TF, T-bet, was reduced whereas mRNA level of Th2-specific GATA-3 was increased and thus, T-bet/GATA-3 ratio was significantly reduced in PBMC. These results indicate the imbalance of Th1/Th2 ratio at TF levels in PBMC of HCC, displaying a Th2-thrift phenomenon. The second one is that mRNA levels of Th17-specific TF, RORγt, and the Treg-specific TF, FOXP3, were significantly increased in PBMC of patient with HCC, indicating the existence of a phenomenon of predominant Th17- and Treg-expressing PBMC in HCC.
Maintaining the balanced immunity in the ratios of Th1/Th2 and Th17/Treg is very important for maintaining the normal immunological functions within the body. Once the differentiation of Th1/Th2 and Th17/Treg cells is of imbalance, a number of diseases such as cancer, autoimmune diseases, allergic diseases, and endocrine diseases, infectious diseases and resistant responses to organ implantation may occur [8-11]. Under the normal situation, Th1, Th2, and Th17 cells cooperate with Treg cells. Together, they form a regulatory network for the CD4+T effector cells [12]. When the naïve CD4+T cells are stimulated by the external antigens, they proliferate and differentiate into a variety of CD4+ effector T cells under the actions of different cytokines. Interleukin-12 (IL-12) and interferon-γ (IFN-γ) induce the differentiation of the naive CD4+T cells to Th1 cells. Binding of IL-12, a key cytokine that determines the differentiation of CD4+ T into Th1 cells, to its receptor, IL-12R, induces and activates signal transducer and activator of transcription protein 4 (STAT4), which up-regulates IFN-γ, which, in turn, activates STAT1 and Th1-differentiation-specific TF, T-bet [13]. Th1 cells produce IFN-γ, which mediates the cellular immunity and resistance to the implantation substances and plays important roles in anti-infection and anti-tumors. On the other hand, IL4 induces differentiation of the activated CD4+T cells into Th2 cells. Binding of IL-4 to its receptor, IL-4R, activates STAT6, which, in turn, activates Th2-specific TF, GATA-3[14,15]. Th2 cells secret IL-4, IL-5 and IL-13, which mediate the liquid immunity and hypersensitive responses and are involved in the pathogenesis of the systemic autoimmune diseases. At the absence of IL-6, upon the induction of TGF-β alone, the naïve CD4+T cells up-regulate FOXP3 expression and differentiate into Treg cells, which play an important role in maintaining the immune tolerance and immune balance. The cooperation of both TGF-β and IL-6 activates RORγt via STAT3 pathway and induces the differentiation of the naïve CD4+T cells into Th17 cells, which mainly secrete IL-17 and mediate inflammatory immunity response [16]. When IL-6 is absent, the naive CD4+T cells can also differentiate into Th17 via the synergistic pathways of both TGF-β and IL-21. In this case, IL-21 acts as IL-6 [17].
Cytokines, together with the cellular signal transduction pathways and the nuclear TFs, form a complex network, which regulates the polarization balance. The abnormality of any link within this network will influence its regulatory functions and lead to the polarization imbalance of Th1/Th2 and Th17/Treg. Usually, Th1/Th2 and Th17/Treg antagonize each other functionally. They have close relations in regulation of differentiation and maturity of CD4+ T cells. Under certain conditions, these subsets can even interconvert. TGF-β acts as the initiating factor triggering the differentiation of Thl7 cells. IL-6 cooperates with TGF-β to stimulate the differentiation of Thl7 cells whereas in the absence of IL-6 but the presence of TGF-β alone, the differentiation of Thl7 cells is significantly inhibited but the development of Treg is significantly promoted. For instance, in the bone marrow tissues of the patients with myeloma, the tumor-infiltrated dendritic cells (DCs) can be induced to produce a large amount of IL-17 and IFN-γ. In the patients with HCC, in addition to IL-17 expression, a small amount of IFN-γ is also produced. It has been indicated that under certain conditions, Thl7 cells can be converted into IFN-γ-secreting Th1 cells and thus, play an anti-cancer role [18, 19]. The TFs themselves can mutually regulate each other. For instance, GATA-3 and STAT-6 can inhibit T-bet production whereas T-bet can directly inhibit GATA-3 production [20]. RORγt and Foxp3 can also interact mutually and inhibit their transcriptional activity [21].
The importance of the imbalance of Th1/Th2 and Th17/Treg in tumor immunology and tumor micro-environment has been increasingly recognized. Many studies have found the Th1/Th2 immune imbalance in patients with cancers. The Th1-type cytokines, such as IFN-γ, were significantly reduced whereas the Th2-type cytokines such as IL-4 and IL-10 were significantly increased. As early as 1993, Yamamura et al. [22] observed that Th2-type cytokines were predominantly expressed in patients with malignant skin cancers whereas the Th1-type cytokines were predominantly expressed in patients with benign skin cancers. Since then, the thrift of Th2-type cytokines has been observed in many malignant tumors including non-small lung cancer, choriocarcinoma, and glioma [23, 24]. Budhu et al. [25] found that the ratio of Th1/Th2 was of imbalance in peripheral blood cells of patents with liver cancer which displayed a predominant expression of Th2-type cytokines and that there was an increasing trend with the increases in clinical stages and exacerbation of the disease, indicating that the expression of Th2-type cytokines is related to the pathogenic progression of primary HCC. The dominant expression of TF GATA-3 also occurred in breast and pancreatic cancers [26, 27]. Consistent with these observations, the present study revealed that the expression of T-bet was reduced whereas the expression of GATA-3 was increased and the ration of T-bet/GATA-3 was significantly reduced, and that the GATA-3 was predominantly expressed in PMBC of patients with primary HCC, displaying a Th2-drift at transcriptional level. Our observations and those described above indicate that Th2 drift is one of the common mechanisms for immune escape of cancer cells and is closely related to initiation, development, metastasis and re-occurrence of cancers. Cancer is regarded as the Th2-drift disease. Thus, correcting the imbalance of Th1/Th2 could be an important way for cancer immunotherapy
Our second observation that the expression of FOXP3 is significantly increased in PBMC of patients with HCC demonstrates that high expression of FOXP3 may be one of the mechanisms responsible for Treg cell predominance, which is also closely related to the occurrence, development and prognosis of cancers. The existence of this phenomenon has been increasingly supported by several lines of evidence. For instance, Currie at el. [28] found that the cancer tissues contained very high levels of Treg cells and that their levels were negatively correlated to the degree of cancer progression and prognosis. Ladoire et al. [29] measured Treg cells in 56 patients with breast cancer before adjuvant chemotherapy and found that only those patients who had low level of FOXP3+T and high level of CD8+T cells before chemotherapy had good responses to adjuvant chemotherapy and a better prognosis. The in vitro experiments have demonstrated that in the co-culture of peripheral lymphocytes and liver cancer cells, the proportion of Treg cells was increased. Cancer cells could also directly induce the formation of Treg cells and myeloid suppressor cells (MSCs). Both Treg cells and MSCs can stimulate the metastasis of cancer cells [30, 31]. Gao et al. [32] conducted an immunohistochemical analysis on the operationally removed liver tissues of 302 patients with primary HCC and the related prognosis and survival. They found that the balance of the ratio of Treg cells/the cytotoxic T-cells within the cancer tissues was an important indicator for whether the prognosis could be of re-occurrence. They proposed that a combined immunotherapy of post-operational treatment to remove Treg cells with a simultaneous stimulation of the proliferation of effector T cells may be beneficial for reducting the cancer re-occurrence and increasing the survival rate. It is believed that the suppressive immune regulatory Treg cells are the important negative regulatory components within the tumor microenvironment where they are involved in the formation of tumor immune tolerance.
Treg cell predominance is another important mechanism for immune escape of tumor cells and correlated with the occurrence, development, metastasis, re-occurrence, treatment and lapse of cancers. Thus, correcting the Treg cell predominance is the new target for the immunotherapy [33]. Currently, serevral major approaches have been used for depletion or reversion of Treg inhibition, including: 1) use of FOXP3 vaccine to activate FOXP3-specific CTL for depletion of Treg cells [34]; 2) use of specific anti-GITR antibody to deplete TreG cells [35]; 3) targeting IL-2 receptor fusion protein Ontak (denileukindiftitox)[36]; 4) use of anti-CTLA-4 monoclonal antibody to reduce the inhibition of Treg cells on CLT [37] and 5) immunotoxic depletion of Treg cells [38].
Thl7 cells have been found in many types of cancers including ovarian cancer, colorectal, melanoma, cervical, kidney, prostates, breast, gastric and pancreatic cancers. Zhang et al. [39] found the increased number of Thl7 cells in peripheral bloods of patients with gastric cancer and the presence of Th17 cells in the tumor-infiltrated lymph nodes in patients with gastric cancer at late stage and the significantly increased mRNA levels of Th17 cell-related factors (IL-17 and IL-23p19). They also observed that the levels of IL-17 and IL-23 in the tumor tissues of patients with gastric cancer at late stage were significantly increased. The tumor tissues, lymph nodes, peripheral bloods of patients with liver cancer contained more Th17 cells and their prognosis was poorer [19]. The significantly increased expression level of RORγt mRNA in PBMC of patients with primary HCC observed in this study clearly indicats the existence of predominance of Th17 cells in primary HCC at transcriptional level. However, whether Th17 cells stimulate or inhibit tumor growth in tumor immunity and tumor microenvironment is still in dispute though there are the data indicating that Th17 cells display dual roles. The stimulatory effects of Th17 cells on tumor mainly depend on the angiogenesis characteristics of peripheral endothelial cells and fibroblasts and stimulate the tumor angiogenesis. Kato et al. [40] firstly confirmed that IL-17 is an angiogenesis factor and can stimulate tumor growth. Numasaki et al. [41] found that IL-17-induced growth of non-small lung cancer cells was related to tumor angiogenesis and that IL-17 can selectively stimulate the angiogenesis factors including VEGF, PGE2, MIP-2, CXCL1, CXCL5, CXCL6 and CXCL8. The anti-cancer effects of Thl7 cells are mediated via secretion of specific cytokines and mediation of autoimmune reactions, chemotaxic effector cells and stimulation of tumor specific CTL, but they themselves do not directly display cancer-killing effects because they lack the expression of several related cytotoxic molecules such as granzyme, perforin, FasL and etc. [41]. Other researchers believed that Th17 cells just simply acted as by-stander [42]. Thus, the precise roles of Th17 cells in the occurrence and development of tumor require to be defined through further investigation.
In summary, in this study, we investigated the expression of TFs, T-bet, GATA-3, RORγt and FOXP in PBMC of patients with HCC and evaluated the correlation between the imbalances of Th1/Th2, Th17/Treg at the TF levels and liver cancer. We observed that T-bet mRNA level was reduced whereas GATA-3 mRNA level was increased and thus, T-bet/GATA-3 ratio was significantly reduced in PBMC. These results indicate an imbalance of Th1/Th2 ratio at TF levels in PBMC of HCC and a Th2-thrift phenomenon. We observed that the mRNA levels of RORγt and FOXP3 in PBMC of HCC were significantly increased. These results indicate the existence of a predominant Th17- and Treg-expressing PBMC in HCC. The precise roles of Th17 cells in the occurrence and development of HCC merit further investigation.
Supplementary Material
Figure S1.
Acknowledgements
This study was supported by Shenzhen Municipal Science and Technology Planning Projects (JC200903180670A, 201103023).
Competing Interests
The authors have declared that no competing interest exists.
References
1. Bosch FX, Ribes J, Díaz M, Cléries R. Primary liver cancer: worldwide incidence and trends. Gastroenterology. 2004;127(5 Suppl 1):S5-S16
2. Chen JG, Zhang SW. Liver cancer epidemic in China: past, present and future. Semin Cancer Biol. 2011;21(1):59-69
3. Lee WC, Wang HC, Hung CF, Huang PF, Lia CR, Chen MF. Vaccination of advanced hepatocellular carcinoma patients with tumor lysate-pulsed dendritic cells: a clinical trial. J Immunother. 2005;28(5):496-504
4. Wong WF, Kohu K, Chiba T, Sato T, Satake M. Interplay of transcription factors in T-cell differentiation and function: the role of Runx. Immunology. 2011;132(2):157-164
5. Saito S, Nakashima A, Shima T, Ito M. Th1/Th2/Th17 and regulatory T-cell paradigm in pregnancy. Am J Reprod Immunol. 2010;63(6):601-610
6. Kanwar B, Favre D, McCune JM. Th17 and regulatory T cells: implications for AIDS pathogenesis. Curr Opin HIV AIDS. 2010;5(2):151-157
7. Chakir H, Wang H, Lefebvre DE, Webb J, Scott FW. T-bet/GATA-3 ratio as a measure of the Th1/Th2 cytokine profile in mixed cell populations: predominant role of GATA-3. Immunol Methods. 2003;278(1-2):157-169
8. Dong C. TH17 cells in development: an updated view of their molecular identity and genetic programming. Nat Rev Immunol. 2008;8(5):337-348
9. O'Garra A. Murphy KM. From IL-10 to IL-12: how pathogens and their products stimulate APCs to induce T(H)1 development. Nat Immunol. 2009;10(9):929-932
10. Chapoval S, Dasgupta P, Dorsey NJ, Keegan AD. Regulation of the T helper cell type 2 (Th2)/T regulatory cell (Treg) balance by IL-4 and STAT6. J Leukoc Biol. 2010;87(6):1011-1018
11. Yagi R, Zhu J, Paul WE. An updated view on transcription factor GATA3-mediated regulation of Th1 and Th2 cell differentiation. Int Immunol. 2011;23(7):415-420
12. Li MO, Flavell RA. TGF-â: a master of all T cell trades. Cell. 2008;134(3):392-404
13. Monteleone G, Pallone F, MacDonald TT. Interleukiin-21: a critical regulator of the balance between effector and regulatory T-cell responses. Trends Immunol. 2008;29(6):90-294
14. Cui G, Florholmen J. Polarization of cytokine profile from Th1 into Th2 along colorectal adenoma-carcinoma sequence: implications for the biotherapeutic target? Inflamm Allergy Drug Targets. 2008;7(2):94-97
15. De Mello LM, Bechara MI, Solé D, Rodrigues V. TH1/TH2 balance in concomitant immediate and delayed-type hypersensitivity diseases. Immunol Lett. 2009;124(2):88-94
16. Wilke CM, Bishop K, Fox D, Zou W. Deciphering the role of Th17 cells in human disease. Trends Immunol. 2011;32(12):603-611
17. Loser K, Beissert S. Regulatory T cells: banned cells for decades. J Invest Dermatol. 2012;132(3 Pt 2):864-871
18. Dhodapkar KM, Barbuto S, Matthews P. et al. Dendritic cells mediate the induction of polyfunctional human IL17-producing cells (Th17-1 cells) enriched in the bone marrow of patients with myeloma. Blood. 2008;112(7):2878-2885
19. Zhang JP, Yan J, Xu J. et al. Increased intratumoral IL-17-producing cells correlate with poor survival in hepatocellular carcinoma patients. Hepatol. 2009;50(5):980-989
20. Usui T, Preiss JC, Kanno Y. et al. T-bet regulates Th1 responses through essential effects on GATA-3 function rather than on IFNG gene acetylation and transcription. J Exp Med. 2006;203(3):755-766
21. Zhou L, Lopes JE, Chong MM. et al. Littman DR. TGF-beta-induced Foxp3 inhibits T(H)17 cell differentiation by antagonizing RORgammat function. Nature. 2008;453(7192):236-240
22. Yamamura M, Modlin RL, Ohmen JD. Mov RL Local expression of antiinflammatory cytokines in cancer. Clin Invest. 1993;91(3):1005-1010
23. Liu J, Tian Z, Sun R. The predominant expression of Th2 type cytokines in human tumor cells. Zhonghua Zhong liu Zha Zhi. 1998;20(2):105-107
24. Li G, Hu YS, Li XG, Zhang QL, Wang DH, Gong SF. Expression and switching of TH1/TH2 type cytokines gene in human gliomas. Chin Med Sci J. 2005;20(4):268-272
25. Budhu A, Wang XW. The role of cytokines in hepatocellular carcinoma. J Leukoc Biol. 2006;80(6):1197-1213
26. Voduc D, Cheang M, Nielsen T. GATA-3 expression in breast cancer has a strong association with estrogen receptor but lacks independent prognostic value. Cancer Epidemiol Biomarkers Prev. 2008;17(2):365-373
27. Gulbinas A, Berberat PO, Dambrauskas Z. et al. Aberrant gata-3 expression in human pancreatic cancer. J HistochemCytochem. 2006;54(2):161-169
28. Curiel TJ, Coukos G, Zou L. et al. Specific recruitment of regulatory T cells in ovarian carcinoma fosters immune privilege and predicts reduced survival. Nat Med. 2004;10(9):942-949
29. Ladoire S, Amould L, Apetoh L. et al. Pathologic complete response to neoadjuvant chemotherapy of breast carcinoma is associated with the disappearance of tumor-infiltrating Foxp3 regulatory T cells. Clin Cance Res. 2008;14(8):2413-2420
30. Nagaraj S, Gabrilovich DI. Myeloid-derived suppressor cells. Adv Exp Med Biol. 2007;601:213-223
31. Gallina G, Dolcetti L, Serafini P. et al. Tumors induce a subset of inflammatory monocytes with immunosuppressive activit on CD8+ T cells. J Clin Invest. 2006;116(10):2777-2790
32. Gao Q, Qiu SJ, Fan J. et al. Intratumoral balance of regulatory and cytocoxic T cells is associated with prognosis of hepatocellular carcinoma after resection. J Clin Oncol. 2007;25(18):2586-2593
33. Curiel TJ. Regulatory T cells and treatment of cancer. CurrOpinImmunol. 2008;20(2):241-246
34. Nair S, Boczkowski D, Fassnacht M, Pisetsky D, Gilboa E. Vaccination against the forkhead family transcription factor Foxp3 enhances tumor immunity. Cancer Res. 2007;67(1):371-380
35. Coe D, Begom S, Addey C, White M, Dyson J, Chai JG. Depletion of regulatory T cells by anti-GITR mAb as a novel mechanism for cancer immunotherapy. Cancer Immunol Immunother. 2010;59(9):1367-1377
36. Nizar S, Copier J, Meyer B. et al. T-regulatory cell modulation: the future of cancer immunotherapy? Br J Cancer. 2009;100(11):1697-1703
37. Jaberipour M, Habibagahi M, Hosseini A, Habibabad SR, Talei A, Ghaderi A. Increased CTLA-4 and FOXP3 transcripts in peripheral blood mononuclear cells of patients with breast cancer. Pathol Oncol Res. 2010;16(4):547-551
38. Akbari A, Rezaei A. In vitro selective depletion of CD4+CD25+ regulatory T-cells from PBMC using anti-tac-SAP. J Immunotoxicol. 2012;17:32
39. Zhang X, Munegowda MA, Yuan J, Wei Y, Xiang J. Optimal TLR9 signal converts tolerogenic CD4-8- DCs into immunogenic ones capable of stimulating antitumor immunity via activating CD4+ Th1/Th17 and NK cell responses. J Leukoc Biol. 2010;88(2):393-403
40. Kato T, Furumoto H, Ogura T. et al. Expression of IL-17 mRNA in ovarian cancer. Biochem Biophys Res Commun. 2001;282(3):735-738
41. Numasaki M, Watanabe M, Suzuki T. et al. IL-17 enhances the net angiogenic activity and in vivo growth of human non-small cell lung cancer in SCID mice through promoting CXCR-2-dependent angiogenesis. J Immunol. 2005;175(9):6177-6189
42. Sfanos KS, Bruno TC, Maris CH. et al. Phenotypic analysis of prostate-infiltrating lymphocytes reveals TH17 and Treg skewing. Clin Cancer Res. 2008;14(11):3254-3261
Author contact
![]() Corresponding author: Xiao-Ping Liu, M.D. Chief Physician, Department of Hepatobiliary Surgery, Peking University Shenzhen Hospital, Shenzhen, Guangdong, 518036. Phone: (86755) 83923333-6000 Email: ninliucom.
Corresponding author: Xiao-Ping Liu, M.D. Chief Physician, Department of Hepatobiliary Surgery, Peking University Shenzhen Hospital, Shenzhen, Guangdong, 518036. Phone: (86755) 83923333-6000 Email: ninliucom.