Impact Factor ISSN: 1449-1907

 Global reach, higher impact
Int J Med Sci 2014; 11(12):1248-1257. doi:10.7150/ijms.9694 This issue Cite
Research Paper
Influence of Exercise on the Metabolic Profile Caused by 28 days of Bed Rest with Energy Deficit and Amino Acid Supplementation in Healthy Men
Naomi E. Brooks1, Samuel M. Cadena2, Gregory Cloutier3, Sonia Vega-López4, Ronenn Roubenoff5, Carmen Castaneda-Sceppa3,5 ![]()
1. Health & Exercise Sciences, University of Stirling, Stirling, Scotland UK
2. Jean Mayer USDA Human Nutrition Research Center on Aging, Tufts University, Boston MA.
3. Bouve College of Health Sciences, Northeastern University, Boston MA
4. School of Nutrition and Health Promotion, Arizona State University, Phoenix, AZ
5. Friedman School of Nutrition Science and Policy, Tufts University, Boston MA.
Received 2014-5-20; Accepted 2014-8-27; Published 2014-9-21
Abstract
Objective Muscle loss and metabolic changes occur with disuse [i.e. bed rest (BR)]. We hypothesized that BR would lead to a metabolically unhealthy profile defined by: increased circulating tumor necrosis factor (TNF)-α, decreased circulating insulin-like-growth-factor (IGF)-1, decreased HDL-cholesterol, and decreased muscle density (MD; measured by mid-thigh computerized tomography).
Methods We investigated the metabolic profile after 28 days of BR with 8±6% energy deficit in male individuals (30-55 years) randomized to resistance exercise with amino acid supplementation (RT, n=24) or amino acid supplementation alone (EAA, n=7). Upper and lower body exercises were performed in the horizontal position. Blood samples were taken at baseline, after 28 days of BR and 14 days of recovery.
Results We found a shift toward a metabolically unfavourable profile after BR [compared to baseline (BLN)] in both groups as shown by decreased HDL-cholesterol levels (EAA: BLN: 39±4 vs. BR: 32±2 mg/dL, RT: BLN: 39±1 vs. BR: 32±1 mg/dL; p<0.001) and Low MD (EAA: BLN: 27±4 vs. BR: 22±3 cm2, RT: BLN: 28±2 vs. BR: 23±2 cm2; p<0.001). A healthier metabolic profile was maintained with exercise, including NormalMD (EAA: BLN: 124±6 vs. BR: 110±5 cm2, RT: BLN: 132±3 vs. BR: 131±4 cm2; p<0.001, time-by-group); although, exercise did not completely alleviate the unfavourable metabolic changes seen with BR. Interestingly, both groups had increased plasma IGF-1 levels (EAA: BLN:168±22 vs. BR 213±20 ng/mL, RT: BLN:180±10 vs. BR: 219±13 ng/mL; p<0.001) and neither group showed TNFα changes (p>0.05).
Conclusions We conclude that RT can be incorporated to potentially offset the metabolic complications of BR.
Keywords: resistance training, essential amino acids, energy deficit, metabolic profile
Introduction
Spaceflight, and ground based models such as immobilization and bed rest (BR), have direct and profoundly debilitating effects on skeletal muscle mass, strength, and endurance resulting in muscle weakness and fatigue (1-7). Bed rest, as a model of spaceflight, does provide features of disuse such as alterations in posture (8) however during spaceflight there appears to be neuromuscular activation which is not reported in bed rest situations (9). During extreme reduced activity, such as that noted with bed rest, there is evidence of a shift towards a less healthy whole body metabolic profile (10). Moreover, the muscle loss and metabolic changes associated with disuse may be further aggravated when combined with inadequate energy intake or anorexia (11,12).
Insulin sensitivity is reduced with BR (10,13) and may play a role in modulating changes which occur in skeletal muscle, although the mechanism by which this occurs remains to be elucidated (14). Physical inactivity leads to insulin resistance (15) and even short durations (24h) of hypocaloric nutrition and BR have been reported to decrease peripheral insulin sensitivity by 20-30% (16). Longer durations of BR have also been reported to increase insulin levels (17,18) and this is thought to occur primarily through greater insensitivity in skeletal muscle (19).
There are a plethora of factors that may influence skeletal muscle during disuse and BR leading to increased insulin levels and other metabolic changes. A number of key factors play a role in determining metabolic health including physical activity, nutrient intake (20) and metabolic derangements such as hyperinsulinemia, type 2 diabetes, dyslipidemia, and hypertension (21). A combination of environmental, genetic, and behavioural factors play a role in determining the metabolic profile of an individual. Exercise and dietary interventions, particularly essential amino acids, have been shown to attenuate the loss of muscle mass and strength seen with BR (22-27) but further investigation into the effect of disuse on metabolic profile is warranted. To investigate the influence of inactivity (eg BR) on metabolic profile, we hypothesize that a metabolically favourable profile will include decreased cortisol and inflammatory cytokines and increased IGF-1, HDL-cholesterol, and adiponectin levels, accompanied by increased normal density muscle and decreased low density muscle.
We have previously shown that resistance training has a protective effect against muscle atrophy with disuse (bed rest model) (13). Concomitant to these benefits, we found that exercise combined with an essential amino acid supplementation decreased insulin levels, fat mass, and intramuscular and subcutaneous fat measured at mid-thigh (13). The aim of this secondary analysis study was to examine the metabolic profile of normal weight/BMI individuals 30-55 years of age undergoing 28 days of strict BR while receiving essential amino acid (EAA) supplementation and an energy deficit of ~8% -to mimic the anorexia of spaceflight (12). Individuals were randomized to resistance exercise combined with EAA supplementation 5 min before or 3h after exercise or a control group (EAA supplementation with no exercise). We hypothesized that BR in the setting of energy deficit and EAA supplementation would lead to a metabolically unfavourable profile. In contrast, participants on BR assigned to resistance exercise in addition to an EAA supplement would maintain a more metabolically favourable profile.
Materials and Methods
Study Design
The details of the study design have been previously described (13). Participants were healthy males with no contraindications to exercise and no dietary restrictions that prevented full participation (aged 30-55 years; body mass index 23-31 kg/m2; n=31). The study took place at the Jean Mayer USDA Human Nutrition Research Center for Aging (HNRCA) and participants resided in the Metabolic Research Unit for the duration of the study (49 days). The study design was as follows: Baseline; Day 0-7; acclimatization and baseline measurements, Bed rest; Day 8-36; strict bed rest in the supine position for 28 days and Active recovery; Day 37-49; monitored re-ambulation and recovery. After initial testing and prior to BR, participants were randomized into 1 of 3 groups: essential amino acid supplementation alone (EAA, n=7), resistance training with EAA supplementation provided 3 hours after exercise (RT, n=12), and resistance training with EAA supplementation provided 5 minutes prior to exercise (AART, n=12). Preliminary analyses of all three groups showed no differences in any of the study outcomes between exercise groups (RT and AART), data not shown. Therefore, in the present secondary analysis study participants from both resistance training groups were combined and are referred to as “RT”. The study was approved by the Institutional Review Board at Tufts Medical Center in Boston, MA.
Energy Intake
All participants were provided with a weight maintenance diet (15% protein, 54% carbohydrates, and 33% fat) during baseline based on a 3-day food record ascertained prior to randomization. Energy expenditure was estimated from resting metabolic rate. To mimic space flight anorexia (12), during BR and recovery, participants' total energy intake was reduced by 8±6% while maintaining baseline macronutrient intake. All food and beverages were provided by the HNRCA metabolic research kitchen on a 3-day rotating cycle and supervised by a research dietician. Participant's food intake and body weight were monitored daily during the study, and weekly dietary adjustments were made as needed if changes in body weight persisted from more than 3 consecutive days. Dietary analysis was performed using the Minnesota Nutrient Data System (NDS) (Minneapolis, MN).
Essential Amino Acid (EAA) Supplement
During BR and recovery, participants were given an amino acid supplement drink once per day, 6 days of the week, on the same days that the RT groups exercised. The drink was given at the following times: 5 minutes before exercise or 3 hours after exercise (RT group) and at the same time as when participants exercised in the non-exercising EAA group. The amino acid supplement provided 15 grams of essential amino acids in 35 g sucrose (to improve palatability) dissolved in 500 ml water. This supplement provided an additional 200 kcal/day for each participant. The essential amino acid supplement composition was as follows: 1.4 g L-isoleucine, 1.3 g L-histidine, 2.8 g L-leucine, 2.4 g L-lysine, 1.5 g L-methionine, 2.4 g L-phenylalanine, 2.0 g L-threonine, and 1.2 g L-valine. This amino acid composition was chosen to ensure an increase in intracellular concentrations of essential amino acids in proportion to their respective contributions to muscle protein synthesis (27).
Resistance Training (RT)
Participants in the RT group exercised 6 days/week generating 24 exercise sessions performed during the 28-day BR phase. The RT protocol, previously described (13), was progressive and moderate-to-high intensity. Exercise sessions lasted about 1 hour and were carried out in the morning (starting at 9 am) and staggered by one hour to accommodate up to three exercise participants while having individualized exercise supervision. The target exercise intensity was 70-80% of one-repetition maximum (1RM) estimated by the OMNI rating of perceived exercise (RPE) 10-category scale (28). Upper and lower body exercises were alternated on days 1-6. During each session, 7-8 exercises were performed and the order was specifically choreographed to minimize positional and postural changes during the exercise regimen. This also contributed to reducing the potential effects of gravity on exercise performance. Upper body exercises included pull-ups, pull-over, triceps press, chest fly, shoulder press, biceps curl, upright row, and lateral arm raise. Lower body exercises included squats, single leg squats, diagonal jump, calf raise, single leg hip extension, leg curl, and single leg hip abduction. All exercises were performed in the horizontal position using a Shuttle Accel resistance training equipment (Contemporary Design Company, Glacier, WA). Resistance was provided by elastic cords attached from the stationary frame to the sliding carriage of the Shuttle Accel. Resistance for each exercise was quantified as a function of the number of elastic cords and the distance moved by the sliding carriage. For example, an exercise using one elastic cord in which the Shuttle carriage travelled a distance of 20 in. generated a force of 24 lbs. If two elastic cords were used during the same movement, the force generated was equal to 48 lbs. The Shuttle Accel had 10 elastic cords, which provide a maximum resistance of 350 lbs when the sliding carriage moved 36 in. Most exercises in the protocol were performed in the 12- to 18-in. range and therefore had a maximum resistance of ~250 lbs. The Shuttle Accel was calibrated weekly using a strain gauge to ensure that each cord provided the specified resistance, and cords were replaced as needed to maintain an adequate training stimulus.
Active Recovery
During recovery all participants performed 15-30 minutes of treadmill exercise (60-85% of age predicted max heart rate), 3 days/week. The intensity and duration increased gradually during active recovery. The RT group also performed resistance training on alternating days during the 14 day active recovery (6 training sessions) using Cybex Selectorized Equipment (Fresno, CA). Three sets of 8 repetitions were performed for 5 exercises: leg press, chest press, knee extension and flexion, and lat pull-down, with increasing intensity during recovery.
Outcome Measures
All measures were performed at baseline (prior to randomization), after 28 days of BR, and after 14 days of active recovery.
Blood Measures
Blood samples were taken in the morning after a 12 hour fast. Clinical lab specifications were followed to process the samples accordingly to biomarker being measured. Insulin-like growth factor-1 (IGF-1) was measured by a solid-phase, enzyme-labeled chemiluminescent immunometric assay (Immulite 1000, Diagnostic Products Corporation (DPC) Los Angeles, CA). Adiponectin was measured using a commercially available enzyme immunoassay kit (R&D Systems, Minneapolis, MN). Blood lipids were obtained from EDTA plasma used for the lipoprotein profile, with an enzymatic endpoint reaction on the Olympus AU400e with Olympus Cholesterol (OSR6116), High-Density Lipoprotein Cholesterol (HDL-C) (OSR6156), and Triglyceride (OSR6033) Reagents (Olympus America Inc., Melville, NY). Plasma tumor necrosis factor (TNFα), interleukin (IL)-1ß and IL-6 levels were measured by non-cross-reacting enzyme-linked immunoassays (ELISA) employing specific monoclonal and polyclonal antibodies for the analysis of specific cytokine antigens (Quantikine ELISA, R&D Systems, Minneapolis, MN). A high-sensitivity ELISA, employing an amplifier to increase sensitivity of the assay, was used for the plasma IL-6 determinations. Serum cortisol concentrations were measured immunometrically (Diagnostic Products Corporation, Los Angeles) with a detection limit of 0.1 µg/dL. Serum C-Reactive Protein (CRP) levels were measured by means of an immunoturbidimetric method in a Cobas Fara II automated centrifugal analyzer (Rankin Biomedical Corp, Clarkson, MI) using a commercially available kit (CRP SPQ Test System; DiaSorin Inc, Stillwater, MN). All laboratory measures had coefficients of variations between 0.5 and 8%.
Muscle Density
Mid-thigh muscle and fat areas were determined by image analysis of computerized tomography (CT) scan of the nondominant leg using a third generation Siemens DR3 Scanner (Erlanger, Germany). For all scans a 10-mm CT slice was taken at the precise level of the midpoint of the femur using 100 kV, 110 mA, and 1-s exposure using a standard algorithm (24). The same display field of view (DFOV) was used to take the CT images during consecutive visits, and it was also used for scaling the images during analysis. The images were analyzed by a single blinded observer according to optical densities for quantification of cross-sectional areas of fat and muscle compartments by selecting pixels within a given Hounsfield units (HU) range to the nearest 0.1 cm2 using the Slice-O-Matic Software (Tomovision, Montreal, Canada). Skeletal muscle attenuation (or muscle density) was determined by measuring the mean value of all pixels within the range of 0 to 100 HU, while adipose tissue areas were in the range of -150 to -50 HU (29). Normal density muscle was differentiated from low density muscle by cell lipid content. Normal density muscle has a higher density with a HU range of 35-100 while low density muscle ranged between 0 and 34 HU. Subfacial Fat was traced to define the compartment of fat between muscle and the fascia. Intermuscular adipose tissue was defined as adipose tissue lying between and among muscle groups. These methods have been previously described (30).
Leg Lean Mass
Regional leg lean mass was determined by Dual-X ray absorptiometry (DXA) using a Hologic QDR2000 (Waltham, MA) scanner operating in array mode with software 5.64A and coefficients of variation of 1.4% and 1.8% for total lean and fat mass, respectively (31).
Statistical Analysis
Statistical analysis was performed for participants who completed the BR and recovery phases using SPSS 20.0 for Windows (SPSS, Inc., Evanston, IL). Differences in baseline characteristics among groups (EAA vs RT - as the combination of both exercise groups, given no statistical differences in the timing of the amino acid supplement with regards to resistance exercise training) were assessed by independent t-test analysis. Data are reported as mean and standard error (SE). The non-normally distributed variables were log-transformed, checked for normality after log transformation, and used as continuous log-transformed variables for analyses. Repeated measures analyses using General Linear Models (GLM) were carried out to assess the interaction between time [baseline (or pre-bed rest), end of bed rest, and recovery] and group [amino acids vs amino acids plus exercise] on each of the dependent variables studied. Post hoc analysis could not be calculated because there are fewer than three groups to compare. Statistically significant changes over time within group are also shown were appropriate. Pearson's coefficient of correlation was used to assess univariate associations between outcomes of interest. Results were considered statistically significant with a two-tailed p value ≤ 0.05.
Results
Baseline Characteristics
Subject characteristics are shown in Table 1. There were no significant differences among groups at baseline in any of the study characteristics.
Baseline Subject Characteristics
| Characteristic | EAA (n=7) | RT (n=24) | P value |
|---|---|---|---|
| Age (y) | 44 ± 3 | 43 ± 1 | 0.80 |
| Body weight (kg) | 80.4 ± 2.8 | 83.1 ± 1.7 | 0.74 |
| Height (cm) | 178 ± 3 | 180 ± 1 | 0.64 |
| Body mass index (kg/m2) | 25.6 ± 1.3 | 25.9 ± 0.5 | 0.73 |
| Energy intake (kcal/kg/day) | 31.0 ± 1.0 | 30.0 ± 0.4 | 0.57 |
| Protein intake (g/kg/d) | 1.16 ± 0.04 | 1.12 ± 0.01 | 0.86 |
Data are mean ± SEM. EAA: essential amino acid supplementation alone, RT: resistance exercise training with AA supplement provided 3 hours post exercise or 5 minutes prior to exercise. P values represent independent t-test analysis (13).
Blood Measures
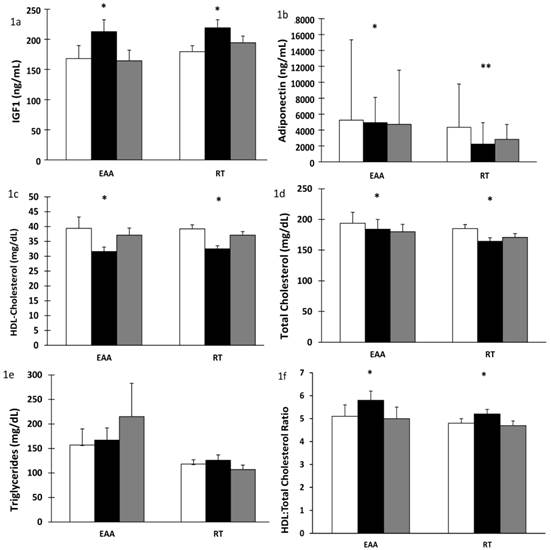
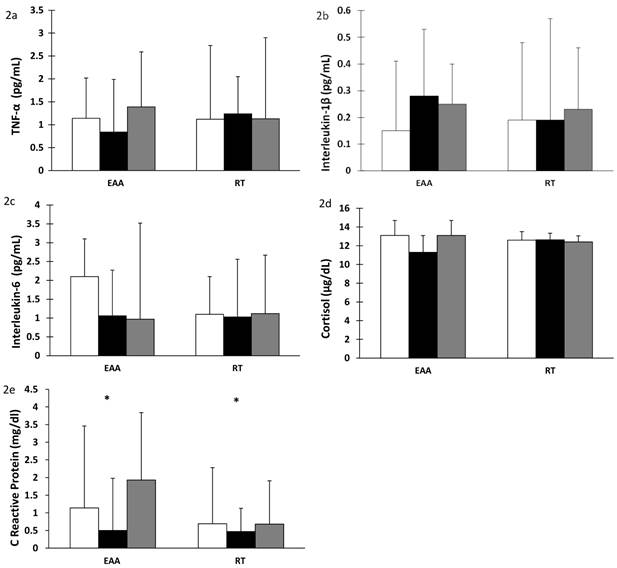
There was a significant increase in plasma IGF-1 after 28 days of BR in both the EAA and RT groups (time effect, p < 0.001). Values returned to baseline after 14 days of recovery (time effect, p < 0.001), Figure 1a. Additionally, after BR, plasma IGF-1 levels were correlated with lean leg mass (r= 0.694, p<0.001) and normal muscle density (r=0.604, p<0.002) in the RT but not the EAA group. Total adiponectin decreased significantly after BR (time effect, p < 0.001). There was a further significant change in adiponectin after recovery. However, surprisingly the RT group did not return to baseline values (time-by-group p = 0.014), Figure 1b. Similarly, there was a significant decrease in HDL-cholesterol levels after BR (time effect, p < 0.001) with a concomitant increase after recovery (time effect, p < 0.001) but did not return to baseline values (time effect, p < 0.001), Figure 1c. Total cholesterol decreased after BR in both groups (time effect, p = 0.004) and remained below baseline values even after recovery (time effect, p = 0.009); corroborating the decline in HDL-cholesterol, Figure 1d. Triglyceride levels showed a trend towards an increase after recovery only in the EAA group which was also elevated above baseline values (time-by-group, p = 0.070), Figure 1e. There was an increase in HDL:total cholesterol ratio after bed rest in both groups, 0.8 in the EAA group and 0.4 in the RT group (p = 0.005) which decreased after recovery (p < 0.001), Figure 1f. In contrast, there was no change in cytokine (TNFα, IL-1ß, IL-6) or cortisol concentrations after BR or recovery, Figures 2a-d. Interestingly, CRP decreased significantly after BR (time effect p = 0.021) and increased after recovery (time effect p = 0.003; Figure 2e).
Influence of 28 days of bed rest and 14 days active recovery on plasma IGF-1, Adiponectin, HDL-cholesterol, total Cholesterol and Triglyceride levels. Plasma levels of a) IGF-1, b) Total adiponectin, c) HDL-cholesterol, d) Total-cholesterol, e) Triglycerides, f) HDL:total-cholesterol ratio. Values are reported as mean ± SEM except median ± IQR (Total adiponectin, log transformed values). Participants were randomized into amino acid supplement (EAA) group or resistance training with amino acid supplement (RT) group. Open bars: baseline values; grey bars: values after 28 days of BR; filled bars: values after 14 days of active recovery. Repeated measures analyses using General Linear Models (GLM) were carried out to assess the interaction between time [baseline (or pre-bed rest), end of bedrest, and recovery] and group [amino acids vs amino acids plus exercise] on each of the dependent variable studied. * p < 0.01 for time effect, ** p < 0.05 for time-by-group interaction.
Cytokine, cortisol and C-reactive protein levels after 28 days of bed rest and 14 days active recovery. Plasma levels of a) TNF-α, b) IL-1β, c) IL-6, d) Cortisol, e) CRP are reported as mean ± SEM or median ± IQR (for log transformed variables). Participants were randomized into amino acid supplement (EAA) group or resistance training with amino acid supplement (RT) group. Open bars: baseline values; grey bars: values after 28 days of BR; filled bars: values after 14 days of active recovery. Repeated measures analyses using General Linear Models (GLM) were carried out to assess the interaction between time [baseline (or pre-bed rest), end of bedrest, and recovery] and group [amino acids vs amino acids plus exercise] on each of the dependent variable studied.
Muscle Density
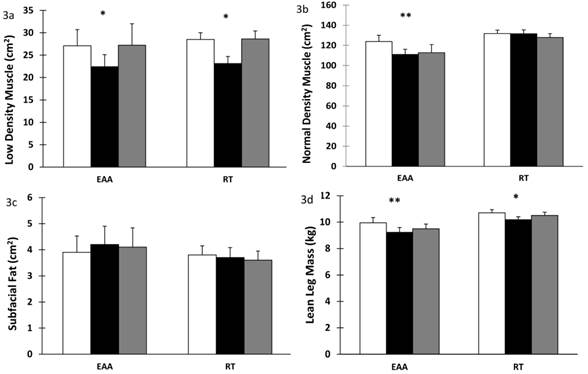
Low density muscle significantly decreased in both groups after BR (time effect, p < 0.001) and returned to baseline values after recovery (time effect p < 0.001), Figure 3a. Normal density muscle decreased significantly in the EAA group after BR (time-by-group effect, p < 0.001) and it did not return to baseline values after recovery (time-by-group effect, p = 0.002), Figure 3b. Subfacial fat showed a trend towards time-by-group effect after BR (p = 0.076) with an increase in the EAA group compared to RT, Figure 3c. Lean leg mass decreased significantly in both groups after BR (time effect, p < 0.001). After recovery the RT group increased to a greater extent than the EAA group (time-by-group effect, p = 0.033); Figure 3d. Values were previously reported in (13).
Low density, normal density muscle and subfacial fat in skeletal muscle after 28 days bed rest and 14 days active recovery. a) Low density muscle, b) Normal density muscle, c) Subfacial fat, d) Leg lean mass. Values are mean ± SEM. Participants were randomized into amino acid supplement (EAA) group or resistance training with amino acid supplement (RT) group. Open bars: baseline values; grey bars: values after 28 days of BR; filled bars: values after 14 days of active recovery. Repeated measures analyses using General Linear Models (GLM) were carried out to assess the interaction between time [baseline (or pre-bed rest), end of bedrest, and recovery] and group [amino acids vs amino acids plus exercise] on each of the dependent variable studied. *p < 0.001 for time effect, ** p < 0.001 for time-by-group interaction.
Discussion
We have previously reported skeletal muscle atrophy, increased intramuscular fat and increased insulin levels (13) after 28 days of strict BR with energy deficit. In the present secondary analysis study we further investigated the metabolic profile resulting from 28 days of strict BR in the setting of energy deficit and EAA supplementation. We defined a dysfunctional metabolic profile by a decrease in IGF-1, adiponectin, HDL-cholesterol and normal density muscle and an increase in circulating cytokines (TNFα, IL-1ß, IL-6) cortisol and low density muscle. We hypothesized that resistance exercise during BR combined with EAA supplement would promote a metabolically favourable profile, compared to the EAA supplement alone. It is important to note that, even though the present study was not powered specifically for this secondary analysis, the findings corroborated our hypothesis of a shift toward a metabolically less favourable profile after BR in both groups but a more favourable response among exercising participants. However, RT did not completely alleviate the unfavourable metabolic changes seen with BR in otherwise healthy adult males. Interestingly neither group showed an increase in cytokine levels after BR, and both groups exhibited an increase in plasma IGF-1 levels. Moreover, changes in IGF-1 significantly correlated with normal density muscle after BR in the resistance training group, as did with lean leg mass as previously shown (13).
We found that IGF-1 increased in both groups (EAA and RT) after 28 days of BR and returned to baseline values after 14 days of active recovery. This finding failed to support our hypothesis of an increase in IGF-1 only with resistance training. Changes in insulin sensitivity may influence plasma IGF-1 levels, which are important for maintenance of muscle mass. In previous studies, decreased insulin sensitivity and IGF-1 levels were reported after 24h fasting but not after 24h BR (32), and no change in IGF-1 levels were found after 14 days of BR in the eucaloric state (3). In ambulatory individuals an energy deficit of 25% did not change IGF-1 levels. However, caloric restriction combined with exercise (12.5% CR + 12.5% increase in energy expenditure with exercise) led to increased IGF-1 levels (33). These data suggest that perturbations in physical activity, whether as an increase with exercise or decrease with disuse, combined with energy deficit may influence IGF-1 response. Local elevation of IGF-1 mRNA levels in skeletal muscle have been reported after post-operative chronic disuse (34) as well as BR (35). It is thought that this may be a result of a counter-regulatory measure for protection against muscle loss. Alternatively, the increase in IGF-1 could be a counter-regulatory response to increased insulin resistance, previously demonstrated in this study (13). At the systemic level, low circulating IGF-1 has been associated with increased cardiovascular risk, and recent reports suggest IGF-1 levels are positively correlated with HDL-cholesterol, triglycerides and BMI (36). However, we suspect mechanisms may be at work to increase circulating IGF-1 to positively influence skeletal muscle and the metabolic profile during BR, regardless of an exercise intervention. These mechanisms will need to be investigated further.
We hypothesized that an unfavourable metabolic profile would be characterized by decreased adiponectin concentrations. Adiponectin is an anti-inflammatory protein secreted by adipocytes (37). Adiponectin levels decrease as fat mass increases and higher levels of plasma adiponectin are independently associated with reduced risk of type 2 diabetes in healthy individuals (38). No studies have investigated adiponectin levels after BR in healthy young individuals. In the current study adiponectin levels in the EAA group did not change significantly; however, the RT group showed a decrease in adiponectin levels which were not restored after 14 days of recovery. A recent publication looking at first degree relatives of patients with type 2 diabetes (T2D) compared to healthy controls found that both groups had decreased insulin sensitivity after 10 days of BR (39). The control group showed increased adiponectin levels while the first degree relatives of T2D patients did not exhibit a decrease in adiponectin levels after 10 days of BR (39). The authors postulate that dysfunction of adipocytes may lead to an increased inflammatory response and a reduced production of adiponectin (39). The changes we observed in the RT group suggest that there may be metabolic dysfunction despite the exercise intervention.
Interestingly, in the present study circulating concentrations of triglycerides remained constant after BR with energy deficit, regardless of exercise. In contrast, HDL-cholesterol levels were reduced after BR in the setting of energy deficit in both groups. Mazzucco et al. reported that five weeks of BR resulted in decreased HDL-cholesterol levels and increased triglyceride levels (17). Similarly, after 20 days of BR decreased HDL-cholesterol levels, increased triglyceride levels and no change in total cholesterol levels were reported (18). In ambulatory individuals caloric restriction as well as caloric restriction plus exercise led to increases in HDL-cholesterol (40). Improvements seen in HDL-cholesterol levels with caloric restriction and exercise are not maintained with disuse, while BR accompanied by energy deficit prevented the increase in circulating triglycerides (18). These findings suggest that BR with energy deficit such as in the present study, prevent detrimental increases in triglyceride levels. While exercise alleviates some of the metabolic alterations seen with BR, it does not prevent the reduction in HDL-cholesterol levels. We did observe a decrease in total cholesterol levels. Interestingly, there was an increase in the HDL:total-cholesterol ratio after BR in both groups. The EAA group increased twice as much as the RT group. The ratio of HDL:total-cholesterol takes into consideration both variables and our results show that the decrease in HDL-cholesterol influences the ratio to a greater extent than the decrease in total-cholesterol. Both groups were above the recommended ratio of 5:1 and thus at greater risk of cardiovascular disease (41) and thus, demonstrating a less favourable metabolic status. During the 14 days of active recovery, both groups returned to baseline values, which for the EAA group still represented a high risk for cardiovascular disease.
Cytokines play a key role in inflammation and immune response (42) which lead to insulin resistance, depressed myofilament function, muscle atrophy and weakness (43). Specifically, TNFα, IL-1β and IL-6 are involved in muscle degradation (43) which contributes to decreased muscle protein and loss of muscle mass and strength (44). In first degree relatives of diabetic individuals, ten days of BR was associated with increased TNFα levels (39). Similarly, in otherwise healthy individuals, 60 days of BR has been shown to increase TNFαR1, an indirect marker of TNFα signaling; however, a combined resistance-aerobic exercise program 3-4 times per week during 60 days BR was shown to prevent this increase (45). Exercise has also been reported to reduce cytokine response after BR in critically ill hospitalized patients (46). C-reactive protein (CRP) is a systemic marker of inflammation and tissue damage and is released from the liver and induced by IL-6 (47). In our study, CRP decreased in both groups after BR. In a recent article Bosutti et al. (48) found increased CRP levels after BR in eucaloric state but no increase in CRP after BR in hypocaloric state. They postulate caloric restriction during BR prevents the inflammatory response (48). Similar to our results, the cytokine findings suggest that energy deficit during BR may prevent or reduce an inflammatory response which would occur after BR in the eucaloric state. The finding that cytokine levels, particularly IL-6 which induces CRP, did not change after BR with energy deficit is of interest because of the complex interplay which the inflammatory response has with circulating lipids and intra-tissue lipid levels in health and disease states, and should be further investigated.
There were no changes in serum cortisol after BR; a stress hormone shown to increase during spaceflight or clinical BR and during trauma and illness (49). Small increases in cortisol have been found on day 1 of BR but returned to baseline for the duration of 16 days of BR and 15 days of recovery in adults (50). In contrast, five days of BR accompanied by an exercise intervention was associated with increased cortisol levels (51). It is possible that the energy deficit experienced by our study participants mitigated any potential increases in cortisol with BR. Future studies should specifically address the impact of energy intake on this stress hormone, particularly noting the timing of biomarker changes with sample collection.
A strong correlation between skeletal muscle lipid content and insulin resistance has been shown (30). Low density muscle represents lipid-rich skeletal muscle with high fat content within the muscle. We report a decrease in low density muscle in both groups after BR. Previous studies, including Manini et al. (52) report increases in intramuscular adipose after 4 weeks of unilateral lower limb suspension. We hypothesize that the complete lack of physical activity except for the resistance exercise intervention here with the BR model combined with the 8% energy deficit imposed on all participants in this study contribute to the discrepancy in these findings. Interestingly however, our results show that normal density muscle was reduced in the EAA group but maintained in the RT group, even in the face of energy deficit. This finding suggests that resistance exercise during BR may be sufficient to maintain normal muscle density, thus, contributing to a metabolically favourable profile.
Additional studies are needed to elucidate metabolic alterations after long periods of BR, particularly with energy deficit, such as that seen with spaceflight. The present study focused on the effect of BR combined with energy deficit and dietary and exercise interventions. By design it did not have a control group receiving adequate energy intake or a group undergoing exercise without nutritional intervention. The key finding for the present study that contributes to the already published body of literature on BR countermeasures in the setting of adequate energy intake, is that the combination of RT with EAA supplementation, independent of the timing in which the supplement is given, reduces but does not alleviate the deleterious metabolic alterations of disuse (e.g. BR). The findings from the present study are novel and warrant further investigation into exercise and energy deficit in the context of disuse.
In conclusion, our results show that 28 days of BR accompanied by energy deficit lead to an unfavourable metabolic profile. Further, these findings concur with previous short duration BR studies (~14 days) where energy deficit during BR prevents an inflammatory response. Resistance exercise combined with EAA supplementation during BR may reduce the shift to an unfavourable metabolic profile but does not completely alleviate the metabolic derangements seen with disuse combined with an energy deficit.
Acknowledgements
This study was presented in part at Experimental Biology, Boston, MA 2013. The authors are grateful to the study participants for their kind and valuable cooperation. We also thank undergraduate and graduate students from Tufts University, University of Massachusetts, and Northeastern University for their assistance with resistance exercise training and data collection. We thank the General Clinical Research Center (GCRC) and the Jean Mayer U.S. Department of Agriculture (USDA) Human Nutrition Research Center for Aging (HNRCA) staff for their help, and Shuttle 2000 Sports Health Equipment, for their assistance with the resistance training equipment. This work was supported by the National Space Biomedical Research Institute (NSBRI; NCC9-58), the U.S. Department of Agriculture (ARS Agreement 58-1950-9-001), the National Institutes of Health (NIH; M01 RR000054). S.M.C was supported in part by the NIH (T32 DK62032-11).
Competing Interests
The authors have declared that no competing interest exists.
References
1. Bloomfield SA. Changes in musculoskeletal structure and function with prolonged bed rest. Med Sci Sport Exerc. 1997;29(2):197-206
2. Edgerton VR, Zhou MY, Ohira Y, Klitgaard H, Jiang B, Bell G. et al. Human fiber size and enzymatic properties after 5 and 11 days of spaceflight. J Appl Physiol. 1995;78(5):1733-9
3. Ferrando AA, Lane HW, Stuart CA, Davis-Street J, Wolfe RR. Prolonged bed rest decreases skeletal muscle and whole body protein synthesis. Am J Physiol. 1996;270:E627-33
4. Greenleaf JE, Kozlowski S. Physiological consequences of reduced physical activity during bed rest. Exerc Sport Sci Rev. 1982;10:84-119
5. Hikida RS, Gollnick PD, Dudley GA, Convertino VA, Buchanan P. Structural and metabolic characteristics of human skeletal muscle following 30 days of simulated microgravity. Aviat Sp Env Med. 1989;60(7):664-70
6. LeBlanc AD, Schneider VS, Evans HJ, Pientok C, Rowe R, Spector E. Regional changes in muscle mass following 17 weeks of bed rest. J Appl Physiol. 1992;73(5):2172-8
7. Suzuki Y, Murakami T, Kawakubo K, Haruna Y, Takenaka K, Goto S. et al. Regional changes in muscle mass and strength following 20 days of bed rest, and the effects on orthostatic tolerance capacity in young subjects. J Gravit Physiol. 1994;1(1):57-8
8. Kouzaki M, Masani K, Akima H, Shirasawa H, Fukuoka H, Kanehisa H. et al. Effects of 20-day bed rest with and without strength training on postural sway during quiet standing. Acta Physiol. 2007;189(3):279-92
9. Edgerton VR, McCall GE, Hodgson JA, Gotto J, Goulet C, Fleischmann K. et al. Sensorimotor adaptations to microgravity in humans. J Exp Biol. 2001;204(18):3217-24
10. Sonne MP, Alibegovic AC, Højbjerre L, Vaag A, Stallknecht B, Dela F. Effect of 10 days of bedrest on metabolic and vascular insulin action: a study in individuals at risk for type 2 diabetes. J Appl Physiol. 2010;108(4):830-7
11. Stein TP. Nutrition and muscle loss in humans during spaceflight. Adv Sp Biol Med. 1999;7:49-97
12. Stein TP, Leskiw MJ, Schluter MD, Hoyt RW, Lane HW, Gretebeck RE. et al. Energy expenditure and balance during spaceflight on the space shuttle. Am J Physiol. 1999;276:R1739-48
13. Brooks N, Cloutier GJ, Cadena SM, Layne JE, Nelsen C a, Freed AM. et al. Resistance training and timed essential amino acids protect against the loss of muscle mass and strength during 28 days of bed rest and energy deficit. J Appl Physiol. 2008;105(1):241-8
14. Tobin BW, Uchakin PN, Leeper-Woodford SK. Insulin secretion and sensitivity in space flight: diabetogenic effects. Nutrition. 2002;18(10):842-8
15. Hamburg NM, McMackin CJ, Huang AL, Shenouda SM, Widlansky ME, Schulz E. et al. Physical inactivity rapidly induces insulin resistance and microvascular dysfunction in healthy volunteers. Arter Thromb Vasc Biol. 2007;27(12):2650-6
16. Nygren J, Thorell A, Efendic S, Nair KS, Ljungqvist O. Site of insulin resistance after surgery: the contribution of hypocaloric nutrition and bed rest. Clin Sci. 1997;93(2):137-46
17. Mazzucco S, Agostini F, Mangogna A, Cattin L, Biolo G. Prolonged inactivity up-regulates cholesteryl ester transfer protein independently of body fat changes in humans. J Clin Endocrinol Metab. 2010;95(5):2508-12
18. Yanagibori R, Kondo K, Suzuki Y, Kawakubo K, Iwamoto T, Itakura H. et al. Effect of 20 days' bed rest on the reverse cholesterol transport system in healthy young subjects. J Int Med. 1998;243(4):307-12
19. Stuart CA, Shangraw RE, Prince MJ, Peters EJ, Wolfe RR. Bed-rest-induced insulin resistance occurs primarily in muscle. Metabolism. 1988;37(8):802-6
20. Shai I, Schwarzfuchs D, Henkin Y, Shahar DR, Witkow S, Greenberg I. et al. Weight loss with a low-carbohydrate, Mediterranean, or low-fat diet. New Eng J Med. 2008;359(3):229-41
21. Blüher M. The distinction of metabolically “healthy” from “unhealthy” obese individuals. Curr Opin Lipid. 2010;21(1):38-43
22. Akima H, Kubo K, Imai M, Kanehisa H, Suzuki Y, Gunji A. et al. Inactivity and muscle: effect of resistance training during bed rest on muscle size in the lower limb. Acta Physiol. 2001;172(4):269-78
23. Akima H, Ushiyama J, Kubo J, Tonosaki S, Itoh M, Kawakami Y. et al. Resistance training during unweighting maintains muscle size and function in human calf. Med Sci Sport Exerc. 2003;35(4):655-62
24. Bamman MM, Clarke MS, Feeback DL, Talmadge RJ, Stevens BR, Lieberman SA. et al. Impact of resistance exercise during bed rest on skeletal muscle sarcopenia and myosin isoform distribution. J Appl Physiol. 1998;84(1):157-63
25. Ferrando AA, Tipton KD, Bamman MM, Wolfe RR. Resistance exercise maintains skeletal muscle protein synthesis during bed rest. J Appl Physiol. 1997Mar;82(3):807-10
26. Kawakami Y, Akima H, Kubo K, Muraoka Y, Hasegawa H, Kouzaki M. et al. Changes in muscle size, architecture, and neural activation after 20 days of bed rest with and without resistance exercise. Eur J Appl Physiol. 2001;84(1-2):7-12
27. Paddon-Jones D, Sheffield-Moore M, Urban RJ, Sanford AP, Aarsland A, Wolfe RR. et al. Essential amino acid and carbohydrate supplementation ameliorates muscle protein loss in humans during 28 days bedrest. J Clin Endocrinol Metab. 2004;89(9):4351-8
28. Robertson RJ, Goss FL, Rutkowski J, Lenz B, Dixon C, Timmer J. et al. Concurrent validation of the OMNI perceived exertion scale for resistance exercise. Med Sci Sport Exerc. 2003;35(2):333-41
29. Mitsiopoulos N, Baumgartner RN, Heymsfield SB, Lyons W, Gallagher D, Ross R. Cadaver validation of skeletal muscle measurement by magnetic resonance imaging and computerized tomography. J Appl Physiol. 1998;85(1):115-22
30. Goodpaster BH, Thaete FL, Kelley DE. Thigh adipose tissue distribution is associated with insulin resistance in obesity and in type 2 diabetes mellitus. Am J Clin Nutr. 2000;71(4):885-92
31. Clasey JL, Hartman ML, Kanaley J, Wideman L, Teates CD, Bouchard C. et al. Body composition by DEXA in older adults: accuracy and influence of scan mode. Med Sci Sports Exerc. 1997;29(4):560-7
32. Nygren J, Thorell A, Brismar K, Karpe F, Ljungqvist O. Short-term hypocaloric nutrition but not bed rest decrease insulin sensitivity and IGF-I bioavailability in healthy subjects: the importance of glucagon. Nutrition. 1997;13(11-12):945-51
33. Redman LM, Veldhuis JD, Rood J, Smith SR, Williamson D, Ravussin E. The effect of caloric restriction interventions on growth hormone secretion in nonobese men and women. Aging Cell. 2010;9(1):32-9
34. Reardon KA, Davis J, Kapsa RM, Choong P, Byrne E. Myostatin, insulin-like growth factor-1, and leukemia inhibitory factor mRNAs are upregulated in chronic human disuse muscle atrophy. Muscle Nerve. 2001;24(7):893-9
35. Brooks NE, Cadena SM, Vannier E, Cloutier G, Carambula S, Myburgh KH. et al. Effects of resistance exercise combined with essential amino acid supplementation and energy deficit on markers of skeletal muscle atrophy and regeneration during bed rest and active recovery. Muscle Nerve. 2010;42(6):927-35
36. Succurro E, Arturi F, Grembiale A, Iorio F, Laino I, Andreozzi F. et al. Positive association between plasma IGF1 and high-density lipoprotein cholesterol levels in adult nondiabetic subjects. Eur J Endocrinol. 2010;163(1):75-80
37. Chandran M, Phillips SA, Ciaraldi T, Henry RR. Adiponectin: more than just another fat cell hormone? Diabetes Care. 2003;26(8):2442-50
38. Tsuchida A, Yamauchi T, Ito Y, Hada Y, Maki T, Takekawa S. et al. Insulin/Foxo1 pathway regulates expression levels of adiponectin receptors and adiponectin sensitivity. J Biol Chem. 2004;279(29):30817-22
39. Højbjerre L, Sonne MP, Alibegovic AC, Nielsen NB, Dela F, Vaag A. et al. Impact of physical inactivity on adipose tissue low-grade inflammation in first-degree relatives of type 2 diabetic patients. Diabetes Care. 2011;34(10):2265-72
40. Lefevre M, Redman LM, Heilbronn LK, Smith J V, Martin CK, Rood JC. et al. Caloric restriction alone and with exercise improves CVD risk in healthy non-obese individuals. Atherosclerosis. 2009;203(1):206-13
41. Castelli WP, Abbott RD, McNamara PM. Summary estimates of cholesterol used to predict coronary heart disease. Circulation. 1983Apr;67(4):730-4
42. Corwin EJ. Understanding cytokines. Part I: Physiology and mechanism of action. Biol Res Nurs. 2000;2(1):30-40
43. Winkelman C. Inactivity and inflammation: selected cytokines as biologic mediators in muscle dysfunction during critical illness. AACN Clin Issues. 2004;15(1):74-82
44. Kasper CE, Talbot LA, Gaines JM. Skeletal muscle damage and recovery. AACN Clin Issues. 2002May;13(2):237-47
45. Shearer WT, Ochs HD, Lee B-N, Cohen EN, Reuben JM, Cheng I. et al. Immune responses in adult female volunteers during the bed-rest model of spaceflight: antibodies and cytokines. J Allergy Clin Immunol. 2009;123(4):900-5
46. Winkelman C, Higgins PA, Chen YJK, Levine AD. Cytokines in chronically critically ill patients after activity and rest. Biol Res Nurs. 2007;8(4):261-71
47. Fischer CP. Interleukin-6 in acute exercise and training: what is the biological relevance? Exerc Immunol Rev. 2006;12(115):6-33
48. Bosutti A, Malaponte G, Zanetti M, Castellino P, Heer M, Guarnieri G. et al. Calorie restriction modulates inactivity-induced changes in the inflammatory markers C-reactive protein and pentraxin-3. J Clin Endocrinol Metab. 2008;93(8):3226-9
49. Paddon-Jones D, Sheffield-Moore M, Urban RJ, Aarsland A, Wolfe RR, Ferrando AA. The catabolic effects of prolonged inactivity and acute hypercortisolemia are offset by dietary supplementation. J Clin Endocrinol Metab. 2005;90(3):1453-9
50. Stowe RP, Yetman DL, Storm WF, Sams CF, Pierson DL. Neuroendocrine and immune responses to 16-day bed rest with realistic launch and landing G profiles. Aviat Sp Env Med. 2008;79(2):117-22
51. Koska J, Ksinantová L, Kvetnanský R, Hamar D, Martinkovic M, Vigas M. Effects of endurance training on endocrine response to physical exercise after 5 days of bed rest in healthy male subjects. Ann NY Acad Sci. 2004;1018:569-75
52. Manini TM, Clark BC, Nalls MA, Goodpaster BH, Ploutz-Snyder LL, Harris TB. Reduced physical activity increases intermuscular adipose tissue in healthy young adults. Am J Clin Nutr. 2007;85(2):377-84
Author contact
![]() Corresponding author: Carmen Castaneda-Sceppa, MD, PhD. Professor of Health Sciences. Bouve College of Health Sciences, Northeastern University, 360 Huntington Avenue, Boston, MA 02115. Phone: 617-373-5543; Fax: 617-373-2968; E-mail: c.sceppaedu
Corresponding author: Carmen Castaneda-Sceppa, MD, PhD. Professor of Health Sciences. Bouve College of Health Sciences, Northeastern University, 360 Huntington Avenue, Boston, MA 02115. Phone: 617-373-5543; Fax: 617-373-2968; E-mail: c.sceppaedu