Impact Factor ISSN: 1449-1907

 Global reach, higher impact
Int J Med Sci 2014; 11(8):796-802. doi:10.7150/ijms.9303 This issue Cite
Research Paper
Automated Sleep Apnea Quantification Based on Respiratory Movement
M.T. Bianchi1,2 ![]() , T. Lipoma3, C. Darling3, Y. Alameddine1, M.B. Westover1
, T. Lipoma3, C. Darling3, Y. Alameddine1, M.B. Westover1
1. Neurology Department, Sleep Division, Massachusetts General Hospital, Boston MA, USA
2. Division of Sleep Medicine, Harvard Medical School, Boston, MA, USA
3. Rest Devices, Boston, MA, USA
Received 2014-4-5; Accepted 2014-5-23; Published 2014-5-30
Abstract
Obstructive sleep apnea (OSA) is a prevalent and treatable disorder of neurological and medical importance that is traditionally diagnosed through multi-channel laboratory polysomnography(PSG). However, OSA testing is increasingly performed with portable home devices using limited physiological channels. We tested the hypothesis that single channel respiratory effort alone could support automated quantification of apnea and hypopnea events. We developed a respiratory event detection algorithm applied to thoracic strain-belt data from patients with variable degrees of sleep apnea. We optimized parameters on a training set (n=57) and then tested performance on a validation set (n=59). The optimized algorithm correlated significantly with manual scoring in the validation set (R2 = 0.73 for training set, R2 = 0.55 for validation set; p<0.05). For dichotomous classification, the AUC was >0.92 and >0.85 using apnea-hypopnea index cutoff values of 5 and 15, respectively. Our findings demonstrate that manually scored AHI values can be approximated from thoracic movements alone. This finding has potential applications for automating laboratory PSG analysis as well as improving the performance of limited channel home monitors.
Keywords: algorithm, prediction, respiration, classification, sleep apnea
Introduction
Obstructive sleep apnea (OSA) is a common disorder with implications for health, well-being, and neuro-cognitive performance. Prevalence estimates are typically in the range of 5-25% of adults, depending on the demographics and definitions of respiratory events [1, 2], with higher prevalence occurring with certain co-morbidities [3]. Despite the high prevalence and treatable nature of the disorder, many individuals with OSA remain un-diagnosed, in part due to the cost, inconvenience, and variable availability of sleep laboratory testing. Although laboratory polysomnogram (PSG) remains the gold standard for diagnosis, portable diagnostic devices are becoming increasingly utilized for home testing, which holds important promise for reducing the burden of undiagnosed OSA. Although portable devices are often assumed to be cost-effective alternatives to lab PSG testing, these devices have important limitations and formal cost-effectiveness studies have questioned the widely held cost-saving assumption [4-8]. The literature shows that the sensitivity and specificity of portable devices are only modest, such that the American Academy of Sleep Medicine practice parameters restricts their use to patients with strong pre-test probability (>80%) of moderate or severe OSA [9, 10], in other words, home testing should be used only to confirm the diagnosis in those with already high clinical suspicion. However, if improved performance of home monitoring devices is accomplished, their utility as an alternative to in-lab testing might in the future enjoy more broad applicability. This is particularly important given increasing cost-burden associated with modern health care delivery.
Current manual scoring guidelines use multiple streams of PSG-derived data to characterize apnea and hypopnea events during sleep, including measures of effort, airflow, and pulse oximetry. In fact, a review of the evidence supporting the use of portable monitors, no single-channel devices were considered sufficiently accurate for quantifying OSA [10]. However, several research reports suggest promising results for single-channel approaches to OSA detection. For example, analysis of oximetry, nasal pressure, and load cells have shown sensitivity and specificity values in the low to mid 80s percentage range [11-15]. If the fluctuations in the multiple data streams utilized in manual scoring are internally correlated, it should be possible to extract substantial information from subsets of data. We tested the hypothesis that respiratory effort alone correlated with the apnea-hypopnea index (AHI) obtained by manual scoring. Having an easily accessible surrogate for respiratory events that conventionally require multiple channels would offer important opportunities to improve upon portable OSA testing. Specifically, to the extent that a respiratory index such as the AHI remains the clinical standard for diagnosing OSA, improvements in extracting this information are important to advance diagnostic accuracy.
Methods
Patient population
Polysomnography (PSG) data from adult men and women who underwent clinical testing in our center were selected for analysis. The Institutional Review Board approved retrospective analysis of our clinical PSG database without additional consent. The PSGs were not selected based on clinical indication, although most were conducted for evaluation of sleep apnea. Selection was based on AHI and respiratory disturbance index (RDI) values to capture a broad spectrum of severity. We did not exclude recordings based on medication or medical history. This allowed a broad spectrum of clinical features to be present and preservation of the potential generality of the findings. The population was chosen to represent typical categories of sleep disordered breathing, including: none (AHI<5), mild (AHI 5-15), moderate (AHI 15-30), and severe (AHI>30). For the main analysis, we only considered PSGs in which the RDI was similar to the AHI. Specifically, for the group with "no OSA", all had RDI <6 and AHI<5. For patients with AHI 5-15, the RDI values were <25 and always within 15 points of the AHI. For patients with AHI values >15, the RDI was always within 20 points. We separately selected individuals who showed substantially higher RDI than AHI values. For one group (n=10), the AHI was <5 while the RDI was >15, and for the second group, the AHI was >15, and the RDI was >20 points above the AHI.
The PSGs were randomly divided into two groups, ensuring that the spectrum of severity was similar in each group. An exhaustive brute-force parameter search using n=57 diagnostic PSGs was performed on the training set, to maximize the correlation coefficient between the algorithm event index and the scored AHI. We used the parameters in the training set for validation on the remaining n=59 testing set. Independent of the algorithm optimization, we manually rated the signal quality of the abdominal and chest belt signals as good, intermediate, and high-artifact. We then repeated optimization after excluding the high artifact records (n=8 in the training set, and n=5 in the validation set). In this optimization set, we also restricted analysis to time spent in any scored sleep stage (i.e., we excluded scored wake time).
The respiratory event detection algorithm was designed to search respiration signal time series data for periods of decreased respiration amplitude from the abdominal and chest effort belts for a minimum duration of time (at least 10 seconds). The raw signals from the abdomen and the chest belts were filtered and normalized, and the peaks of each inhalation were identified. The algorithm then employed an envelope tracking function that follows the respiration movement peaks, in particular following periods when the respiration amplitude falls. This tracking function responds with a lag to amplitude decrements - that is, it is limited in terms of how fast it “falls”. In this way, the decline occurs at a slower rate than the normal respiration if there is a decrement in signal, such as might occur with apneas and hypopneas. Note that even obstructive apneas and hypopneas involve ongoing effort, but within the events the amplitude of the belts is often seen to be somewhat lower amplitude. The tracking function is adaptive, that is, for each detected breath, a new amplitude threshold is defined, based on the height of the previous peak, which accommodates potential drift in breath size or belt amplitude changes over a night. If a signal amplitude decrement is encountered for a minimum time duration, a respiratory event is marked. During the optimization routine, three parameters were investigated in a brute-force test of the parameter space: the rate of “fall” of the tracking function; the threshold of the drop to score an event, and the minimum duration of that decrement in amplitude to score an event (starting at 10 seconds minimum). In each subject, the algorithm used either the abdominal belt or the chest belt depending on the signal to noise ratio in windows of 30 seconds duration.
To determine whether algorithm accuracy was influenced by factors such as age, sex, BMI, leg movements, or sleep efficiency, we conducted nonparametric correlation analysis with the absolute and relative error between the algorithm counts and the gold standard technician counts.
Results
Table 1 shows the clinical characteristics of the cohort, which included a spectrum of apnea severity. The values were similar for the restricted data set in which high-artifact individuals were removed, and this excluded group was not different in terms of Table 1 metrics (not shown).
Characteristics of training and testing groups
| Train set (n=57) | Validation set (n=59) | |
|---|---|---|
| Age | 50 (18-83) | 54 (18-84) |
| Sex (% male) | 59.6 | 52.5 |
| BMI | 31 (26-38) | 28.0 (25-32) |
| TST (min) | 367.3 (328.9-420.4) | 376.0 (318.5-416.0) |
| Sleep latency (min) | 6.0 (2.0-10.6) | 5.0 (1.0-11.0) |
| Efficiency (%) | 87.1 (77.1-90.7) | 85.4 (74.7-92.2) |
| N1 (min) | 48.3 (31.6-85.3) | 41.0 (25.0-52.7) |
| N1 (%) | 13.9 (8.5-21.2) | 11.9 (6.8-16.9) |
| N2 (min) | 205.5 (169.5-239.5) | 187.5 (152.5-217.0) |
| N2 (%) | 54.7 (46.7-64.0) | 52.2 (45.9-59.5) |
| N3 (min) | 45.3 (18.3-73.6) | 60.0 (28.5-89.0) |
| N3 (%) | 12.2 (5.6-19.6) | 16.5 (7.0-25.1) |
| REM (min) | 53.8 (27.5-76.5) | 56.5 (34.5-82.0) |
| REM (%) | 14.6 (9.3-20.2) | 15.4 (10.9-21.6) |
| REM Lat (min) | 122.3 (72.4-225.0) | 112.5 (74.0-174.0) |
| PLMS (#/hr) | 17 (10.6-36.8) | 11.8 (1.2-29.1) |
| AHI (#/hr) | 11.7 (3.1-24.3) | 12.3 (3.1-22.1) |
| RDI (#/hr) | 15.4 (4.5-33.0) | 17.9 (6.7-32.9) |
| # central events | 2.0 (0.0-12.8) | 2.0 (1.0-7.0) |
Values are median with 25-75% range (except sex, which is given as % only, and age, which is given as a min-max range).
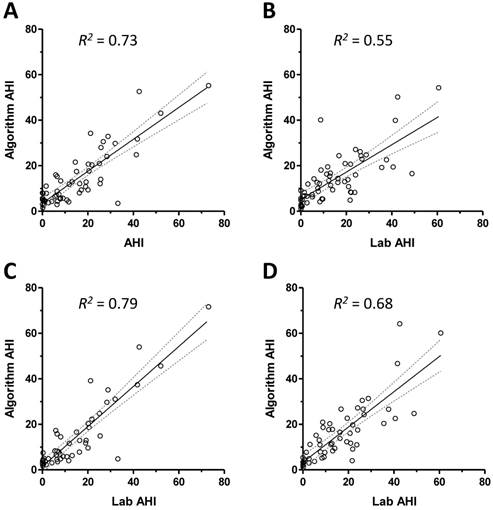
Figure 1 shows the relationship between the respiratory event index according to the algorithm and the technician scored AHI values from overnight PSG data. The correlations are shown for the training set and testing set in Figures 1A and 1B; both were significant to p<0.0001, but the coefficient was smaller in the validation set. We then repeated parameter optimization after excluding records judged to have excessive signal artifact (see methods) and restricting analysis to PSG epochs scored as wake. The improved correlation coefficients are shown for the training set and testing set in Figures 1C and 1D.
Correlation of algorithm with technician scored PSG AHI values. Panel A shows the scatter plot of the algorithm index against the technician-scored index for subjects in the training set. The best fit line (solid line) and 95% confidence intervals (dotted lines) are given, with the resulting R2 value. Panel B shows the scatter plot and best fit line with confidence intervals for the validation set. The scatter plots and best fit lines are also shown after excluding high-artifact individuals and restricting analysis to scored sleep during the PSG, for the training set (panel C) and testing set (panel D).
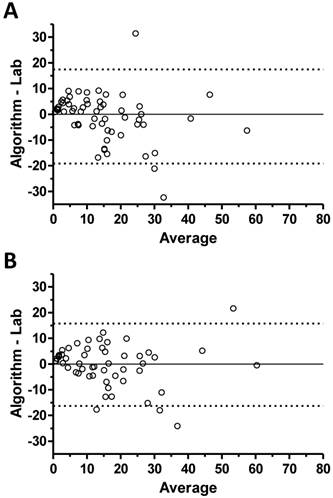
Bland-Altman analysis was performed for validation set performance based on the full data set (Figure 2A) and the restricted data set of scored sleep in good quality records (Figure 2B). This analysis revealed that the algorithm tended to over-estimate the respiratory event rate for low AHI cases (by PSG criteria) and tended to under-estimate the event rate as the PSG-scored AHI value increased.
Bland-Altman plots. The difference between the algorithm AHI and the PSG AHI (y-axis) is plotted against the average of these two metrics in Bland Altman plots performed using the full data set (panel A), and the set restricted to scored-sleep and excluding high-artifact records (panel B).
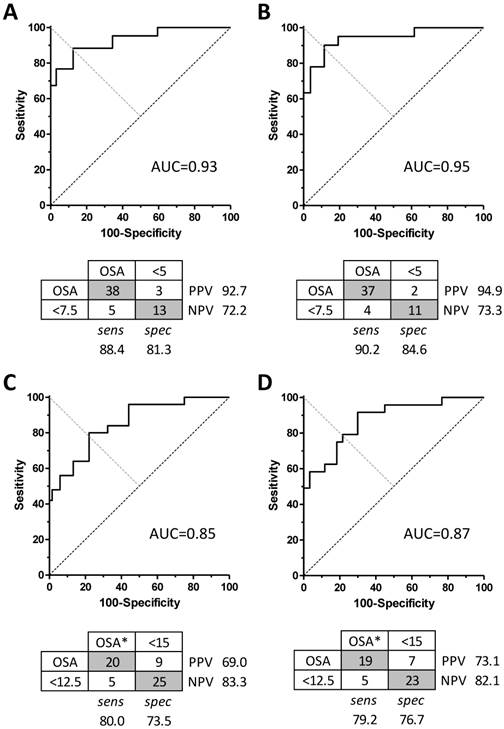
We next conducted receiver operator characteristic (ROC) analysis on the validation set data, by varying the algorithm score cutoff value for apnea-or-not classification, to determine the sensitivity, specificity, and area under the curve (AUC) for categorizing each case according to binary clinical cutoff values of PSG AHI =5 (Figure 3A and 3B) or PSG AHI =15 (Figure 3C and 3D). In each case, the analysis was performed when all subjects were included versus excluding high-artifact records and scored wake time. The AUC values using a cutoff of PSG AHI =5 cutoff were similar for the whole set and for the restricted data set (0.93 versus 0.95, respectively) (Figure 3A and 3B). At a threshold respiratory event rate value of 7.5 for the algorithm, the sensitivity was 88.4%, and the specificity was 81.3%. This yields a positive likelihood ratio (LR(+)) of 4.7, and LR(-) of 0.14. Considering the restricted data set, for a cutoff of AHI =5, a threshold respiratory event rate value of 7.5 for the algorithm improved the sensitivity to 90.2% and the specificity to 84.6%. The LR(+) and LR(-) values were 5.9 and 0.12, respectively. The AUC values for a cutoff of AHI =15 indicated decreased accuracy in the validation set including all subjects or the restricted set (Figure 3C and 3D). Here, the sensitivity and specificity values were ≤80% in each case.
Algorithm performance for sleep apnea severity categorization. The area under the curve (AUC) is shown for dichotomous sleep apnea categorization using a cutoff AHI = 5 when applied to the whole data set (panel A) versus the filtered set (panel B). Below each AUC curve is the corresponding confusion matrix of the optimal performance, including sensitivity, specificity, and predictive value. Categories determined by PSG AHI are in the columns, while the cutoff values used for the algorithm to yield these performance indices are in the rows. Similar plots are shown using a cutoff value for PSG AHI =15 (panels C and D).
We also investigated algorithm accuracy (optimized as above) when applied to two groups of patients with large disparities between the RDI and AHI values, one in which the AHI values were <5 while the RDI values were >15, and another in which AHI values were greater than 15 and the RDI exceeded the AHI by at least 20. In the former group, the correlation coefficient was 0.42 (p<0.05) using parameters optimized for the restricted data set, and was non-significant using parameters optimized for the entire data set (data not shown). In the latter group, the correlation coefficient was 0.46 (p<0.001) for the restricted set, and 0.34 (p<0.006) for the full set (data not shown). Thus, performance is sensitive to the types of respiratory events, such that the presence of excess RERAs was associated with reduced performance. That the algorithm could score individuals closer to the AHI in some cases and closer to the RDI in other cases raises the possibility that RERAs are heterogeneous and may include a subset that resemble apneas and hypopneas in terms of respiratory effort.
Finally, we performed correlation analysis to determine whether the accuracy of respiratory event rate values depended on certain clinical and PSG characteristics. Table 2 shows the correlation coefficient values for the accuracy defined as the absolute difference between PSG AHI and the algorithm score. Scoring accuracy did not vary with age, sex, BMI, or sleep architecture parameters.
Correlations with algorithm index accuracy
| Age | 0.32 |
| Sex (% male) | 0.23 |
| BMI | -0.18 |
| TST (min) | -0.05 |
| Efficiency (%) | 0.05 |
| N1 (min) | 0.24 |
| N1 (%) | 0.26 |
| N2 (min) | 0.05 |
| N2 (%) | 0.05 |
| N3 (min) | -0.28 |
| N3 (%) | -0.27 |
| REM (min) | 0.15 |
| REM (%) | 0.15 |
| REM Lat (min) | -0.23 |
| PLMS (#/hr) | 0.21 |
| # central events | 0.26 |
Pearson r-values for the restricted data set (excluding scored wake, and excluding high-artifact records). None were significant at p<0.05
Discussion
The respiratory events that occur in sleep apnea are categorized into conventional classes, such as obstructive versus central, or apnea versus hypopnea versus RERA, based on visual interpretation of a combination of physiological signals. We tested the hypothesis that the AHI can be quantified using only the respiratory effort signal, and found that respiratory effort signal contains sufficient information to quantify sleep apnea in an automated manner. Algorithm performance correlated well with manually scored AHI values obtained during routine diagnostic laboratory PSG, and the algorithm performed well across a range of sleep apnea severity. These results have implications both for automated event counting to facilitate human PSG scoring, and for improving the performance of home sleep monitoring devices that capture respiratory movements. Improving automated apnea detection has implications for improved screening for undiagnosed OSA using home monitoring devices, which are currently limited in their evidence basis.
Clinical implications
Under modern definitions, signals of respiratory effort, air flow, and oxygen saturation are involved in scoring apneas and hypopneas, and also characterizing respiratory events as obstructive versus mixed or central. These distinctions continue to play an important role in clinical sleep medicine at diagnosis as well as during titration and treatment monitoring. Limited channel portable monitoring is increasingly available for OSA diagnostics [9, 10]. These devices typically acquire respiration effort, airflow, and oxygen saturation. There is only one portable monitor approved by Medicare in the United States that does not involve a measure of airflow and respiration effort (the WatchPAT from Itamar). None of the approved devices utilizes a single channel of physiology [9].
The standard for accuracy of a portable apnea monitor proposed by the AASM [9] was modest: a positive likelihood ratio of 5, which can be obtained for example with a device showing 84% sensitivity and 84% specificity. An LR(+) of 5 can also be achieved with other combinations, for example sensitivity as low as 50% or 25% if specificity were 90% or 95%. However, the AASM guidelines required the sensitivity to be at least 82.5% to combine with specificity in this to yield the LR minimum of 5 (that is, the minimum specificity would be 83.5%).
Our study demonstrates that changes in respiratory effort encode sufficient information regarding the respiratory pauses of sleep disordered breathing to allow for automated detection of apneas and hypopneas. Distinguishing between RERAs (contributing only to the RDI) and apneas/hypopneas (contributing to the AHI and the RDI) is primarily a concern when the two values differed substantially, especially when the AHI is in the normal range. In this setting, our algorithm performance was sub-optimal. However, when both the RDI and AHI values were greater than 5, accuracy was preserved in detection of OSA (AHI>5). In other words, although the accuracy was poor from a correlation coefficient standpoint, the algorithm was accurate in dichotomous classification of OSA in that setting, without any false negatives.
Evidence for the diagnostic utility of single-channel physiology algorithms
Several groups have investigated single channel approaches to OSA detection. In a cohort of patients with major cardiovascular disease and/or risk factors, two thirds of whom had AHI >15 on PSG, pulse oximetry signals showed high correlation with the AHI (>0.90), including accurate detection of Cheyne-Stokes respiration [13]. However, not all studies of oximetry have been positive [16], including important differences between automated desaturation indices compared to expert-reviewed signals [17]. In addition, inter-device measurement variance is a notable source of uncertainty when considering validation studies using oximetry [18].
Single lead ECG has been reported for detection of obstructive events using machine learning applied to data after excluding artifacts [19], as well as for distinguishing central from obstructive patterns of sleep apnea events [20]. Nasal pressure alone showed high detection accuracy across a range of OSA severity observed in a clinical population at high risk for OSA [11]. However, other studies showed that accuracy of this approach was lower in patients with diabetes [21]. In addition to using single channel analysis of routinely acquired signals, other methods for recording sleep disordered breathing have been proposed, including audio [22, 23], radio frequency analysis [24, 25], mattress sensors [26], and load cells placed under the bed [15].
Conclusion
The AHI remains a commonly used clinical metric of OSA presence and severity. Portable monitor measurements of the AHI, or a surrogate for it, hold important promise for improving the diagnostic utility of limited channel testing. Respiratory effort signals are easily accessible markers of respiratory pauses that would correlate with standard metrics that consider airflow, oxygenation, and EEG changes. Although clinical scoring of sleep apnea during PSG testing combines oximetry and EEG arousal, it is evident from this study that much of the information contained in these multi-channel scoring techniques, particularly information relevant for determination of apnea severity, is carried by respiratory effort in isolation. This approach has implications for automated analysis of data acquired in the laboratory setting, as well as potentially improved the diagnostic yield of home devices that employ respiratory effort. Improved screening technology is especially important for neurological populations, in whom undiagnosed OSA is prevalent, such as stroke [27], cognitive impairment [28], degenerative disorders [29], and epilepsy [30]. Treatment of this reversible cause of sleep disturbance holds promise for improving neurological function.
Acknowledgements
Dr Bianchi has received support from the department of Neurology, Massachusetts General Hospital, the Young Clinician Award from the Center for Integration of Medicine and Innovative Technology, and the Harvard Catalyst KL2 Medical Research Investigator Fellowship. Dr. Westover received support from the American Brain Foundation.
Competing Interests
MTB, TL, and CD are inventors on pending patents related to a tee-shirt device that measures respiration. MTB has consulting agreement with Sunovion, and is on the clinical advisory board of Foramis, Inc. YA and MBW have no competing interests to declare.
References
1. Eastwood PR, Malhotra A, Palmer LJ, Kezirian EJ, Horner RL, Ip MS. et al. Obstructive Sleep Apnoea: From pathogenesis to treatment: Current controversies and future directions. Respirology. 2010;15:587-95 doi:10.1111/j.1440-1843.2009.01699.x
2. Kapur VK. Obstructive sleep apnea: diagnosis, epidemiology, and economics. Respir Care. 2010;55:1155-67
3. Loke YK, Brown JW, Kwok CS, Niruban A, Myint PK. Association of obstructive sleep apnea with risk of serious cardiovascular events: a systematic review and meta-analysis. Circulation Cardiovascular quality and outcomes. 2012;5:720-8 doi:10.1161/CIRCOUTCOMES.111.964783
4. Reuven H, Schweitzer E, Tarasiuk A. A cost-effectiveness analysis of alternative at-home or in-laboratory technologies for the diagnosis of obstructive sleep apnea syndrome. Med Decis Making. 2001;21:451-8
5. Pietzsch JB, Garner A, Cipriano LE, Linehan JH. An integrated health-economic analysis of diagnostic and therapeutic strategies in the treatment of moderate-to-severe obstructive sleep apnea. Sleep. 2011;34:695-709 doi:10.5665/SLEEP.1030
6. Chervin RD, Murman DL, Malow BA, Totten V. Cost-utility of three approaches to the diagnosis of sleep apnea: polysomnography, home testing, and empirical therapy. Ann Intern Med. 1999;130:496-505 doi:199903160-00006 [pii]
7. Parthasarathy S. CON: thoughtful steps informed by more comparative effectiveness research is needed in home testing. Journal of clinical sleep medicine: JCSM: official publication of the American Academy of Sleep Medicine. 2013;9:9-12 doi:10.5664/jcsm.2326
8. Deutsch PA, Simmons MS, Wallace JM. Cost-effectiveness of split-night polysomnography and home studies in the evaluation of obstructive sleep apnea syndrome. Journal of clinical sleep medicine: JCSM: official publication of the American Academy of Sleep Medicine. 2006;2:145-53
9. Collop NA, Tracy SL, Kapur V, Mehra R, Kuhlmann D, Fleishman SA. et al. Obstructive sleep apnea devices for out-of-center (OOC) testing: technology evaluation. Journal of clinical sleep medicine: JCSM: official publication of the American Academy of Sleep Medicine. 2011;7:531-48 doi:10.5664/JCSM.1328
10. Collop NA, Anderson WM, Boehlecke B, Claman D, Goldberg R, Gottlieb DJ. et al. Clinical guidelines for the use of unattended portable monitors in the diagnosis of obstructive sleep apnea in adult patients. Portable Monitoring Task Force of the American Academy of Sleep Medicine. Journal of clinical sleep medicine: JCSM: official publication of the American Academy of Sleep Medicine. 2007;3:737-47
11. Ragette R, Wang Y, Weinreich G, Teschler H. Diagnostic performance of single airflow channel recording (ApneaLink) in home diagnosis of sleep apnea. Sleep & breathing = Schlaf & Atmung. 2010;14:109-14 doi:10.1007/s11325-009-0290-2
12. Gantner D, Ge JY, Li LH, Antic N, Windler S, Wong K. et al. Diagnostic accuracy of a questionnaire and simple home monitoring device in detecting obstructive sleep apnoea in a Chinese population at high cardiovascular risk. Respirology. 2010;15:952-60 doi:10.1111/j.1440-1843.2010.01797.x
13. Amir O, Barak-Shinar D, Henry A, Smart FW. Photoplethysmography as a single source for analysis of sleep-disordered breathing in patients with severe cardiovascular disease. Journal of sleep research. 2012;21:94-100 doi:10.1111/j.1365-2869.2011.00927.x
14. Grover SS, Pittman SD. Automated detection of sleep disordered breathing using a nasal pressure monitoring device. Sleep & breathing = Schlaf & Atmung. 2008;12:339-45 doi:10.1007/s11325-008-0181-y
15. Beattie ZT, Hayes TL, Guilleminault C, Hagen CC. Accurate scoring of the apnea-hypopnea index using a simple non-contact breathing sensor. Journal of sleep research. 2013;22:356-62 doi:10.1111/jsr.12023
16. Epstein LJ, Dorlac GR. Cost-effectiveness analysis of nocturnal oximetry as a method of screening for sleep apnea-hypopnea syndrome. Chest. 1998;113:97-103
17. Bohning N, Zucchini W, Horstmeier O, Bohning W, Fietze I. Sensitivity and specificity of telemedicine-based long-term pulse-oximetry in comparison with cardiorespiratory polygraphy and polysomnography in patients with obstructive sleep apnoea syndrome. J Telemed Telecare. 2011;17:15-9 doi:10.1258/jtt.2010.100205
18. Bohning N, Schultheiss B, Eilers S, Penzel T, Bohning W, Schmittendorf E. Comparability of pulse oximeters used in sleep medicine for the screening of OSA. Physiol Meas. 2010;31:875-88 doi:10.1088/0967-3334/31/7/001
19. Yilmaz B, Asyali MH, Arikan E, Yetkin S, Ozgen F. Sleep stage and obstructive apneaic epoch classification using single-lead ECG. Biomed Eng Online. 2010;9:39. doi:1475-925X-9-39 [pii]10.1186/1475-925X-9-39
20. Thomas RJ, Mietus JE, Peng CK, Gilmartin G, Daly RW, Goldberger AL. et al. Differentiating obstructive from central and complex sleep apnea using an automated electrocardiogram-based method. Sleep. 2007;30:1756-69
21. Erman MK, Stewart D, Einhorn D, Gordon N, Casal E. Validation of the ApneaLink for the screening of sleep apnea: a novel and simple single-channel recording device. Journal of clinical sleep medicine: JCSM: official publication of the American Academy of Sleep Medicine. 2007;3:387-92
22. Abeyratne UR, de Silva S, Hukins C, Duce B. Obstructive sleep apnea screening by integrating snore feature classes. Physiol Meas. 2013;34:99-121 doi:10.1088/0967-3334/34/2/99
23. Azarbarzin A, Moussavi Z. Snoring sounds variability as a signature of obstructive sleep apnea. Medical engineering & physics. 2013;35:479-85 doi:10.1016/j.medengphy.2012.06.013
24. De Chazal P, Fox N, O'Hare E, Heneghan C, Zaffaroni A, Boyle P. et al. Sleep/wake measurement using a non-contact biomotion sensor. Journal of sleep research. 2011;20:356-66 doi:JSR876[pii]10.1111/j.1365-2869.2010.00876.x
25. Li C, Lin J, Xiao Y. Robust overnight monitoring of human vital signs by a non-contact respiration and heartbeat detector. Conference proceedings: Annual International Conference of the IEEE Engineering in Medicine and Biology Society IEEE Engineering in Medicine and Biology Society Conference. 2006;1:2235-8 doi:10.1109/IEMBS.2006.260148
26. Polo O, Brissaud L, Sales B, Besset A, Billiard M. The validity of the static charge sensitive bed in detecting obstructive sleep apnoeas. The European respiratory journal. 1988;1:330-6
27. Tomfohr LM, Hemmen T, Natarajan L, Ancoli-Israel S, Loredo JS, Heaton RK. et al. Continuous positive airway pressure for treatment of obstructive sleep apnea in stroke survivors: what do we really know? Stroke, a journal of cerebral circulation. 2012;43:3118-23 doi:10.1161/STROKEAHA.112.666248
28. Tsai JC. Neurological and neurobehavioral sequelae of obstructive sleep apnea. NeuroRehabilitation. 2010;26:85-94 doi:N512270473932731 [pii]10.3233/NRE-2010-0538
29. Gaig C, Iranzo A. Sleep-disordered breathing in neurodegenerative diseases. Current neurology and neuroscience reports. 2012;12:205-17 doi:10.1007/s11910-011-0248-1
30. van Golde EG, Gutter T, de Weerd AW. Sleep disturbances in people with epilepsy; prevalence, impact and treatment. Sleep medicine reviews. 2011;15:357-68 doi:S1087-0792(11)00004-9 [pii]10.1016/j.smrv.2011.01.002
Author contact
![]() Corresponding author: Dr Matt T. Bianchi, Wang 7 Neurology, Massachusetts General Hospital, 55 Fruit Street, Boston, MA02114. mtbianchiorg; Phone: 617-724-7426; Fax: 617-724-6513
Corresponding author: Dr Matt T. Bianchi, Wang 7 Neurology, Massachusetts General Hospital, 55 Fruit Street, Boston, MA02114. mtbianchiorg; Phone: 617-724-7426; Fax: 617-724-6513