Impact Factor ISSN: 1449-1907

 Global reach, higher impact
Int J Med Sci 2014; 11(1):87-96. doi:10.7150/ijms.7651 This issue Cite
Research Paper
Microgravity Inhibits Resting T Cell Immunity in an Exposure Time-Dependent Manner
Haiying Luo, Chongzhen Wang, Meifu Feng, Yong Zhao ![]()
State Key Laboratory of Biomembrane and Membrane Biotechnology, Institute of Zoology, Chinese Academy of Sciences, Beijing, China
Received 2013-9-12; Accepted 2013-12-11; Published 2013-12-21
Abstract
Background: Decline immune function is well documented after spaceflights. Microgravity is one of the key factors directly suppressing the function of immune system. Though T cell immune response was inhibited by microgravity, it is not clearly whether activation would be inhibited after a pre-exposure of microgravity on T lymphocytes at the resting state. Methods: We herein investigated the response ability of resting CD4+ and CD8+ T cells experiencing pre-exposure of modeled microgravity (MMg) for 0, 8, 16 and 24 hrs to concanavalin A (ConA) stimulation. The phenotypes and subsets of immune cells were determined by flow cytometry. Results: Both CD4+ and CD8+ T cells with an MMg pre-exposure exhibited decreased expressions of activation-markers including CD25, CD69 and CD71, inflammatory cytokine secretion and cell proliferation in response to ConA compared with T cells with 1g controls in an MMg exposure time- dependent manner. Moreover, short term MMg treatment caused more severe decreased proliferation in CD4+ T cells than in CD8+ T cells. Conclusions: MMg can directly impact on resting T cell subsets. CD4+ T cells were more sensitive to the microgravity inhibition than CD8+ T cells in respect of cell proliferation. These results offered new insights for the MMg-caused T cell functional defects.
Keywords: Immune response, T cells, microgravity, proliferation, spaceflight.
INTRODUCTION
It is well documented that astronauts experience a decline in immune system function during or after short spaceflights, which will potentially increase the risk of infection greatly 1-3. Data from astronauts and rodents flown in space have shown that distribution of immune cell subsets changed, and peripheral lymphocyte numbers were decreased and immune cells showed poor responsive to mitogenic lectins 4-7. Clearly, long term space travel creates a challenge of preventing and controlling infections 3. In addition to cosmic radiation and physiologic stress, microgravity has been reported to play an important role in the immune function compromise 8-10. There is a critical need for a better understanding of consequences of immune dysfunction inherent to the microgravity environment in the space.
T cell activation plays an important role in various humoral and cellular immune responses. T cells isolated from space-flown astronauts and animals exhibited decreased proliferation, cytokine secretion and activation-marker expression in response to TCR agonists 4,7,11. However, these experiments could not rule out whether these alterations in T cells were caused by microgravity, cosmic radiation and physiologic stress or even the indirect impacts of the body microenvironments during spaceflight. In the past years, the inhibiting effects of microgravity on T cell activation were analyzed by in vitro experiments performed during spaceflight compared to a 1g in-flight centrifuge control or in a rotating clinostat or a rotating-wall vessel (RWV) bioreactor on the ground, under conditions similar to the effects occurring in microgravity 10,12. In most of these experiments, T cells were activated by mitogenic stimuli and exposed to microgravity at the same time. The effects of microgravity on resting T cells have not been determined so far. Moreover, the human T cell compartment is comprised of phenotypically and functionally distinctive CD4+ T helper and CD8+ cytotoxic T cell subsets. Whether these distinct T cell subsets own different sensitivity to microgravity is unclear.
In the current study, we addressed these issues using a rotary bioreactor system. The survival and immune response ability of T cell subsets after pre-exposing to modeled microgravity (MMg) for different time periods were detected. We found that CD4+ T cell subsets are more sensitive to the microgravity inhibition than CD8+ T cells. The concanavalin A (ConA)-induced activation and cell proliferation of both CD4+ and CD8+ T cells were significantly suppressed in an MMg-exposure-time dependent manner. Thus, our studies showed that microgravity could directly impair the survival and function of resting T cells.
MATERIALS AND METHODS
Animals
Adult male C57BL/6 (B6) mice were purchased from the Vital River Experimental Animal Center (Beijing, China). All animals were housed in specific-pathogen free conditions, and before experiment, mice were allowed 1-wk to acclimate to the animal facility after delivery from the supplier. All experimental procedures were in accordance with the Institution Guidelines for the Care and Use of Laboratory Animals.
Splenocyte isolation
Each of the experiments presented here were performed using mouse splenocytes. Immune cells were isolated from each spleen according to an established protocol 13. In brief: after sacrifice, mouse spleens were aseptically removed and placed in RPMI1640 medium (Gibco, USA ). Splenocytes were isolated by mechanical dissociation through sterile nylon mesh, followed by red blood cell lysis (Treated with 17mM Tris-HCl and 140mM NH4Cl, pH 7.2). Cells were suspended in RPMI 1640 supplemented with L-glutamine (2mM), penicillin (100U/ml), streptomycin (0.1mg/ml), 2-ME (5×10⁻⁵ M), and 10% FBS.
Rotary bioreactor system
Modeled microgravity effects were generated by culturing cells in an in-house developed MG-I rotary bioreactor system at 10 rpm. Within the system, a 10-ml round-pan tank for cell culture is fixed on a steel shaft and can be driven to rotate by an electrical motor. The rotary velocity can be regulated in the range from 0 to 30 rpm. The tank is separated from outside by a pair of 0.2mm thick silicone membranes which are CO2 and O2 permeable on its right and left sides respectively. The reactor is a 3-dimensional suspension culture system that should be completely filled with culture medium so that the fluid and the vessel will rotate as a solid body to suspend cells in a state of constant free-fall and thereby reduce the effective gravitational force experienced by the cells (Klaus, 2001). Before the bioreactor rotating, there should be without any bubbles in it, otherwise, the cell activity might be impaired by a great fluid shear force during rotating progress. In the present study, total 3×10⁷ cells (3×10⁶ cells/ml×10ml) were added into the MG-I rotary bioreactor system and cultured in a humidified incubator at 37oC and 5% CO2 for 0h, 8h,16h and 24h (Called as the MMg group). During the experiments, the static cultured cells in the same vessel with the same concentration were used as control (Called as the static control group).
mAbs and chemical reagents
The following mAbs were purchased from BD Biosciences PharMingen (San Diego, CA): anti-mCD4-FITC, anti-mCD4-PE, anti-mCD69-PE, anti-mCD95-FITC, anti-mKi67-PE, anti-mIL-2-PE and anti-m IFN-γ-PE. Anti-mCD8-PE-Cy5, anti-mCD25-PE and anti-mCD71-PE were obtained from Ebioscience (San Diego, CA). Concanavalin A (ConA), phorbol myristate acetate (PMA), Ionomycin, CFSE and IL-2 were purchased from Sigma-Aldrich.
Flow cytometry (FCM)
Cells were collected and washed twice with ice cold FACS buffer (PBS, pH 7.2, containing 0.1% NaN3 and 0.5% BSA). 5×10⁵ cells were resuspended in 100 uL FACS buffer and blocked by anti-mouse FcR mAb (2.4G2) followed by incubation with fluorochrome conjugated mAbs at 4℃ for 30 minutes. Cells were washed twice with FACS buffer and at least ten thousand cells were assayed using a FACS Calibur and Beckman Coulter Epics XL, and data were analyzed with CellQuest software.
T cell activation
After the rotary or stationary culture, the splenocytes were collected. The collected cells (4×10⁵ cells/well) were cultured in flat-bottom 96-well plates with 2.5 μg/ml Con A for 24h, 48h and 72h or PMA and Ionomycin for 6h at 37°C and 5% CO2 as described previously 7,14.
Proliferation assay
1×10⁷ cells were labeled with CFSE in the dark for 8-9 minute incubation at 37°C and then washed with 10ml PBS buffer. The cells were resuspended with RPMI 1640 medium supplemented with L-glutamine (2mM), penicillin (100 U/ml), streptomycin (0.1 mg/ml), 2-ME (5×10⁻⁵ M), and 10% FBS and cultured in flat-bottom 96-well plates (5×10⁵ cells/well) and activated with ConA for 48h and 72h. To determined cell proliferation of T subsets, the cultured cell were stained with anti-mouse CD4 and CD8 antibody and analyzed by FCM 15.
Apoptosis assay
After activated by ConA for 48h and 72h, apoptosis of splenocytes was assayed by FCM using Annexin V, propidium iodide (PI) staining with gated on CD4+ and CD8+ cells.
Intracellular levels of cytokines
The intracellular levels of the IL-2 and IFN-γ cytokines were measured gated on CD4+ and CD8+ T cells16. Briefly, splenocyts were stimulated by PMA and Ionomycin for 6h in the presence of protein transport inhibitor (containing Brefeldin A, BD, USA) to inhibit the secretion of cytokines. Cells were then labeled with anti-mCD4-FITC and anti- mCD8α-PE-Cy5 for gating on the T cell subsets. Subsequently, cells were fixed, permeabilized, and labeled with anti-mIL-2-PE or anti-mIFN-γ-PE. The fraction of CD4+ or CD8+ T cells that synthesized the cytokines was determined by FCM.
RNA preparation and real-time PCR assay
Total RNA was extracted RNAeasy Mini kits (Omega) according to the manufacturer's protocol and was reversely transcribed into cDNA using oligo(dt) primers and reverse transcriptase enzyme (Takara, Japan). Real-time PCR was performed with a CFX96 real-time PCR detection system (Bio-Rad) using SYBR Premix Ex Taq (Perfect Real time) kit (Takara) to quantitate the PCR product 17. Hypoxanthine phosphoribosyltransferase (HPRT) was used as an internal control. Primers were used in the present study as follows: IL-2 sense: TGAACTTGGACCTCTGCGGCAT and antisense: AGTTATTGAGGGCTTGTTGAGA; IFN-γ sense: GAACTGGCAAAAGGATGGTGA and antisense: TGTGGGTTGTTGACCTCAAAC.
Statistical Analysis
All data are presented as the mean±SD. Statistical analysis was performed with SPSS 11.0, using either the t-test or one-way ANOVA. A p value less than 0.05 was considered to be statistically significant.
RESULTS
The response to ConA of CD4+ and CD8+ T cells was inhibited after MMg pre-exposure
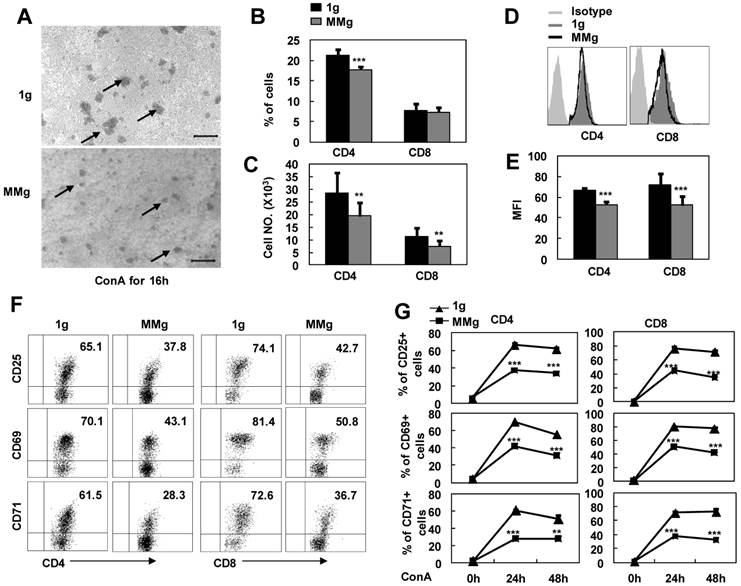
It was reported that some astronauts experienced infection after spaceflights because of the T lymphocyte function decline 3. In order to address whether microgravity exposure alone can directly impact on resting T cell immunity, we cultured the splenocytes firstly in a rotary bioreactor system for 16h in which the microgravity effects were modeled 18,19, and then, transferred the cells to static conditions and stimulated with ConA. As seen in Fig.1A, the colony formation of MMg pre-exposure T cells were smaller than those of the control group (1g) after ConA stimulation for 16h observed under the microscope. In parallel, the numbers of CD4+ and CD8+ T cell subsets were also decreased about 30% after a 24h-ConA stimulation in the MMg pre-exposure group as determined by flow cytometry (P<0.01, Fig.1B,C). In addition, the mean fluorescence intensity (MFI) of CD4 and CD8 molecular staining were significantly decreased compared to the 1g control (P<0.01, Fig.1D,E), indicating that the cluster and the polarity of these molecules were impaired during the activation of T cells. Although T cells express only low levels of surface molecules including CD25, CD69 and CD71 at the resting state, these activation markers will be rapidly up-regulated upon activation with Con A. After a 16h static culture, 60-70% CD4+ and 70-80% CD8+ T cells were normally induced to express these activation markers by 24h and 48h ConA stimulation, while only near a half of the CD4+ and CD8+ T cells, which were pre-exposed to a 16h-MMg, were induced to express these molecules at the same activation time points (P<0.001, Fig.1F-G), and moreover, the MFI of these markers were also significantly down-regulated compared to the controls (data not shown). These results proved that MMg pre-exposure resulted in a decreased T cell activation at early stage, and this suppression was not restored until 48h activation in both CD4+ and CD8+ T cell subsets.
The response of T cell subsets to ConA after MMg pre-exposure. The mouse splenocytes were cultured in a rotary bioreactor system for 16h in which the modeled microgravity effects were generated (a static culture system were used as control), and then, the cells were transferred to the static conditions with 2.5 μg/ml ConA supplying. A) Microscopic appearance of splenocyte colonies after a 16h-ConA simulation. The arrows show the cell colonies. Bars=100μm. The Percentages (B), and numbers (C) of CD4+ and CD8+ T cells were analized by FCM after a 24h-ConA simulation. The FACS profile analysis (D) for CD4 and CD8 staining after a 24h-ConA simulation, and the corresponding statistical results of mean fluorescence intensity (MFI) (E) were shown. F) Phenotypically characterization of CD25, CD69 and CD71 in gated on CD4+ and CD8+ T cells was evaluated after 24h activation. G) The frequencies of CD4+ and CD8+ T cell subsets positive for activation markers (CD25, CD69 and CD71) after 24h and 48h ConA simulation were summarized. Data represented as means±SD. ** p<0.01, and *** p<0.001compared with the static control group (1g).
The proliferation response to ConA of CD4+ and CD8+ T cells were suppressed after MMg pre-exposure
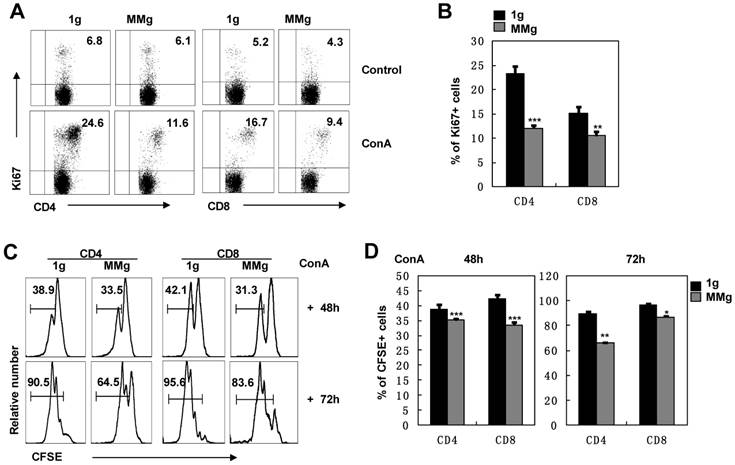
The ultimate response of splenocytes to Con A is the proliferation of T lymphocytes 14. We analyzed the expression of Ki67, a marker of cell division 20, in T cell subsets after ConA activation. After 16h static culture, almost 24% of CD4+ and 15% of CD8+ T cells were dividing at the 48h-activation point, while the dividing proportions of CD4+ (12%) and CD8+ (10%) T cells in the MMg group were significantly decreased and only half in CD4+ cells and two-thirds in CD8+ cells of those in the static control group (P<0.01, Fig. 2A,B). These results suggested that MMg pre-exposure suppressed the proliferation of T cells and the suppression on CD4+ T cells was more obvious compared with CD8+ T cells. This conclusion was supported by analysis of CFSE labeling cells during a 3-day continuous ConA activation. Within either CD4+ or CD8+ populations, almost 30% had proliferated during the previous 48h activation in the MMg group, which was significantly lower than that in the static control group in which about 40% cells had proliferated (P<0.001, Fig. 2C-D). Until 72h, although proliferation of CD4+ and CD8+ cells in both groups was increased, the proportion of proliferated T cells in the MMg group were still lower than that in the static control (P<0.01, Fig. 2C-D). Taken together, these data indicate that T cells with an MMg pre-exposure at resting stage had decreased proliferation ability in the following activation.
The proliferation of T cell subsets in response to ConA after 16h-MMg pre-exposure. After 16h-MMg pre-exposure, the splenocytes were activated with ConA at a static conditions and the proliferation of T cell subsets was assayed. A) The FACS profile analysis of Ki67+ cells gated on CD4+ and CD8+ T cells after ConA stimulation for 48h was shown. B) The proportion of CD4+ and CD8+ T cells positive for Ki67 after ConA stimulation for 48h were summarized. The original flow cytometry histograms (C) and statistical summary representative of the proliferation percentages (D) of CD4+ and CD8+ T cells were shown. B6 splenocytes were labeled with CFSE and then cultured with ConA for 48 and 72h respectively, the cell division was determined by FCM. Data represented as means±SD. *, p<0.05, **, p<0.01 and ***, p<0.001compared with the static control group (1g).
The MMg inhibited resting CD4+ and CD8+ T cells in an exposure time dependent manner
In order to further understand whether the MMg-inhibition on CD4+ and CD8+ T cell activation was associated with the MMg pre-exposure time, we cultured the splenocytes in a rotary culture condition for 0, 8, 16 and 24h. Next, these cells were activated under the static condition by ConA for 24h. Firstly, we determined the expressions of the activation markers by FCM. The proportions of cells positive for activation markers like CD25, CD69 and CD71 in CD4+ and CD8+ T cells after only 8h MMg pre-exposure were nearly 50% lower than those in the synchronous static control (p<0.001, Fig. 3A,B), and this trend was also observed after 16h and 24h MMg pre-exposure (Fig. 3A,B). Moreover, this reduction of the activation marker expression was in an MMg pre-exposure time-dependent manner, especially in the expression of CD25 and CD69 (Fig.3B). It was noted that in 24h MMg pre-exposure group, both CD4+ and CD8+ T cells were nearly failure to express CD69, which is consistent with the previous reports showing that surface CD69 only expressed in the early activation stage of T cells (Fig. 3A,B).
The responses of T cell subsets to ConA after different MMg pre-exposure time. After 0h, 8h, 16h and 24h MMg pre-exposure, the splenocytes were transferred to a static culture condition and stimulated by ConA for 24h and 72h respectively. A) Mean fluorescence intensity (MFI) for CD25, CD69 and CD71 staining was shown gated on CD4+ and CD8+ T cells respectively. B) Percentages of cells positive for CD25, CD69 and CD71 in CD4+ and CD8+ T cell populations after a 24h-ConA stimulation. C) The FACS profile analysis of proliferation of CD4+ and CD8+ T cells after a 72h-ConA stimulation was shown. D) The proportional changes of proliferated CD4+ and CD8+ T cells after a 72h-ConA stimulation. Data were represented as means±SD. *, p<0.05, **, p<0.01 and ***, p<0.001compared with the static control group (1g).
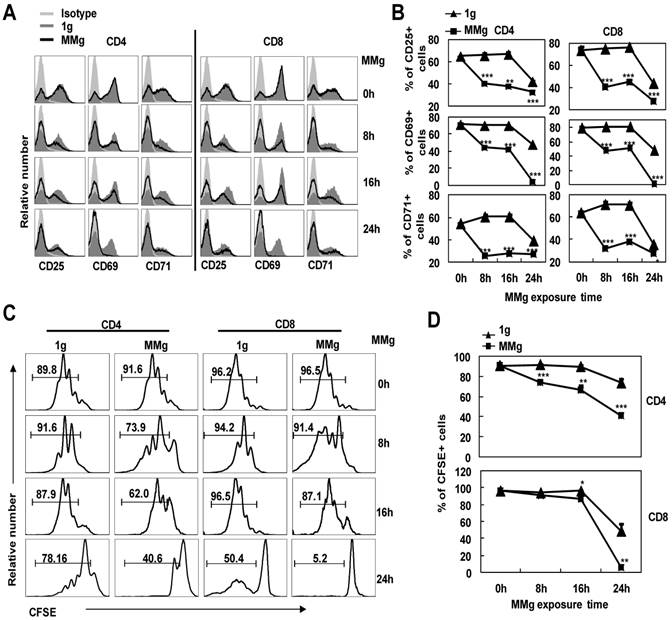
The proliferation of CD4+ and CD8+ T cells stimulated with ConA for 72h was next examined after different MMg pre-exposure time periods (0, 8, 16 and 24h). Before activation, cells were labeled by CFSE, and after 72h activation, the proportion of the proliferating cells in both two T cell subsets was analyzed by FCM. The MMg-inhibition on CD4+ and CD8+ T cell proliferation was also in an MMg pre-exposure time dependent manner as the same trend observed in the activation marker expression (P<0.01, Fig. 3C,D). Importantly, the proliferation of CD4+ T cells was suppressed as short as 8h MMg pre-exposure, while the MMg suppression on CD8+ T cell proliferation happened until 16h pre-exposure (P<0.05, Fig. 3C-D). These results suggested that CD4+ T cells were more sensitive to MMg inhibition than CD8+ T cells.
MMg pre-exposure decreased the cytokine production of CD4+ and CD8+ T cells in response to ConA
Cytokines secreted from T cells are important for the proliferative response of T cells to stimuli 7. To further explore the capability to produce cytokines of activated CD4+ and CD8+ T cells that experienced MMg pre-exposure, we investigated IL-2 and IFN-γ productions in splenocytes activated with ConA or PMA plus Ionomycin after 16h MMg pre-exposure. As shown in Fig. 4A, MMg pre-exposure significantly inhibited mRNA expression of IL-2 and IFN-γ in splenocytes after 24h-ConA or 6h-PMA/Ionomycin stimulation as determined by Real-time PCR assays (p<0.05). In line with this result, the protein level expressions of IL-2 and IFN-γ in T cells were also inhibited during PMA/Ionomycin stimulating process after MMg pre-exposure as determined by intracellular staining FCM (P<0.05, Fig. 4B-C). The proportion of CD8+ T cells positive for IFN-γ were markedly decreased compared with the static control cells, which was much more obviously diminished than that in CD4+ T cells. The same trend of IL-2 expression was observed in CD4+ T cells after MMg pre-exposure while that in CD8+ T cells was unchanged.
The cytokine production of T cell subsets and the IL-2 effect on their proliferation in response to ConA after MMg pre-exposure. After 16h-MMg pre-exposure, the splenocytes were activated with ConA at a static conditions or PMA plus Ionomycin, and then IL-2 and IFN-γ productions were investigated. A) IL-2 and IFN-γ mRNA expressions of splenocytes were evaluated after 24h-ConA or 6h-PMA/Ionomycin stimulation determined by Real-time PCR assays. B) The FACS profile analysis of IL-2 and IFN-γ intracellular staining gated on CD4+ and CD8+ T cells was shown. C) The percentages of T cell subsets positive for IL-2 and IFN-γ after 6h-PMA/Ionomycin stimulation were summarized. The FACS profile analysis (D) and the proportional changes of proliferation of CD4+ and CD8+ T cells (E) after a 72h-ConA stimulation with or without IL-2 supplying were shown. Data were represented as means±SD. *, p<0.05, **, p<0.01 and ***, p<0.001compared with the static control group (1g).
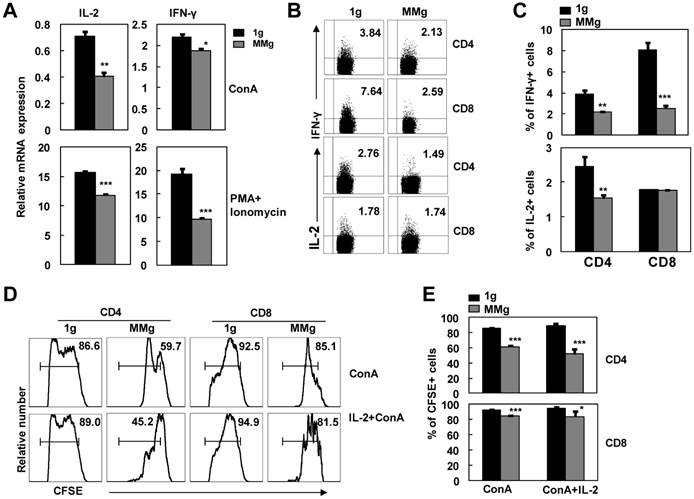
IL-2 is a key growth cytokine in the activation process of T cells 21. The interaction of IL-2 with its high-affinity receptor (CD25) on the T cells was a very important step toward proliferation and survival 22. Because the production of IL-2 was inhibited after MMg pre-exposure, we added exogenous recombinant IL-2 into the ConA-activation culture system to attempt to rescue the poor proliferation of T cells caused by MMg. After 72h stimulation, the proportion of the proliferating cells in CFSE-labeling CD4+ and CD8+ subsets was examined by FCM. IL-2, as high as 100 U/ml, could not significantly restore the proliferation of the MMg pre-exposed T cells to the control values (p<0.05, Fig. 4D-E). These results suggested that the down-regulated expression of CD25 and the decreased IL-2 production cooperatively contributed to the MMg-inhibited T cell proliferation.
The effects of MMg pre-exposure on the apoptosis of CD4+ and CD8+T cells
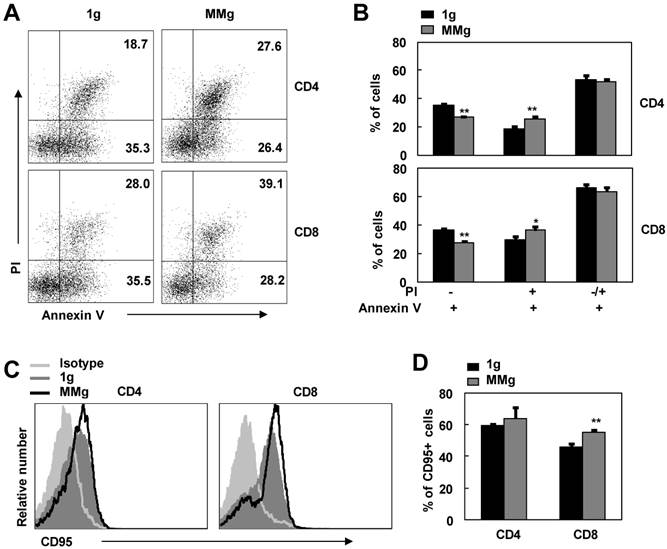
After initial stimulation with stimuli, activated T lymphocytes become sensitive to apoptosis 23,24. This is a self-regulatory loop to help prevent excessive T cell accumulation and associated immunopathology 23,25. In order to access the effect of MMg pre-exposure on this destined death, we used Annexin V/PI staining FCM assay to examine the apoptosis of ConA-activated CD4+ and CD8+ T cells that experienced MMg pre-exposure. As shown in Fig. 5, in contrast to the static control cells, the proportion of Annexin V binding cells (Apoptotic cells) in MMg-pre-exposed CD4+ and CD8+ T subsets was not changed in response to a 48h-ConA activation (p>0.05). Whereas, within these Annexin V+ cells, the percentages of early apoptotic cells (Annexin V+ and PI-) were significantly lower in both CD4+ and CD8+ T populations compared with the static control cells at this time point (p<0.01, Fig.5 A-B). On the other hand, the percentages of late apoptotic cells (Annexin V+ and PI+) in T cells with an MMg pre-exposure were higher than that in the control cells (p<0.05, Fig.5 A-B). Likewise, the same trend was also seen after 72h-ConA activation (data not shown), whereas there were no differences in the proportions of both early and late apoptotic cells between the MMg-exposed group and the static control after 24h-ConA activation (data not shown). Thus, MMg experience could make T cell subsets into apoptotic stage earlier and faster during activation process compared with the static control culture. Fas/FasL pathway is one of main pathway mediating lymphocyte apoptosis 26. In present study, the proportion of MMg-pre-exposed CD8+ but not CD4+ T cells positive for Fas (CD95) expression was slightly but significantly higher than that of static-experienced cells after ConA stimulation for 48h as well as 24h (p<0.01, Fig. 5C,D and data not shown). This indicated that Fas/FasL pathway might be one of the pathways involved in the enhanced apoptosis of T cell subsets after MMg pre-exposure.
The apoptosis and CD95 expression of MMg pre-exposed T cell subsets in response to ConA were changed. The FACS profile analysis (A) and the proportions of cell apoptosis (B) in gated on CD4+ and CD8+ cells after ConA stimulation for 48 hrs were shown. Mean fluorescence intensity (MFI) (C) and percentages of cells positive for CD95 staining in both CD4+ and CD8+ T cells (D) were summarized. Data were represented as means±SD. *, p<0.05, and **, p<0.01compared with the static control group (1g).
DISCUSSION
In the present study, we showed that MMg could directly impact resting T cell sunsets in multiple respects including proliferation and inflammatory cytokine production by using a rotary bioreactor system on the ground. In past years, experiments from both flight and ground based model systems clearly indicate that T lymphocytes fail to be activated in response to mitogenic stimuli in clinorotation/RWV bioreactor and in real microgravity culture 10,12,14,27. However, most activation experiments were conducted just within microgravity culture system from the beginning. In other words, T cells experienced activation and microgravity exposure at the same time. It has been well known that the peripheral T cells are maintained in a resting state and consisted with naïve T cells mostly under normal conditions 28. It is unknown whether a pre-exposure of microgravity on T cells at the resting state will alter their following-up activation. We found for first time that the MMg pre-exposed T cells at the resting state were failure to fully response to the sequent stimuli. The expression of activation markers were inhibited at a large degree on the plasma membrane, including the early activation molecules CD69 and CD25 and the late activation molecules CD71. The frequency of these markers in our study was about as low as a half of the synchronous static control cells in both CD4+ and CD8+ T populations after 24h of activation and was not recovered until 48h stimulation. In addition to activation marker expression, the process of the division and proliferation of CD4+ and CD8+ T cells was significantly slowed down and inhibited by MMg pre-exposure. It was noteworthy, moreover, that the inhibition of MMg pre-exposure on the expression of the activation markers and the cell proliferation in T cell activation was in an exposure-time dependent manner. These findings indicated that the resting T cells could not achieve a full activation after an MMg pre-exposure. The rotary cell culture system (the rotary bioreactors) used here is just a model system for mimicking some biological effect of microgravity, which is the best available for studying the effects of microgravity on cells.10,18,29. Nevertheless, it is worthy to be noted whether these findings are consistent with those in the real microgravity needs to be demonstrated.
We proposed that the low level expression of the activation markers was, at least in part, responsible for the reduction of the cell proliferation during T cell activation after MMg pre-exposure since these activation markers participate in cell proliferation and correlate with the degree of immune activation 30. Additionally, the expressions of the activation markers were inhibited in an MMg exposure time-dependent manner as the same trend of cell proliferation. The low expression of CD25 and CD69 expressions in our results indicated that the activation of both T cell subsets was inhibited by the MMg pre-exposure before the entry of cell cycle, which was in line with the previous reports supported by MMg synchronous exposure with activation 10,31. It was reported that CD69 was a type II membrane protein with a calcium dependent lectin domain in the extracytoplasmic region, and interaction with its ligand may triggered the activation and proliferation of T cells 32-34. Thus, the low expression of CD69 might, at least in partially, responsible for the decreased proliferation of T cell subsets through reducing the interaction with its ligand after MMg pre-exposure.
CD25 as an activation marker during early T cell activation is the high-affinity receptor of IL-2 14,35. CD25 expression is required gene transcription after TCR stimulation and the low expression of CD25 will reduce the response of the activated T cell to IL-2 22. In our study, both CD25 and IL-2 expressions were all markedly decrease in CD4+ and CD8+ T cell populations during the process of activation after MMg pre-exposure, suggesting that MMg pre-incubation suppressed the activation and proliferation of the two T cell populations partially by inhibiting the CD25 and IL-2 expression. Additionally, the exogenous IL-2 rescue experiment further indicated that the reduction of CD25 expression played an important role on the MMg pre-exposure dependent decline of cell proliferation as well. On the other hand, since exogenous IL-2 did not fully rescue the decreased proliferation of T cells up to the values of the static control cells. CD71 as a late activation marker usually named as membrane glycoprotein transferrin receptor (TfR) that is up-regulated as a mechanism to meet the increased iron demands associated with increased metabolism of activated T cells, and meanwhile to act as a housekeeping receptor that binds iron-loaded transferrin at cell surface and trigger internalization 36,37. Moreover, the newest study demonstrated that CD71 was identified as a novel IKK-binding partner and involved in IKK-NF-κB signaling pathway that exerted transcriptional control over a large number of genes significantly induced during T cell activation 38,39. In the absence of TfR1, NF-κB does not translocate to the nucleus efficiently, resulting in a binding reduction to target gene promoters and consequently less target gene activation 38. Recent studies have showed that NF-κB pathway could be inhibited by microgravity exposure 39,40. In the present study, the expression of CD71 in T cell activation was down-regulated to a very low level even after an 8h-MMg pre-exposure, and cytokine production controlled mostly by NF-κB pathway were also inhibited by MMg pre-exposure, suggesting that the inhibition of microgravity on NF-κB pathway might be associated with the low-level expression of CD71.
It has been demonstrated that the activation of T cells involves the rearrangement of cell membrane fluctuations relevant to the actin and microtubules cytoskeleton remodeling 41. Recent studies have illustrated that T cells can functionally polarize their some cell surface receptors clustering toward antigen-presenting cells (APCs) to facilitate TCR/CD3-mediated signaling and T cell activation 42-44. Although the distribution of CD4 and CD8 molecules on resting T cell was random without forming polarity on cell-membrane fluctuations, once T cells were activated, these molecules were clustered to form nano-domains co-localized with TCR/CD3 nano-domains and polarized predominantly in the peak of the cell-membrane fluctuations resulting in the molecule density increasing 43,44. In our study, we found that the MFI of CD4 and CD8 molecule on activated T cells were significantly lower after MMg pre-exposure than that in the static control, suggesting that the rearrangement of cell membrane fluctuations during T cell activation was inhibited by the MMg pre-exposure of resting T cells. In addition, the rearrangement of the activated T cell membrane fluctuation can also induce the expression for some cell surface molecules such as CD69 and CD71. The recent study has showed that during activation, most CD69 molecules were clustered and polarized in the peak of the cell-membrane fluctuations served as transient platforms driving TCR/CD3-induced signaling, whereas CD71 molecules mainly distributing in the membrane-valley fluctuations appeared to facilitate iron uptake and maintain full T cell activation 44. In present study, the low expressions of CD69 and CD71 may be related to the reduction of the rearrangement of cell membrane fluctuations in the MMg pre-exposed T cells compared with the static control during activation. Therefore, the proliferation of T cells might be affected indirectly by the changes of the rearrangement of cell membrane fluctuations in the MMg pre-exposed T cells.
Additionally, MMg pre-exposure made T cell subsets into apoptotic stage earlier and faster during activation compared with the static control. It was reported that CD71 was related to cell apoptosis, indicating that the increased susceptibility of T cells to activation-linked apoptosis after MMg pre-exposure might be a result of low expression of CD71 38. On the other hand, CD95 expression on T cells was up-regulated by pre-exposure to MMg. It is known that CD95 pathway could mediate activation-induced cell death in T cells 23,25. Thus, up-regulated CD95 expression on T cells by pre-exposure to MMg might also contribute to the increased cell death.
In summary, the function of T cells in response to stimuli could be inhibited if the T cells experienced an MMg pre-exposure at the resting state. The MMg pre-exposure significantly inhibited the expressions of activation markers including CD25, CD69 and CD71 on CD4+ and CD8+ T cells and T cell proliferation ability as well as increased cell death of activated T cells in a time-dependent manner. CD4+T cells were more sensitive to MMg pre-expose than CD8+ T cells. The direct effects of MMg exposure on T cell subsets may help us to understand the decreased anti-infection immunity of individuals experiencing space flight and offered new cell targets for us to prevent MMg-reduced immunity in the future.
Acknowledgements
We thank Dr. Chenming Sun for his review of the manuscript, Mrs Jianxia Peng for her expert technical assistance, Mrs Yanli Hao for excellent laboratory management, and Mr. Hongfei Wu for outstanding animal husbandry. This work was supported by grants from the National Basic Research Program of China (2011CB710903, 2010CB945301, YZ), the National Natural Science Foundation for General and Key Programs (C81130055, U0832003, YZ; C31200681, HL) and the Strategic Pioneer Project on Space Science of Chinese Academy of Sciences (XDA04020202-19, YZ).
COMPETING INTERESTS
The authors have declared that no competing interest exists.
References
1. Mermel LA. Infection Prevention and Control During Prolonged Human Space Travel. Clin Infect Dis. 2012
2. Taylor GR. Overview of spaceflight immunology studies. J Leukoc Biol. 1993;54(3):179-188
3. Crucian B, Sams C. Immune system dysregulation during spaceflight: clinical risk for exploration-class missions. J Leukoc Biol. 2009;86(5):1017-1018
4. Gridley DS, Slater JM, Luo-Owen X. et al. Spaceflight effects on T lymphocyte distribution, function and gene expression. J Appl Physiol. 2009;106(1):194-202
5. Allebban Z, Ichiki AT, Gibson LA, Jones JB, Congdon CC, Lange RD. Effects of spaceflight on the number of rat peripheral blood leukocytes and lymphocyte subsets. J Leukoc Biol. 1994;55(2):209-213
6. Crucian B, Stowe R, Mehta S. et al. Immune System Dysregulation Occurs During Short Duration Spaceflight On Board the Space Shuttle. J Clin Immunol. 2012
7. Crucian BE, Cubbage ML, Sams CF. Altered cytokine production by specific human peripheral blood cell subsets immediately following space flight. J Interferon Cytokine Res. 2000;20(6):547-556
8. Borchers AT, Keen CL, Gershwin ME. Microgravity and immune responsiveness: implications for space travel. Nutrition. 2002;18(10):889-898
9. Brugarolas J, Chandrasekaran C, Gordon JI, Beach D, Jacks T, Hannon GJ. Radiation-induced cell cycle arrest compromised by p21 deficiency. Nature. 1995;377(6549):552-557
10. Hashemi BB, Penkala JE, Vens C, Huls H, Cubbage M, Sams CF. T cell activation responses are differentially regulated during clinorotation and in spaceflight. FASEB J. 1999;13(14):2071-2082
11. Gould CL, Lyte M, Williams J, Mandel AD, Sonnenfeld G. Inhibited interferon-gamma but normal interleukin-3 production from rats flown on the space shuttle. Aviat Space Environ Med. 1987;58(10):983-986
12. Simons DM, Gardner EM, Lelkes PI. Sub-mitogenic phorbol myristate acetate co-stimulation rescues the PHA-induced activation of both naive and memory T cells cultured in the rotating-wall vessel bioreactor. Cell Biol Int. 2009;33(8):882-886
13. Sun Z, Zhao L, Wang H, Sun L, Yi H, Zhao Y. Presence of functional mouse regulatory CD4+CD25+T cells in xenogeneic neonatal porcine thymus-grafted athymic mice. Am J Transplant. 2006;6(12):2841-2850
14. Simons DM, Gardner EM, Lelkes PI. Dynamic culture in a rotating-wall vessel bioreactor differentially inhibits murine T-lymphocyte activation by mitogenic stimuli upon return to static conditions in a time-dependent manner. J Appl Physiol. 2006;100(4):1287-1292
15. Parish CR, Glidden MH, Quah BJ, Warren HS. Use of the intracellular fluorescent dye CFSE to monitor lymphocyte migration and proliferation. Curr Protoc Immunol. 2009 Chapter 4:Unit4 9
16. Wang H, Zhao L, Sun Z, Sun L, Zhang B, Zhao Y. A potential side effect of cyclosporin A: inhibition of CD4(+)CD25(+) regulatory T cells in mice. Transplantation. 2006;82(11):1484-1492
17. Zhang L, Zhang H, Li L. et al. TSC1/2 signaling complex is essential for peripheral naive CD8+ T cell survival and homeostasis in mice. PLoS One. 2012;7(2):e30592
18. Klaus DM. Clinostats and bioreactors. Gravit Space Biol Bull. 2001;14(2):55-64
19. Unsworth BR, Lelkes PI. Growing tissues in microgravity. Nat Med. 1998;4(8):901-907
20. Gerdes J, Lemke H, Baisch H, Wacker HH, Schwab U, Stein H. Cell cycle analysis of a cell proliferation-associated human nuclear antigen defined by the monoclonal antibody Ki-67. J Immunol. 1984;133(4):1710-1715
21. Boyman O, Sprent J. The role of interleukin-2 during homeostasis and activation of the immune system. Nat Rev Immunol. 2012;12(3):180-190
22. Crabtree GR. Contingent genetic regulatory events in T lymphocyte activation. Science. 1989;243(4889):355-361
23. Oliveira JB. Evaluation of IL-2-Withdrawal-Induced Apoptosis in Human T Lymphocytes. Methods Mol Biol. 2013;979:25-31
24. Golstein P. Cell death in us and others. Science. 1998;281(5381):1283
25. Takahashi T, Tanaka M, Brannan CI. et al. Generalized lymphoproliferative disease in mice, caused by a point mutation in the Fas ligand. Cell. 1994;76(6):969-976
26. Huang Z, Wang R, Xie H, Shang W, Manicassamy S, Sun Z. Stabilized beta-catenin potentiates Fas-mediated T cell apoptosis. J Immunol. 2008;180(10):6586-6592
27. Thiel CS, Paulsen K, Bradacs G. et al. Rapid alterations of cell cycle control proteins in human T lymphocytes in microgravity. Cell Commun Signal. 2012;10(1):1
28. Janeway CA Jr. The T cell receptor as a multicomponent signalling machine: CD4/CD8 coreceptors and CD45 in T cell activation. Annu Rev Immunol. 1992;10:645-674
29. Konstantinov SM, Mindova MM, Gospodinov PT, Genova PI. Three-dimensional bioreactor cultures: a useful dynamic model for the study of cellular interactions. Ann N Y Acad Sci. 2004;1030:103-115
30. Reddy M, Eirikis E, Davis C, Davis HM, Prabhakar U. Comparative analysis of lymphocyte activation marker expression and cytokine secretion profile in stimulated human peripheral blood mononuclear cell cultures: an in vitro model to monitor cellular immune function. J Immunol Methods. 2004;293(1-2):127-142
31. Cooper D, Pellis NR. Suppressed PHA activation of T lymphocytes in simulated microgravity is restored by direct activation of protein kinase C. J Leukoc Biol. 1998;63(5):550-562
32. Testi R, D'Ambrosio D, De Maria R, Santoni A. The CD69 receptor: a multipurpose cell-surface trigger for hematopoietic cells. Immunol Today. 1994;15(10):479-483
33. Risso A, Smilovich D, Capra MC. et al. CD69 in resting and activated T lymphocytes. Its association with a GTP binding protein and biochemical requirements for its expression. J Immunol. 1991;146(12):4105-4114
34. Sancho D, Gomez M, Sanchez-Madrid F. CD69 is an immunoregulatory molecule induced following activation. Trends Immunol. 2005;26(3):136-140
35. Licato LL, Grimm EA. Multiple interleukin-2 signaling pathways differentially regulated by microgravity. Immunopharmacology. 1999;44(3):273-279
36. Batista A, Millan J, Mittelbrunn M, Sanchez-Madrid F, Alonso MA. Recruitment of transferrin receptor to immunological synapse in response to TCR engagement. J Immunol. 2004;172(11):6709-6714
37. Artac H, Coskun M, Karadogan I, Yegin O, Yesilipek A. Transferrin receptor in proliferation of T lymphocytes in infants with iron deficiency. Int J Lab Hematol. 2007;29(4):310-315
38. Kenneth NS, Mudie S, Naron S, Rocha S. TfR1 interacts with the IKK complex and is involved in IKK-NF-kappaB signalling. Biochem J. 2013;449(1):275-284
39. Boonyaratanakornkit JB, Cogoli A, Li CF. et al. Key gravity-sensitive signaling pathways drive T cell activation. FASEB J. 2005;19(14):2020-2022
40. Chang TT, Walther I, Li CF. et al. The Rel/NF-kappaB pathway and transcription of immediate early genes in T cell activation are inhibited by microgravity. J Leukoc Biol. 2012;92(6):1133-1145
41. Lasserre R, Alcover A. Cytoskeletal cross-talk in the control of T cell antigen receptor signaling. FEBS Lett. 2010;584(24):4845-4850
42. Fooksman DR, Vardhana S, Vasiliver-Shamis G. et al. Functional anatomy of T cell activation and synapse formation. Annu Rev Immunol. 2010;28:79-105
43. Zhong L, Zeng G, Lu X. et al. NSOM/QD-based direct visualization of CD3-induced and CD28-enhanced nanospatial coclustering of TCR and coreceptor in nanodomains in T cell activation. PLoS One. 2009;4(6):e5945
44. Zhong L, Zhang Z, Lu X. et al. NSOM/QD-based fluorescence-topographic image fusion directly reveals nano-spatial peak-valley polarities of CD69 and CD71 activation molecules on cell-membrane fluctuations during T-cell activation. Immunol Lett. 2011;140(1-2):44-51
Author contact
![]() Corresponding author: Dr. Yong Zhao, Transplantation Biology Research Division, State Key Laboratory of Biomembrane and Membrane Biotechnology, Institute of Zoology, Chinese Academy of Sciences, Beichen West Road 1-5, Chaoyang District, Beijing, China 100101. Phone: (86) 10-64807302; Fax: (86) 10-64807313; E-mail: zhaoyac.cn
Corresponding author: Dr. Yong Zhao, Transplantation Biology Research Division, State Key Laboratory of Biomembrane and Membrane Biotechnology, Institute of Zoology, Chinese Academy of Sciences, Beichen West Road 1-5, Chaoyang District, Beijing, China 100101. Phone: (86) 10-64807302; Fax: (86) 10-64807313; E-mail: zhaoyac.cn