Impact Factor ISSN: 1449-1907
- Issue 8; 2026
- Issue 7; 2026
- Issue 6; 2026
- Issue 5; 2026
- Issue 4; 2026
- Volume 23; 2026
- Past Issues
- Editorial Board
- Cover Images
- Index & Coverage
- Cover Suggestion
- Special Issues
Introduction
Materials and Methods
Results
Discussion
Conclusions
Abbreviations
Acknowledgements
References

 Global reach, higher impact
Int J Med Sci 2014; 11(1):24-33. doi:10.7150/ijms.7244 This issue Cite
Research Paper
Differential Protein Expression between Chondrogenic Differentiated MSCs, Undifferentiated MSCs and Adult Chondroctyes Derived from Oryctolagus cuniculus in vitro
Liang-Xin Tay1, Chin-Keong Lim2, Azura Mansor1, Tunku Kamarul1,3 ![]()
1. Tissue Engineering Group (TEG), National Orthopaedic Center of Excellence for Research and Learning (NOCERAL), Department of Orthopaedic Surgery, Faculty of Medicine, University of Malaya,50603 Kuala Lumpur, Malaysia
2. Centre of Studies for Preclinical Sciences, Faculty of Dentistry, Universiti Teknologi Mara, 40450 Shah Alam, Malaysia
3. Clinical Investigative Centre (CIC), University Malaya Medical Centre, Kuala Lumpur, Malaysia
Received 2013-7-24; Accepted 2013-11-25; Published 2013-12-11
Abstract
Objective: This preliminary study aims to determine the differentially expressed proteins from chondrogenic differentiated multipotent stromal cells (cMSCs) in comparison to undifferentiated multipotent stromal cells (MSCs) and adult chondrocytes (ACs).
Methods: ACs and bone marrow-derived MSCs were harvested from New Zealand White rabbits (n = 3). ACs and cMSCs were embedded in alginate and were cultured using a defined chondrogenic medium containing transforming growth factor-beta 3 (TGF-β3). Chondrogenic expression was determined using type-II collagen, Safranin-O staining and glycosaminoglycan analyses. Two-dimensional gel electrophoresis (2-DE) was used to isolate proteins from MSCs, cMSCs and ACs before being identified using liquid chromatography-mass spectrometry (LC-MS). The differentially expressed proteins were then analyzed using image analysis software.
Results: Both cMSCs and ACs were positively stained with type-II collagen and safranin-O. The expression of glycosaminoglycan in cMSCs was comparable to AC at which the highest level was observed at day-21 (p>0.05). Six protein spots were found to be most differentially expressed between MSCs, cMSCs and ACs. The protein spots cofilin-1 (CFL1) and glycealdehyde-3-phosphate dehydrogenase (GAPD) from cMSCs had expression levels similar to that of ACs whereas the others (ie. MYL6B, ALDOA, TAGLN2, EF1-alpha), did not match the expression level of ACs.
Conclusion: Despite having similar phenotypic expressions to ACs, cMSCs expressed proteins which were not typically expected. This may explain the reason for the unexplained lack of improvement in cartilage repair outcomes reported in previous studies.
Keywords: 2D gel electrophoresis, Chondrocytes, Chondrogenic multipotent stromal cells, Chondrogenesis, LC-MS, Multipotent mesenchymal stem cells, Protein expression, orthopaedics
Introduction
In vivo and in vitro cell-mediated cartilage regeneration has been extensively studied in both human and animal models. It has been demonstrated that when articular cartilage defects regenerate, they form mainly fibro-cartilaginous tissue, which has inferior biochemical and biomechanical properties as compared to hyaline cartilage [1]. It has been mentioned that the development of fibrocartilage tissue can be attenuated if the appropriate cartilage proteins are expressed. It is therefore believed that further improvement to the cartilage repair outcomes can be achieved by ensuring that the appropriate proteins, which may also involve the proteins predominantly found in hyaline matrix, are expressed within the repaired cartilage site. One way to ensure that this is achieved is through the implantation of cells that have the ability to express the typical proteins required to obtain optimal tissue repair. The effect of implanting these cells has been observed in many studies and is presently being used as acceptable therapies in many countries [2]. In most studies, the use of autologous chondrocyte is common [3]. However, the use of these cells appears to only provide good medium-term outcomes attributed to the ageing transplanted cells, which is expected of any adult somatic cells [1].
Multipotent stromal cells (MSCs) are regarded as a promising and potential alternative cell source in the repair of cartilage due to its multi-lineage differentiation ability in vitro. Although MSCs possess strong intrinsic chondrogenic capacity, implantation of undifferentiated MSCs in constructs using various sources has also resulted in the formation of fibrous tissues, increased expression of type-I collagen and the loss of sulphated glycosaminoglycan (sGAG) content [4]. Furthermore, bone marrow MSCs showed an increased propensity to express type-X collagen which correlates with mineralization of the tissue at the implanted site [4]. It has therefore been postulated that the use of pre-differentiated chondrogenic MSCs in vitro would have the ability to express specific cartilage related proteins, which can lead to early if not better cartilage healing. However, in our previous pre-clinical study, we were not able to demonstrate the superiority of cMSCs over MSCs [5].
The reason for our previous finding remains unexplained. Although cMSCs may produce expressions that are closely similar to adult chondrocytes (AC), within the mixture of proteins expressed there may be alterations or deviations in the protein expression patterns, which lead to the limitations in the final outcome observed previously. When attempts were made to determine if such phenomenon may be the case, it is found that previous studies were mainly confined to determining the differential protein expression of pre- and post-chondrogenic induction of MSCs. Furthermore, reports comparing cMSCs to ACs appear lacking [6-8]. Considering that the understanding of such findings holds great importance for the development of future therapies, this proteomic study was therefore conducted to compare the global protein expression of cMSCs to that of ACs and MSCs.
Materials and Methods
Cell and tissue Culture
This study was approved by the University of Malaya animal ethics committee [OS/05/07/2006/TKZ/A(R) and OS/02/06/2008/TKZ(a)(R)]. Primary ACs and bone marrow MSCs were collected separately from three male New Zealand white rabbits (age: 3 months old; weight: 2.0 ± 0.5 kg). Animals were sacrificed by overdosing animals with CO2 gas prior to sample harvesting.
ACs were aseptically isolated from cartilage tissues as described by Ab-Rahim et. al. (2008)[9]. The specimens were finely minced using surgical blade before being digested in 0.6% type-II collagenase (Worthington Biochemical Corporation, Lakewood, NJ, USA) at 37°C for 14 hours. This was followed by a centrifugation at 500 g for 10 minutes before the cell pellet was being seeded at 100,000 cell/cm2 in DMEM/Ham's F-12 Nutrient Mixture (1:1) supplemented with 10% fetal bovine serum (FBS), 0.0025% ascorbic acid and 1% penicillin-streptomycin (PS) (Gibco, USA). The cells were then incubated at 37°C in a humidified atmosphere containing 5% CO2. After 14 days, the cultured cells were used at passage 2 for cell differentiation assay.
MSCs were cultured as described by Boo et. al. (2011)[10]. Briefly, 2 mL of bone marrow was diluted with Phosphate buffered saline (PBS) solution (1:2) before being loaded onto 3 mL Ficoll-paque (GE Healthcare-Amersham Biosciences, Piscataway, NJ). Mononuclear cells were then harvested from the interface of plasma and Ficoll-paque after being centrifuged at 500g for 25 minutes. The cells were cultured for 14 days in DMEM containing 10% FBS and 1% PS at 37°C in a humidified incubator containing 5% CO2...
Characterization of ACs and MSCs
AC cultures were characterized using monoclonal anti-collagen Type-II (Calbiochem, Merck Millipore, MA, USA); monoclonal anti-collagen Type-I Rabbit (Calbiochem, Merck Millipore, MA, USA) and histological staining of Safranin-O (Sigma-Aldrich Co, USA). MSC cultures were identified through immuno-cytochemistry analysis by determining the surface CD markers: CD29 (Chemicon, Merck Millipore, MA, USA); CD44 (GeneTex, Irvine, CA, USA) and CD45 (GeneTex, Irvine, CA, USA).MSC were induced into adipogenic and osteogenic lineage using STEMPRO® adipogenesis and osteogenesis differentiation kits (Gibco), respectively. The cultures were then stained with oil red O (adipogenic cultures) and Alizarin Red S (osteogenic cultures) after 14 days.
Chondrogenic differentiation of MSC and AC in Alginate three-dimensional (3D) culture
MSC- and AC-alginate beads were prepared using a 1.2% low viscosity alginate solution (Sigma-Aldrich) mixed in 0.15M sodium chloride as previously described [11]. MSC and AC-alginate beads were then formed in a 102 mM calcium chloride solution at a density of 4 × 10⁶ cells/mL. Alginate beads were then washed with 0.15M sodium chloride. Ten cell-alginate constructs were transferred to each well of a 6-well culture plate (Corning, USA) before being cultured in chondrogenic defined medium (Lonza, Walkersville, MD USA) containing 10 ng/mL TGF-β3 (Lonza, USA). MSC and AC-alginate cultures were maintained at 37oC in a humidified environment containing 5% CO2 for 21 days.
Histology and immunohistochemistry
This experiment was performed according to the instructions described in DAKO Cytomation EnVision + System HRP kit (DAKO, Denmark). MSC- and AC-alginate beads were fixed in 10% paraformaldehyde for 20 minutes, followed by serial dehydrations (70% ethanol for 15 minutes, 95% ethanol for 30 minutes, 100% ethanol for 30 minutes) and xylene (20 minutes). Samples were embedded in paraffin, sectioned (5-μm thickness) and stained with monoclonal anti-collagen type-II (Calbiochem, Merck Millipore, MA, USA) and Safranin-O.
Glycosaminoglycan (GAG) analysis
GAG content of the culture supernatant of MSC, cMSC and AC groups was performed using Blyscan glycosaminoglycan assay kit (Biocolor Ltd, Co Antrim, UK). Briefly, the aliquot of each sample was mixed with DMMB dye and reagents (Biocolor) according to the manufacturer's instructions. The absorbance was measured at 656 nm using nanophotometer (Implen, München, Germany). Values from GAG analysis were normalized to the protein content (ng GAG/μg protein).
Protein extraction of MSC- and AC-alginate beads
Alginate constructs were solubilized in 55mM sodium citrate solution (Sigma-Aldrich) as described previously [11]. The dissolved alginate beads were centrifuged at 300 g for 10 minutes. The MSC and ACs were then lysed in 2-D Protein Extraction Buffer (GE Healthcare, USA) containing urea and NP-40 and protease inhibitors (Roche Diagnostics GmbH, Germany) for 1 hour using shaker at room temperature. Cell lysate was centrifuged at 15000 g for 10 minutes at 4°C. Protein concentration was quantified using BCA Protein Assay Kit (Pierce, Thermo Scientific, Rockfold, IL USA).
Isoelectric focusing (IEF) and Two-dimensional Gel Electrophoresis (2-DE)
Prior to IEF, cell lysate was precipitated in acetone. Immobiline DryStrips (24cm, pH 3-10, GE Healthcare-Amersham Biosciences, NJ) were rehydrated with 100 μg of protein, in 450 μL of solubilization solution. IEF was conducted using the IPGphor IEF System (GE Healthcare, USA) via rehydration for 18 hours at room temperature, 1 hour at 500 V, 1 hour at 1000 V and 8 hours at 8000 V, resulting in a total of 75 000 V hour. The gel strips were equilibrated in two steps of 15 minutes each with gentle agitation. The first equilibration solution contained 1% DTT. In the second equilibration solution, the DTT was replaced with 1.5% iodoacetamide. After equilibration, the IPG strips were rinsed gently with ddH2O, followed by a blotting to remove excess equilibration buffer. The IPG strips were then transferred onto 12.5% SDS-PAGE gels before being overlaid with 0.5% agarose. 2-D SDS-PAGE was conducted at 100 V for 1 hour and 400 V for 7 hours using the Ettan DALT twelve system (GE Healthcare, USA). The proteins were stained using a silver-staining method as described by Chevallet et. al. (2006)[12].
Silver-stained gels were scanned using UMAX Powerlook 1120USG image scanner (GE Healthcare, USA) at a resolution of 300 dpi. Spot detection, quantification and matching were performed using Progenesis SameSpots software according to the manufacturer's instructions (Nonlinear Inc., NC, USA). Three individual gel replicates from each group were used in the analysis.
Protein Identification using Liquid Chromatography MS/MS (LC-MS/MS)
Identification of protein spots were performed through liquid chromatography mass spectrometry. Protein samples were extracted according to the standard techniques described previously [13]. The peptides were analysed using electrospray ionisation mass spectrometry (Dionex, Thermoscientific, CA, USA) coupled to a 4000 QTRAP mass spectrometer (Applied Biosystems). The peptides were loaded onto a C18 PepMap100, 3 μm (LC Packings, Dionex, Thermoscientific, CA, USA) before being separated by a linear gradient of water/acetonitrile/0.1% formic acid (v/v).
Database Search
The amino acid sequence tags obtained from each peptide fragmentation in LC-MS analyses were used to search for protein candidates using Mascot online sequence matching software (Matrix Science, London, UK; www.matrixscience.com). The searches for peptide mass fingerprints were performed against rodent taxonomy in the LudwigNR database (305,368 entries; last updated on 20 September 2012). Variable modifications included were oxidation of methionine, allowing up to one missed cleavage site. The search parameters are as follows: peptide tolerance ± 1.2 Da; MS/MS tolerance ± 0.6 Da; peptide charge +1, +2 or +3; monoisotopic mass value. Identification was accepted as positive when a minimum of two matching peptides and more than 10% of the peptide coverage sequences have matched. Probability scores were significant at p<0.05 for all matches.
Statistical Analyses
Statistical analyses were performed using Statistical package for the social sciences (SPSS) software (version 17.0, SPSS Inc, Chicago, USA). The values of sGAG concentrations were presented as mean ± SD. Comparisons of variables between the two groups were analyzed using parametric independent pair-wise student t-test. Differences were considered statistically significant at p<0.05. 2-DE gels were analyzed using Progenesis SameSpots software version 4.4 (Nonlinear Inc., NC, USA). Differentially expressed proteins were documented as mean of normalized log volume ± standard error (SE). Parametric statistical analysis using ANOVA test was also performed to determine the statistical significance of the results. Statistically significant differences were regarded at p<0.01. The power of current study was 88.5% calculated using Progenesis SameSpots software.
In order to avoid false positive discovery, all the six differentially expressed protein spots (p<0.01) were further subjected to false discovery rate test before being confirmed by q-value <0.01.
Results
Morphological observation and Immunophenotyping of MSCs and ACs
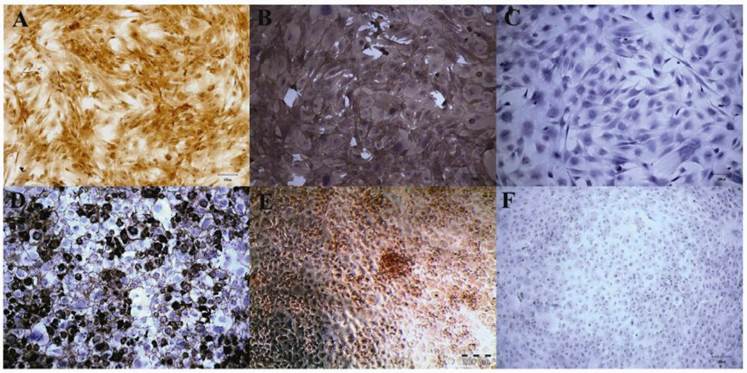
Bone marrow MSCs appeared as fibroblastic and spindle-shaped (Figure 1A). The cultured MSCs were positive for the presence of surface markers CD44 and CD29 but not CD45 (Figure 1A, B, C). However, the ACs exhibited an amoeboid and squamous-shaped cells in the monolayer culture (Figure 1D) with only type-II collagen and proteoglycan expression (Figure 1D, E, F). MSCs and ACs displayed spherical-shaped morphology in 3D culture. Upon reaching 21 days of culture in chondrogenic medium, MSC and AC-alginate beads expressed proteoglycan and type-II collagen as observed from the histological analysis.
Immunophenotyping of MSCs and ACs. MSCs expressed cell surface markers CD29 (1A) and CD44 (1B). CD45 was absent in MSCs (C). AC showed the expression of ECM: type-II collagen (1D) and proteoglycan (1E) secretions. Type-I collagen was absence in the AC monolayer culture (1F). (Magnification: 100X in 1A, B, C, D and F; 200X in 1E).
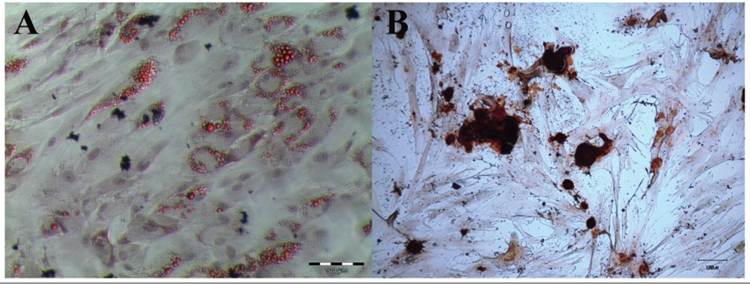
MSCs cultured in adipogenic medium for 14 days have developed intracellular lipid droplets, identified by Oil Red O analysis (Figure 2A). After 14 days in osteogenic culture medium, the MSCs have secreted a mineralized matrix, which was characterized by Alizarin Red staining (Figure 2B).
Histochemical analyses of adipogenic and osteogenic capacities of MSCs. MSCs were cultured in (2A) adipogenic medium and (2B) osteogenic medium for 14 days. The cultures were stained with Oil Red O for validation of intracellular lipid (2A; magnification 100X) and with Alizarin Red S for mineralized matrix (2B; magnification 100X).
Histology and Immunohistochemical staining of cell-constructs
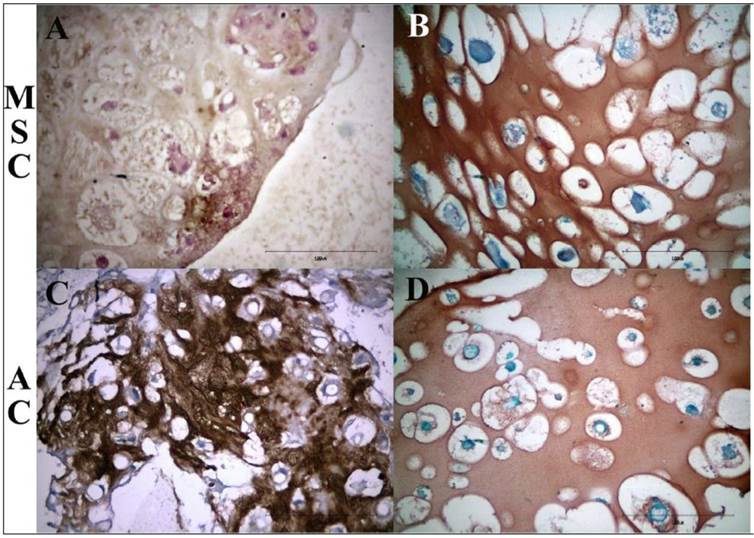
Chondrogenic MSC-alginate beads (Figure 3A, B) and AC-alginate construct (Figure 3C, D) expressed type-II collagen (Figure 3A, C) and proteoglycan (Figure 3B, D).
Representative histological appearance of chondrogenic culture. MSC (3A and 3B) and AC-alginate constructs (3C and 3D) were stained with type-II collagen (3A and 3C) and safranin O (3B and 3D) at day-21. ECM of both MSC-alginate and AC-pellet constructs were present with type-II collagen (3A and 3C; magnification 400X) and proteoglycan (3B and 3D; magnification 400X).
Biochemical GAG assay
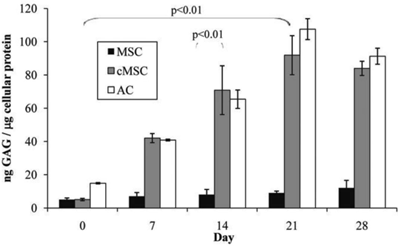
Secretion of GAG by cMSC cultures was significantly elevated from day-0 with the highest level observed at day-21 (p<0.01), which is about ten times more than day-0 (Figure 4). However, the deposition of GAG declined at day-28 (83.94 ± 4.83 ng GAG/μg/mL protein). No significant difference was found between the GAG amount at day-21 and day-28 (p>0.05). In general, ACs secreted GAG at a slower pace than cMSCs. However, AC doubled its GAG secretion at day-14 (65.42 ± 0.57 ng GAG/μg/mL protein) as compared to day-0 (14.85 ± 0.38 ng GAG/μg/mL protein), and the highest being observed at day-21(107.55 ± 6.28 ng GAG/μg/mL protein). At day-28, GAG secretion by ACs declined to 91.25 ± 4.82 ng GAG/μg/mL protein. In addition, secreted GAG from cMSC and ACs did not differ between day-21 and day-28 (p>0.05).
GAG secretion of MSC, cMSC and AC culture from day-0 to day-28 were compared to their respective control using parametric 2-sided independent t-test. GAG secretion in both cMSC and AC was significantly higher than MSC (p<0.01). GAG secretion of cMSC was significantly enhanced at day-21 compared to day-0 (p<0.01).
Principal component analysis
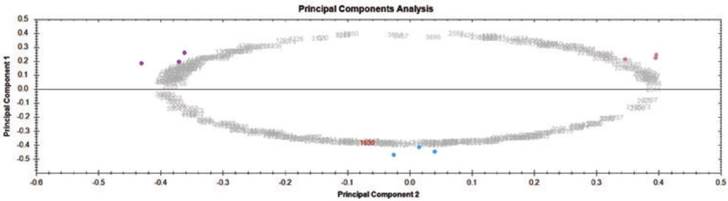
Principal components analysis was used to determine the homogeneity in the protein profiles of MSC, cMSC and AC. Proteomic maps were utilized as “score graphs” for variables and spots from the different groups. Figure 5 shows that MSC spots (magenta) were close to each other and were situated on one side of the graph, while AC spots (violet) were clustered on the opposite side. Spots corresponding to the cMSC were situated and clustered between these positions. These results indicate that our data were homogenous with no outlier data affecting the statistical analysis.
Principal component analysis of 2-DE gel electrophoresis data. Scores graphs combining proteomic maps (variables) and spots from different groups (observations) were constructed. Principal components analysis clustered the nine silver-stained expression maps into three different groups. Principal component 1 was 48.37% from the modulated proteins and principal component 2 was 42.84% from the modulated proteins. Color dots represent sample group: MSC (magenta), cMSC (blue) and AC (violet).
Proteome Changes in chondrogenic induced MSCs
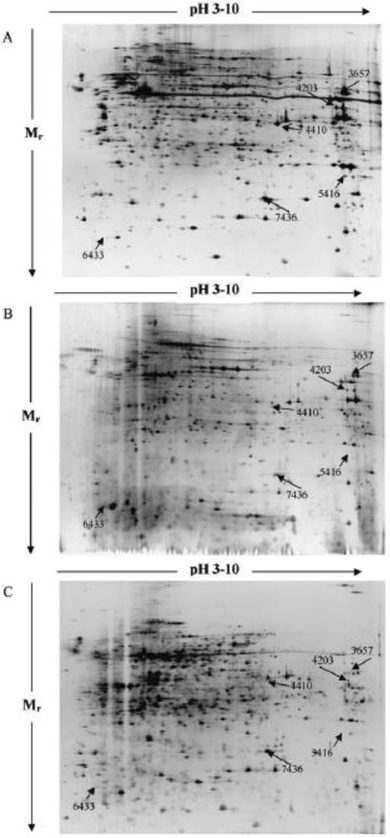
About 1050 spots were detected using 2-DE analyses (p<0.01). From the 1050 spots, 146 protein spots were classified as differentially expressed based on the computer-assisted 2-DE gel differential analysis. Of these, six highly modulated proteins were excised from the preparative gels for mass spectrometry (MS) analysis. The positions and the densitometry analysis of the six protein spots were labelled on the 2-DE gels (Figure 6) and data obtained presented in Table 1.
Typical 2-DE protein profile of (A) MSC, (B) AC, and (C) cMSC. 100 μg of protein cell lysate were conducted on 24 cm IPG strip (pH 3-10) and 12.5% SDS-PAGE. 2-DE gels were visualized via silver staining. The differentially expressed proteins studied are depicted on the gels. Gels were stained with silver nitrate and image analysis was performed using Nonlinear Progenesis SameSpot software.
Densitometry assessment of identified differentially expressed protein spots.
| Spot No. | Log Normalized Spot Volume Contribution (Mean ± SE) | ||
|---|---|---|---|
| MSC | cMSC | AC | |
| 7436 | 7.89 ± 0.09 | 7.68 ± 0.16 | 7.50 ± 0.26 |
| 6433 | 6.99 ± 0.13 | 7.51 ± 0.36 | 8.08 ± 0.12 |
| 4410 | 6.12 ± 0.18 | 6.61 ± 0.39 | 6.94 ± 0.37 |
| 3657 | 7.58 ± 0.09 | 7.13 ± 0.08 | 7.33 ± 0.05 |
| 5416 | 7.56 ± 0.20 | 6.86 ± 0.28 | 7.39 ± 0.12 |
| 4203 | 7.60 ± 0.08 | 6.87 ± 0.31 | 7.42 ± 0.14 |
Experiments were repeated at least three times (n=3) under identical conditions and using cells from different animals (N=3).
Protein Identification by LC-MS Analysis
The identified proteins were classified into four groups, namely cytoskeleton related protein (CFL1 and MYL6B), metabolic enzymes (GAPD and ALDOA), cell proliferation (TAGLN2) and protein biosynthesis (EF1-ALPHA) as annotated in Table 2.
Differentially expressed proteins identified by LC-MS.
| Spot No. (a) | Gene Name | Protein Name | Mascot Score (b) | Swiss Prot. accession no. (c) | Mr (d) | pI (e) | Sequence Coverage (%) (f) | Peptide Matches (g) | Cellular Function (h) |
|---|---|---|---|---|---|---|---|---|---|
| 7436 | CFL1 | Cofilin-1 (Fr) | 59 | H0VBH0 | 18521 | 8.22 | 15 | 2 | Cytoskeleton related protein |
| 6433 | MYL6B | Myosin light chain 6B | 77 | G3HRQ5 | 22778 | 5.40 | 11 | 6 | |
| 5416 | TAGL N2 | Transgelin-2 isoform (Fr) | 79 | H0W7H0 | 22441 | 8.60 | 13 | 3 | |
| 4410 | GAPD | Glyceraldehyde-3-phosphate dehydrogenase (Fr) | 57 | Q8K417 | 30811 | 8.57 | 28 | 15 | Metabolic enzymes |
| 3657 | ALDOA | Fructose-biphosphate aldolase | 83 | H0VA39 | 39382 | 8.30 | 15 | 4 | |
| 4203 | EF1-ALPHA | Elongation factor 1-alpha | 87 | H0V2B3 | 50109 | 9.10 | 11 | 8 | Protein biosynthesis |
(a) Spot numbers referred to the numbers shown in Figure 6; (b) MASCOT score; (c) accession number on the SwissProt database; (d) Mr referred to theoretical molecular mass; (e) pI referred to theoretical Isoelectric point of the protein; (f) sequence coverage (%) meant sequence coverage in percentage searched by MASCOT; (g) peptide matches referred to the number of matched peptides searched for by MASCOT; (h) cellular functions based on literature database. Fr meant protein fragment based on UniProtKB database.
Protein Expression between Cell Types
Differences in the protein expression of the six protein spots were subsequently evaluated in fold change between three groups (Table 3). For MSC and AC groups, all proteins except TAGLN2 were differentially expressed (p<0.01). CFL1, ALDOA, TAGLN2 and EF1-ALPHA were up-regulated in MSC while MYL6B and GAPD were highly expressed in AC. The expression of MYL6B and GAPD were higher in cMSC than MSC (p<0.01), whereas the remaining proteins (i.e CFL1, ALDOA, TAGLN2 and EF1-ALPHA) were higher in MSCs than cMSCs (p<0.01). All proteins except GAPD were differentially expressed between cMSC and AC (p<0.01). However, only CFL1 was more highly expressed in cMSC than the rest of the proteins (i.e MYL6B, GAPD, ALDOA, TAGLN2 and EF1-ALPHA).
Comparison of protein expression fold change and ANOVA p-value between two cell groups. MSC vs AC; cMSC vs MSC and cMSC vs AC.
| Spot No. | MSC vs AC | cMSC vs MSC | cMSC vs AC | |||
|---|---|---|---|---|---|---|
| Fold Change | ANOVA (p) | Fold Change | ANOVA (p) | Fold Change | ANOVA (p) | |
| CFL1 | +2.6 | 0.003 | -2.0 | 0.001 | +1.3 | 0.307 |
| MYL6B | -7.3 | 0.001 | +2.8 | 0.001 | -2.6 | 0.001 |
| GAPD | -6.9 | 0.001 | +3.3 | 0.004 | -2.1 | 0.115 |
| ALDOA | +1.8 | 0.001 | -2.8 | 0.001 | -1.6 | 0.001 |
| TAGLN2 | +1.6 | 0.105 | -5.1 | 0.001 | -3.3 | 0.001 |
| EF1-ALPHA | +1.5 | 0.004 | -5.0 | 0.001 | -3.3 | 0.003 |
p-values of less than 0.01 (p<0.01) were considered significant.
Discussion
In this preliminary study, primary MSCs and ACs demonstrated significant differences in their protein profiles. Whilst it can be assumed that similar profiles to that of ACs should be expressed by chondrogenic MSCs, this was not observed in our present study, suggesting that cMSCs may not function exactly the same way to native ACs. This has become the premise in which based on the differentially expressed protein profile, we hypothesize that cMSCs do not perform as expected in vivo [5]. There were six most differentially expressed proteins observed in between the ACs, MSCs and cMSCs. However, of these, only MYL6B, ALDOA, TAGLN2 and EF1-ALPHA were not highly modulated in cMSCs as compared to ACs. Further analyses of the data gained in this study revealed that these differentially expressed proteins from cMSCs were related to cytoskeletal, metabolic enzymes, and biosynthesis proteins, which may have contributed to the ineffectiveness of these differentiated cells in cartilage repair.
In general, the actin cytoskeleton regulation of stem cell is essential for chondrogenesis [14] where TGF-β rapidly activates PI3K/Akt pathway towards the reorganization of actin filament and cell migration [15]. However, this study demonstrates that cofilin-1 (CFL1), myosin light chain (MLC6B) and transgelin-2 (TAGLN2) were highly modulated in MSC towards chondrogenic lineage in vitro. CFL1 enhances the rate of dissociation of actin microfilaments, which in turn affects the mechanical properties and extracellular matrix assembly of the cells [16, 17]. In contrary to CFL1, the expression level of MYL6B appears to be increasing in an ascending order from MSCs, cMSCs to ACs. In this study, cMSCs and ACs may have indicated the occurrence of cell contraction during the remodelling of collagen-GAG extracellular matrix (ECM) and acto-myosin fibril [18, 19]. TGF-β has been reported to inhibit cofilin through non-Smad signalling pathways by activating Rho GTPases, ROCK and Limk2, thus shifting towards actin polymerization [20, 21]. Our findings indicate that the complex interactions of ECM molecules may modulate cell-ECM attachment, resulting in initiation of chondrogenesis and maintenance of the chondrogenic phenotype [22]. Although hydrogel contraction could be beneficial for the production of cartilaginous constructs using MSCs, it is postulated that the transgelin associated cell-seeded scaffolds contraction might possibly affect cell migration and proliferation, hence resulting in poorly functional chondrocytes. In this study, TAGLN2 was significantly down-regulated in cMSC (p<0.01). Absence of TAGLN2 has shown to increase the activity of Rho GTPase [23] that phosphorylates MYL6B and induces formation of stress fibres [24, 25]. The underlying mechanism behind the association of TAGLN2 down-regulation in cMSCs compared to the AC is unclear, therefore further comparative analysis may be required in order to provide further insights to the role of TAGLN2 in chondrogenesis.
Activity of GAPD in cMSC and ACs has increased three folds as compared to MSCs. Rocha et. al. (2012) reported similar outcome of which the cytoskeleton-related and metabolic-related protein were upregulated [26]. Increased expression of GAPD is associated with the synthesis and deposition of ECM molecules [27]. Cartilage ECM proteoglycans formation is preceded by markedly increased activity of uridinediphosphoglucose dehydrogenase (UDPGD), which is directly associated with GAG synthesis, glucose-6-phosphate dehydrogenase, GAPD and succinate dehydrogenase [28]. In this study, ALDOA expression was lower in cMSCs than both the MSCs and ACs. ALDOA is a glycolytic enzyme for energy generation in chondrocytes, particularly marked at cell maturity [27]. Reduction of energy modulated by ALDOA may limit the ability of ACs to restore GAG matrices [28]. Recently, both GAPD and ALDOA have been found to interact with S100A1 and S100B proteins that suppress hypertrophic differentiation and mineralization of chondrogenic cells [29].
Elongation factor 1-alpha (EF1-alpha), a GTP-binding protein plays a central role in protein biosynthesis. In this study, this factor was found significantly down-regulated in cMSC (p<0.01). EF1-alpha is a key regulator of various physiological processes, such as aging, proliferation, apoptosis, protein degradation and cytoskeletal rearrangement [30]. Phosphorylated EF1-alpha by type-I TGFβ receptor kinase at Serine 300 exerted a direct inhibitory on protein synthesis, therefore reducing cell proliferation [31]. Detailed molecular mechanism of this pathway remains unexplored. It was suggested that phosphorylated EF1-alpha represents a mechanism by which cell cycle is inhibited as a relative fast response to TGF-β [31]. EF1-alpha also interacts with the cytoskeleton by binding and bundling with actin filaments and microtubules [32, 33]. In this context, EF1-alpha functions in regulating the transport, anchorage and translation of mRNA on actin filaments that may be important in ACs [33].
It needs to be reminded that although the present study has demonstrated some interesting results, certain limitations needs to be understood in order not to overstate the findings of the present study. In a study using animal as a reference of protein differences, it is worth noting that several protein differences may exist in other species, especially in human. It has been previously demonstrated that cartilage gene expressions and characteristics are species specific, and therefore may vary among the different species [34, 35]. This is important when having to translate the findings clinically. Nevertheless, healthy human donor matched MSCs and ACs samples under a well-controlled environment are not usually available and therefore not feasible to be used in any laboratory study. However, in comparison to what is available today, the present study has its positive points as most studies of similar nature are limited to immortalized cell line such as C3H10T1/2, which many will agree by itself express aberrant proteins [7, 36]. While the present study has suggested that any disruption in the cytoskeletal, metabolic enzymes, and biosynthesis proteins functions may be the cause for the ineffectiveness of cMSCs, this still needs to be proven in more specifically experimental designs.
Conclusions
In this study, distinct differences in the global protein expressions were identified between ACs, MSCs and cMSCs. Of these differentially expressed proteins, MYL6B, ALDOA, TAGLN2 and EF1-ALPHA were not as highly modulated during MSC chondrogenesis as compared to ACs. These differences may have been the contributing factors to the ineffectiveness of cMSCs in the cartilage repair. However, this needs to be demonstrated and supported by data obtained from more rigorously designed studies.
Abbreviations
2-DE: Two-dimensional gel electrophoresis; AC: Adult chondrocyte; ALDOA: Fructose-biphosphate aldolase; CFL1: Cofilin; cMSC: Chondrogenic pre-differentiated multipotent stromal cells; CO2: Carbon dioxide; DMEM: Dulbecco's Modified Eagle Medium; DMMC: 1,9-dimethylmethylene blue; DTT: Dithiothreitol; EF1-alpha: Elongation factor 1-alpha; FBS: Fetal bovine serum; GAPD: Glyceraldehyde-3-phosphate dehydrogenase; HPLC: High-performance liquid chromatography; IEF: Isoelectric focusing; LC-MS: Liquid chromatography-mass spectrometry; MSC: Multipotent stromal cells; MYL6B: Myosin light chain 6B; PBS: Phosphate buffered saline; PS: Penicillin-streptomycin; SD: Standard deviation; SE: Standard error; sGAG: sulphated glycosaminoglycan; SPSS: Statistical package for the social sciences; TAGLN2: Transgelin 2; TGF-β3: Transforming growth factor-beta 3
Acknowledgements
Grant numbers and sources of support: University of Malaya's HIR-MOHE research grant initiative, University of Malaya Research Grant: RG087/09HTM and University of Malaya Postgraduate Research Grant: PS259/2010B. The authors wish to express gratitude towards staff and facilities provided at Medical Biotechnology Laboratory, University of Malaya for this study. The authors further wish to thank Mrs Sahrinanah binti Mappiare for experimental assistance in animal handling, operation theatre preparation and her assistance in preparing the histological samples.
Competing Interests
The authors have declared that no competing interest exists.
References
1. Caplan AI. Adult mesenchymal stem cells for tissue engineering versus regenerative medicine. J Cell Physiol. 2007;213:341-7
2. Naveen S NRaTK. Comparative analysis of autologous chondrocyte implantation and other treatment modalities: a systematic review. European Journal of Orthopaedic Surgery and Traumatology. 2011;22:89-96
3. Brittberg M. Cell carriers as the next generation of cell therapy for cartilage repair: a review of the matrix-induced autologous chondrocyte implantation procedure. Am J Sports Med. 2010;38:1259-71
4. Vinardell T, Sheehy EJ, Buckley CT, Kelly DJ. A comparison of the functionality and in vivo phenotypic stability of cartilaginous tissues engineered from different stem cell sources. Tissue Eng Part A. 2012;18:1161-70
5. Dashtdar H, Rothan HA, Tay T, Ahmad RE, Ali R, Tay LX. et al. A preliminary study comparing the use of allogenic chondrogenic pre-differentiated and undifferentiated mesenchymal stem cells for the repair of full thickness articular cartilage defects in rabbits. J Orthop Res. 2011;29:1336-42
6. De la Fuente A, Mateos J, Lesende-Rodriguez I, Calamia V, Fuentes-Boquete I, de Toro FJ. et al. Proteome analysis during chondrocyte differentiation in a new chondrogenesis model using human umbilical cord stroma mesenchymal stem cells. Mol Cell Proteomics. 2011;11:M111010496
7. Ji YH, Ji JL, Sun FY, Zeng YY, He XH, Zhao JX. et al. Quantitative proteomics analysis of chondrogenic differentiation of C3H10T1/2 mesenchymal stem cells by iTRAQ labeling coupled with on-line two-dimensional LC/MS/MS. Mol Cell Proteomics. 2010;9:550-64
8. Wang D, Park JS, Chu JS, Krakowski A, Luo K, Chen DJ. et al. Proteomic profiling of bone marrow mesenchymal stem cells upon transforming growth factor beta1 stimulation. J Biol Chem. 2004;279:43725-34
9. Ab-Rahim S, Selvaratnam L, Kamarul T. The effect of TGF-beta1 and beta-estradiol on glycosaminoglycan and type II collagen distribution in articular chondrocyte cultures. Cell Biol Int. 2008;32:841-7
10. Boo L, Selvaratnam L, Tai CC, Ahmad TS, Kamarul T. Expansion and preservation of multipotentiality of rabbit bone-marrow derived mesenchymal stem cells in dextran-based microcarrier spin culture. J Mater Sci Mater Med. 2011;22:1343-56
11. Chong PP, Selvaratnam L, Abbas AA, Kamarul T. Human peripheral blood derived mesenchymal stem cells demonstrate similar characteristics and chondrogenic differentiation potential to bone marrow derived mesenchymal stem cells. J Orthop Res. 2011;30:634-42
12. Chevallet M, Luche S, Rabilloud T. Silver staining of proteins in polyacrylamide gels. Nat Protoc. 2006;1:1852-8
13. Bringans S, Kendrick TS, Lui J, Lipscombe R. A comparative study of the accuracy of several de novo sequencing software packages for datasets derived by matrix-assisted laser desorption/ionisation and electrospray. Rapid Commun Mass Spectrom. 2008;22:3450-4
14. Kim MJ, Kim S, Kim Y, Jin EJ, Sonn JK. Inhibition of RhoA but not ROCK induces chondrogenesis of chick limb mesenchymal cells. Biochem Biophys Res Commun. 2012;418:500-5
15. Zhang YE. Non-Smad pathways in TGF-beta signaling. Cell Res. 2009;19:128-39
16. Titushkin IA, Cho MR. Controlling cellular biomechanics of human mesenchymal stem cells. Conf Proc IEEE Eng Med Biol Soc. 2009;2009:2090-3
17. Woods A, Beier F. RhoA/ROCK signaling regulates chondrogenesis in a context-dependent manner. J Biol Chem. 2006;281:13134-40
18. Meyer-ter-Vehn T, Sieprath S, Katzenberger B, Gebhardt S, Grehn F, Schlunck G. Contractility as a prerequisite for TGF-beta-induced myofibroblast transdifferentiation in human tenon fibroblasts. Invest Ophthalmol Vis Sci. 2006;47:4895-904
19. Zaleskas JM, Kinner B, Freyman TM, Yannas IV, Gibson LJ, Spector M. Contractile forces generated by articular chondrocytes in collagen-glycosaminoglycan matrices. Biomaterials. 2004;25:1299-308
20. Moustakas A, Heldin CH. Non-Smad TGF-beta signals. J Cell Sci. 2005;118:3573-84
21. Vardouli L, Moustakas A, Stournaras C. LIM-kinase 2 and cofilin phosphorylation mediate actin cytoskeleton reorganization induced by transforming growth factor-beta. J Biol Chem. 2005;280:11448-57
22. Zanetti NC, Solursh M. Epithelial effects on limb chondrogenesis involve extracellular matrix and cell shape. Dev Biol. 1986;113:110-8
23. Xiao Y, Li Y, Han J, Pan Y, Tie L, Li X. Transgelin 2 participates in lovastatin-induced anti-angiogenic effects in endothelial cells through a phosphorylated myosin light chain-related mechanism. PLoS One. 2012;7:e46510
24. Amano M, Ito M, Kimura K, Fukata Y, Chihara K, Nakano T. et al. Phosphorylation and activation of myosin by Rho-associated kinase (Rho-kinase). J Biol Chem. 1996;271:20246-9
25. Ramachandran C, Patil RV, Combrink K, Sharif NA, Srinivas SP. Rho-Rho kinase pathway in the actomyosin contraction and cell-matrix adhesion in immortalized human trabecular meshwork cells. Mol Vis. 2011;17:1877-90
26. Rocha B, Calamia V, Mateos J, Fernandez-Puente P, Blanco FJ, Ruiz-Romero C. Metabolic labeling of human bone marrow mesenchymal stem cells for the quantitative analysis of their chondrogenic differentiation. J Proteome Res. 2012;11:5350-61
27. Boussidan F, Nahir AM. Altered chondrocytic oxidative metabolism during the restoration of depleted intercellular matrix. J Exp Pathol (Oxford). 1990;71:395-402
28. Nahir AM, Shomrat D, Awad M. Differential decline of rabbit chondrocytic dehydrogenases with age. Int J Exp Pathol. 1995;76:97-101
29. Saito T, Ikeda T, Nakamura K, Chung UI, Kawaguchi H. S100A1 and S100B, transcriptional targets of SOX trio, inhibit terminal differentiation of chondrocytes. EMBO Rep. 2007;8:504-9
30. Lamberti A, Caraglia M, Longo O, Marra M, Abbruzzese A, Arcari P. The translation elongation factor 1A in tumorigenesis, signal transduction and apoptosis: review article. Amino Acids. 2004;26:443-8
31. Lin KW, Yakymovych I, Jia M, Yakymovych M, Souchelnytskyi S. Phosphorylation of eEF1A1 at Ser300 by TbetaR-I results in inhibition of mRNA translation. Curr Biol. 2010;20:1615-25
32. Moore RC, Cyr RJ. Association between elongation factor-1alpha and microtubules in vivo is domain dependent and conditional. Cell Motil Cytoskeleton. 2000;45:279-92
33. Murray JW, Edmonds BT, Liu G, Condeelis J. Bundling of actin filaments by elongation factor 1 alpha inhibits polymerization at filament ends. J Cell Biol. 1996;135:1309-21
34. Kamisan N, Naveen SV, Ahmad RE, Tunku K. Chondrocyte density, proteoglycan content and gene expressions from native cartilage are species specific and not dependent on cartilage thickness: a comparative analysis between rat, rabbit and goat. BMC Vet Res. 2011;9:62
35. Malda J, de Grauw JC, Benders KE, Kik MJ, van de Lest CH, Creemers LB. et al. Of mice, men and elephants: the relation between articular cartilage thickness and body mass. PLoS One. 2012;8:e57683
36. Shea CM, Edgar CM, Einhorn TA, Gerstenfeld LC. BMP treatment of C3H10T1/2 mesenchymal stem cells induces both chondrogenesis and osteogenesis. J Cell Biochem. 2003;90:1112-27
Author contact
![]() Corresponding author: Prof. Tunku Kamarul, Tissue Engineering Group (TEG), National Orthopaedic Center of Excellence for Research and Learning (NOCERAL), Department of Orthopaedic Surgery, Faculty of Medicine, University of Malaya, 50603 Kuala Lumpur, Malaysia. Email: tkzreaedu.my; Tel.: 03-7967 7543; Fax: 03-7949 4642
Corresponding author: Prof. Tunku Kamarul, Tissue Engineering Group (TEG), National Orthopaedic Center of Excellence for Research and Learning (NOCERAL), Department of Orthopaedic Surgery, Faculty of Medicine, University of Malaya, 50603 Kuala Lumpur, Malaysia. Email: tkzreaedu.my; Tel.: 03-7967 7543; Fax: 03-7949 4642