Impact Factor ISSN: 1449-1907

 Global reach, higher impact
Int J Med Sci 2013; 10(9):1113-1120. doi:10.7150/ijms.6843 This issue Cite
Research Paper
Meta-Analysis of Adiponectin Polymorphisms and Colorectal Cancer Risk
Chuncui Ye*, Jun Wang*, Shiyun Tan ![]() , Jun Zhang, Ming Li, Peng Sun
, Jun Zhang, Ming Li, Peng Sun
Department of Gastroenterology, Renmin Hospital of Wuhan University, Wuhan 430060, Hubei, China.
* Chuncui Ye and Jun Wang contributed equally to this work.
Received 2013-6-6; Accepted 2013-6-18; Published 2013-7-4
Abstract
Objective The adiponectin gene (ADIPOQ) has been suggested to be associated with the pathogenesis of colorectal cancer (CRC). However, the results have been inconsistent. In this study, we performed a meta-analysis to investigate the association between adiponectin polymorphisms and CRC risk.
Methods All eligible case-control studies published up to March 2013 were identified by searching PubMed, Web of Science and CNKI. Effect sizes of odds ratio (OR) and 95% confidence interval (95% CI) were calculated by using a fixed- or random-effect model.
Results A total of 9 case-control studies were included, Of those studies, there were eight studies (2024 cases and 2777 controls) for rs1501299G/T polymorphism, five studies (1401 cases and 1691 controls) for rs2241766T/G polymorphism, five studies (2945 cases and 3361 controls) for rs266729C/G polymorphism, three studies (1221 cases and 1579 controls) for rs822395A/C polymorphism and three studies (1222 cases and 1575 controls) for rs822396A/G polymorphism. Overall, a significant association was observed for rs2241766T/G polymorphism under heterozygote comparison (TG vs. TT: OR=1.22, 95%CI: 1.05-1.43); while there was no significant association for rs2241766 polymorphism under other genetic models, and for other four polymorphisms under all genetic models. Besides, when stratified analyses by ethnicity, no significant association between five polymorphisms and CRC risk were observed under all genetic models among Asian, Caucasian and African-American.
Conclusions This meta-analysis indicated that adiponectin rs2241766T/G rather than rs1501299G/T, rs266729C/G, rs822395A/C and rs822396A/G polymorphism was associated with the risk of colorectal cancer.
Keywords: Adiponectin, Polymorphism, Colorectal cancer, Meta-analysis.
Introduction
Colorectal cancer (CRC) is one of the most common gastrointestinal tumors worldwide [1]. Epidemiological studies have demonstrated that some risk factors and interactions between genetic and environmental factors may play important roles in the pathogenesis of that cancer [2,3].
Adiponectin is an adipose tissue-specific cytokine, which plays an important role in the regulation of insulin sensitivity, glucose homeostasis and lipid metabolism [4]. The decreases of plasma adiponectin levels are associated with obesity, type 2 diabetes, and coronary artery disease [5]. In addition, reduced adiponectin levels are also observed in CRC patients, suggesting the role of adiponectin in the pathogenesis of CRC [6]. The ADIPOQ gene (also known as AMP1 gene) coding for adiponectin, is located on chromosome 3q27, consists of 3 exons and two introns. Several studies have investigated the association between single nucleotide polymorphisms (SNPs) in the ADIPOQ gene and CRC risk in diverse populations. Of those SNPs, five were most commonly studied ones: rs1501299 (+276 G>T in intron 2), rs2241766 (+45T>G in exon 2), rs266729 (-11365 C>G in 5' flanking), rs822495 (-4034 A>C in intron 1), rs822396 (-3964 A>G in intron 1). However, the results have been inconsistent [7-15].
In this study, we performed a meta-analysis to clarify the associations of the five polymorphisms in the ADIPOQ gene with CRC susceptibility in diverse populations.
Materials and methods
Search strategy
A literature research was conducted using PubMed, Web of Science and CNKI up to March 2013 without language restrictions. Relevant studies were identified using the terms: “adiponectin or ADIPOQ or APM1” AND “genetic polymorphism or polymorphisms or variant” AND “colorectal cancer or carcinoma”. The search was restricted to humans. Additional studies were identified by a hand search of references of original or review articles on this topic. If data or data subsets were published in more than one article, only the publication with the largest sample size was included.
Inclusion criteria and exclusion criteria
Studies were included if they met the following criteria: (1) studies that evaluated the association between the adiponectin polymorphisms and colorectal cancer, (2) in a case-control study design, (3) had detailed genotype frequency of cases and controls or could be calculated from the article text. While major exclusion criteria were: (1) case-only study, case reports, and review articles, (2) studies without the raw data of the adiponectin genotype, (3) repetitive publications.
Data extraction
The two investigators (Ye CC and Wang J) independently extracted data and reached consensus on all of the items. If the two investigators generated different results, they would check the data again and have a discussion to come to an agreement. If they could not reach an agreement, an expert (Tan SY) was invited to the discussion. Data extracted from the selected articles included the first author's name, year of publication, country of origin, ethnicity of study population, number of cases and controls, and HWE in controls (P value). Different ethnicity was categorized as Asian, Caucasian, and African-American.
Quality assessment
The qualities of eligible studies were assessed by using Newcastle-Ottawa Scale (NOS), which is widely used for assessment of the quality of observational study including cohort or case-control study[16]. NOS, consisting of three parts (selection, comparability and exposure), is a star-rewarded scale. A total of four, two, and three stars, respectively, will be rewarded if the criteria are met. The study with more than seven stars (≧7 stars) was categorized as high quality; otherwise, the study was categorized as low quality.
Statistical analysis
Meta-analysis was performed using the Cochrane Collaboration RevMan 5.0 (Copenhagen, 2008) and STATA package version 12.0 (Stata Corporation, College Station, Texas). The risk of CRC associated with the five polymorphisms of the adiponectin gene was estimated for each study by odds ratio (OR) and 95% confidence interval (95%CI). A χ2-test-based Q statistic test was performed to assess the between-study heterogeneity [17]. We also quantified the effect of heterogeneity by I2 test. When a significant Q test (P≤ 0.05) or I2 >50% indicated heterogeneity across studies, the random effects model was used [18], or else the fixed effects model was used [19]. Before the effect estimation of adiponectin polymorphisms in colorectal cancer, we tested whether genotype frequencies of controls were in HWE using χ2 test. We first estimated the risks of the heterozygote and variant homozygote compared with the wild-type homozygote, respectively, and then evaluated the risks of the combined variant homozygote and heterozygote versus the wild-type homozygote, and the variant homozygote versus the combined heterozygote and wild-type homozygote, assuming dominant and recessive effects of the variant allele, respectively. We performed stratification analyses on ethnicity. Analysis of sensitivity was performed to evaluate the stability of the results. Finally, potential publication bias was investigated using Begg' funnel plot and Egger's regression test [20,21]. P < 0.05 was regarded as statistically significant.
Results
Study characteristics
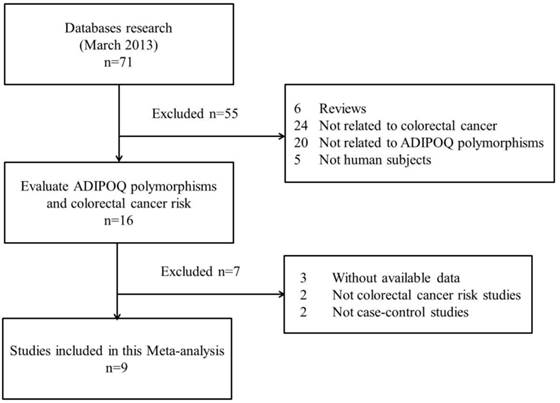
The search strategy retrieved 71 potentially relevant studies. According to the inclusion criteria, 9 studies with full-text were included in this meta-analysis and 62 studies were excluded. Since the article by Keku et al[11] contained two studies, they were considered as separate study in the following meta-analysis. The flow chart of study selection is summarized in Fig.1. As shown in Table 1, there were 8 case-control studies [7,9-12,14,15] concerning rs1501299G/T polymorphism, 5 studies [7,9,10,12,15] concerning rs2241766T/G, 5 studies [8-10,13,15] concerning rs266729C/G, 3 studies [9,10,15] concerning rs822395A/C and 3 studies [9,10,15] concerning rs822396A/G. Three ethnicities were addressed: four studies focused on Asian population, five on Caucasian population, and one on African-American population. The distribution of genotypes in the controls was consistent with the Hardy-Weinberg equilibrium for all selected studies except for one study [7] for rs1501299G/T, two studies [7,10] for rs2241766T/G, one study [8] for rs266729C/G and one study [10] for rs822395A/C. The qualities of eligible studies were perfect as seven studies for rs1501299G/T, three studies for rs2241766T/G, all studies for rs266729C/G, two studies for rs822395A/C and all studies for rs822396A/G were categorized as high quality with gain of more than seven stars.
Flow chart showing study selection procedure.
Characteristics of studies included in the meta-analysis.
| Study | Year | Country | Ethnicity | Case | Control | PHWE | NOS | |||||
|---|---|---|---|---|---|---|---|---|---|---|---|---|
| WT Ho | Ht | VR Ho | WT Ho | Ht | VR Ho | |||||||
| rs1501299G/T | GG | GT | TT | GG | GT | TT | ||||||
| Al-Harithy[7] | 2012 | Saudi Arabia | Asian | 55 | 5* | 58 | 2* | NA | 5 | |||
| He[9] | 2011 | China | Asian | 220 | 160 | 40 | 265 | 224 | 66 | 0.08 | 7 | |
| Kaklamani[10] | 2008 | USA | Caucasian | 208 | 180 | 45 | 285 | 293 | 58 | 0.16 | 9 | |
| Keku[11] | 2012 | USA | Caucasian | 122 | 106 | 27 | 223 | 204 | 36 | 0.25 | 8 | |
| Keku TO[11] | 2012 | USA | African-American | 78 | 94 | 19 | 116 | 119 | 41 | 0.25 | 8 | |
| Partida-Perez[12] | 2010 | Mexico | Caucasian | 51 | 40 | 3 | 30 | 25 | 3 | 0.44 | 7 | |
| Tsilidis[14] | 2009 | USA | Caucasian | 96 | 86 | 19 | 198 | 134 | 27 | 0.51 | 8 | |
| Zhang[15] | 2012 | China | Asian | 196 | 139 | 35 | 174 | 152 | 44 | 0.23 | 7 | |
| rs2241766T/G | TT | TG | GG | TT | TG | GG | ||||||
| Al-Harithy[7] | 2012 | Saudi Arabia | Asian | 40 | 20* | 27 | 33* | NA | 5 | |||
| He[9] | 2011 | China | Asian | 190 | 193 | 37 | 278 | 238 | 39 | 0.21 | 8 | |
| Kaklamani[10] | 2008 | USA | Caucasian | 279 | 141 | 20 | 435 | 172 | 41 | <0.01 | 9 | |
| Partida-Perez[12] | 2010 | Mexico | Caucasian | 74 | 34 | 3 | 42 | 16 | 0 | 0.22 | 6 | |
| Zhang[15] | 2012 | China | Asian | 167 | 172 | 31 | 186 | 158 | 26 | 0.33 | 7 | |
| rs266729C/G | CC | CG | GG | CC | CG | GG | ||||||
| Gornick[8] | 2011 | Israel | Asian | 576 | 486* | 588 | 474* | NA | 6 | |||
| He[9] | 2011 | China | Asian | 173 | 205 | 42 | 243 | 261 | 51 | 0.11 | 7 | |
| Kaklamani[10] | 2008 | USA | Caucasian | 244 | 163 | 27 | 340 | 271 | 47 | 0.48 | 8 | |
| Pechlivanis[13] | 2009 | Czech | Caucasian | 366 | 238 | 55 | 373 | 278 | 65 | 0.21 | 8 | |
| Zhang[15] | 2012 | China | Asian | 146 | 185 | 39 | 162 | 172 | 36 | 0.32 | 7 | |
| rs822395A/C | AA | AC | CC | AA | AC | CC | ||||||
| He[9] | 2011 | China | Asian | 343 | 70 | 7 | 440 | 109 | 6 | 0.79 | 7 | |
| Kaklamani[10] | 2008 | USA | Caucasian | 184 | 202 | 45 | 301 | 265 | 88 | 0.02 | 6 | |
| Zhang[15] | 2012 | China | Asian | 299 | 66 | 5 | 294 | 72 | 4 | 0.86 | 7 | |
| rs822396A/G | AA | AG | GG | AA | AG | GG | ||||||
| He[9] | 2011 | China | Asian | 344 | 73 | 3 | 450 | 99 | 6 | 0.83 | 7 | |
| Kaklamani[10] | 2008 | USA | Caucasian | 305 | 114 | 13 | 477 | 157 | 16 | 0.48 | 8 | |
| Zhang[15] | 2012 | China | Asian | 300 | 67 | 3 | 300 | 66 | 4 | 0.86 | 7 | |
HWE, Hardy-Weinberg equilibrium; PHWE was calculated by goodness-of fit χ2-test, PHWE < 0.05 was considered statistically significant; NA, not available. Ht, heterozygote; VR Ho, variant homozygote; WT Ho, wide-type homozygote; * Numbers of Ht+ VR Ho; NOS, Newcastle-Ottawa Scale.
Quantitative synthesis
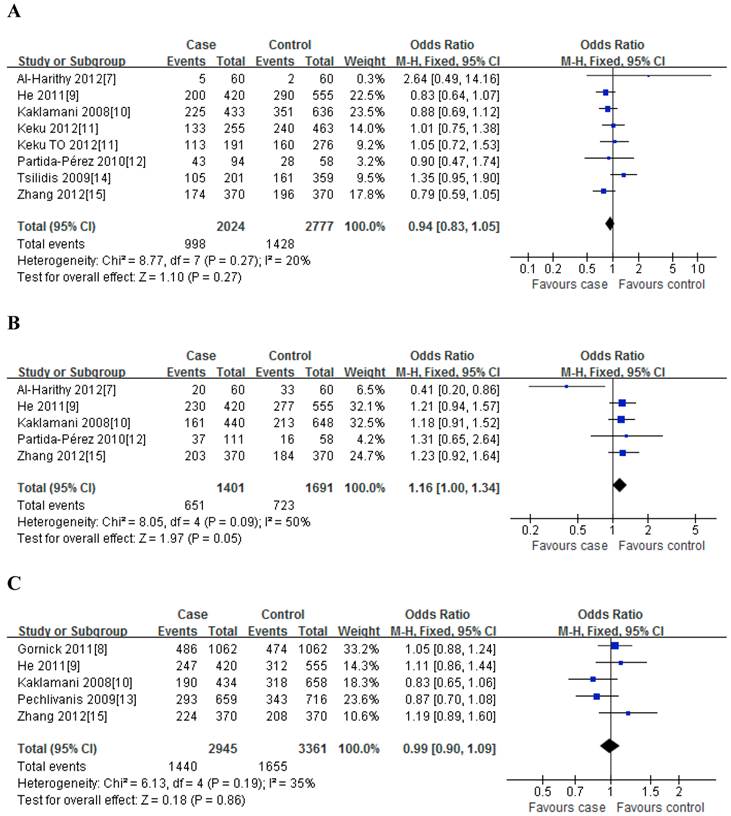
For rs1501299G/T polymorphism, 8 case-control studies with 2024 cases and 2777 controls were identified. Overall, no significant association was observed under all genetic models [dominant model: OR=0.94, 95%CI: 0.83-1.05, P=0.27; recessive model: OR=0.94, 95%CI: 0.77-1.15, P=0.26; GT vs. GG: OR=0.94, 95%CI: 0.83-1.06, P=0.36; TT vs. GG: OR=0.92, 95%CI: 0.75-1.12, P=0.25] (Figure 2); meanwhile, when stratified analysis with ethnicity, the results also indicated that no significant association was observed among Asian, Caucasian and African-American populations (Table 2).
Meta-analysis of the association between rs2241766 polymorphism and susceptibility to colorectal cancer under dominant model (A: rs1501299G/T; B: rs2241766T/G; C: rs266729C/G; D: rs822395A/C; E: rs822396A/G).
Summary of OR of the ADIPOQ polymorphisms and CRC risk.
| SNP | Ethnicity | N. | Dominant model | Recessive model | Ht vs WT Ho | VR vs WT Ho | |||||||
|---|---|---|---|---|---|---|---|---|---|---|---|---|---|
| OR(95% CI) | Pa | OR(95% CI) | Pa | OR(95% CI) | Pa | OR(95% CI) | Pa | ||||||
| rs1501299G/T | Total | 8 | 0.94[0.83,1.05] | 0.27 | 0.94[0.77,1.15] | 0.26 | 0.94[0.83,1.06] | 0.36 | 0.92[0.75,1.12] | 0.25 | |||
| Asian | 3 | 0.83[0.68,1.00] | 0.38 | 0.78[0.57,1.06] | 0.98 | 0.84[0.68,1.03] | 0.78 | 0.72[0.52,0.99] | 0.92 | ||||
| Caucasian | 4 | 1.01[0.86,1.18] | 0.26 | 1.22[0.92,1.62] | 0.78 | 0.97[0.82,1.15] | 0.26 | 1.20[0.89,1.61] | 0.66 | ||||
| African-American | 1 | 1.05[0.72,1.53] | - | 0.63[0.36,1.13] | - | 1.17[0.79,1.74] | - | 0.69[0.37,1.27] | - | ||||
| rs2241766T/G | Total | 5 | 1.12[0.89,1.40] | 0.09 | 1.07[0.80,1.43] | 0.30 | 1.22[1.05,1.43] | 0.98 | 1.16[0.86,1.56] | 0.31 | |||
| Asian | 3 | 0.99[0.65,1.50]# | 0.02 | 1.36[0.96,1.93] | 0.70 | 1.20[0.98,1.46] | 0.92 | 1.36[0.94,1.97] | 0.91 | ||||
| Caucasian | 2 | 1.19[0.94,1.52] | 0.78 | 0.77[0.45,1.30] | 0.28 | 1.27[0.99,1.63] | 0.88 | 0.83[0.48,1.41] | 0.28 | ||||
| rs266729C/G | Total | 5 | 0.99[0.90,1.09] | 0.19 | 0.98[0.79,1.22] | 0.83 | 0.96[0.85,1.10] | 0.19 | 0.98[0.78,1.22] | 0.53 | |||
| Asian | 3 | 1.09[0.96,1.24] | 0.73 | 1.10[0.80,1.51] | 0.99 | 1.14[0.93,1.40] | 0.70 | 1.18[0.84,1.65] | 0.91 | ||||
| Caucasian | 2 | 0.85[0.73,1.00] | 0.79 | 0.89[0.66,1.20] | 0.46 | 0.86[0.72,1.01] | 0.82 | 0.84[0.62,1.14] | 0.82 | ||||
| rs822395A/C | Total | 3 | 1.00[0.85,1.19] | 0.33 | 0.83[0.59,1.18] | 0.39 | 1.00[0.76,1.30] | 0.11 | 0.92[0.64,1.32] | 0.56 | |||
| Asian | 2 | 0.88[0.70,1.12] | 0.79 | 1.42[0.61,3.31] | 0.81 | 0.86[0.67,1.10] | 0.72 | 1.38[0.59,3.22] | 0.82 | ||||
| Caucasian | 1 | 1.14[0.90,1.46] | - | 0.75[0.51,1.10] | - | 1.25[0.96,1.62] | - | 0.84[0.56,1.25] | - | ||||
| rs822396A/G | Total | 3 | 1.05[0.87,1.25] | 0.65 | 1.00[0.55,1.82] | 0.67 | 1.05[0.87,1.26] | 0.75 | 1.02[0.56,1.86] | 0.64 | |||
| Asian | 2 | 0.97[0.76,1.24] | 0.83 | 0.70[0.25,1.93] | 0.90 | 0.99[0.77,1.27] | 0.84 | 0.70[0.25,1.93] | 0.90 | ||||
| Caucasian | 1 | 1.15[0.88,1.50] | - | 1.23[0.59,2.58] | - | 1.14[0.86,1.50] | - | 1.27[0.60,2.68] | - | ||||
N.: number of studies; aTest for heterogeneity. # Random-effect model was used when the P for heterogeneity test was ≤ 0.05, otherwise the fixed-effect model was used. CI, confidence interval; OR, odds ratio; SNP, single-nucleotide polymorphism; Ht+VR Ho vs. WT Ho, dominant model; VR Ho vs. Ht+WT Ho, recessive model.
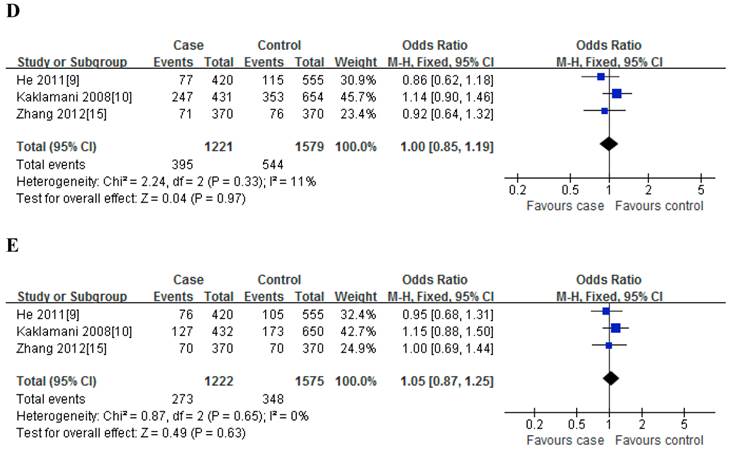
For rs2241766T/G polymorphism, 5 studies with 1401 cases and 1691 controls were identified. Overall, a significant association was observed under heterozygote comparison (TG vs. TT: OR=1.22, 95%CI: 1.05-1.43, P=0.98) (Figure 3); while there was no significant association under other genetic models[dominant model: OR=1.12, 95%CI: 0.89-1.40, P=0.09; recessive model: OR=1.07, 95%CI: 0.80-1.43, P=0.30; GG vs. TT: OR=1.16, 95%CI: 0.86-1.56, P=0.31] (Figure 2); besides, In the subgroup analysis by ethnicity, similar results were observed in both Asian and Caucasian populations (Table 2).
Meta-analysis of the association between rs2241766 polymorphism and susceptibility to colorectal cancer (TG vs. TT).
For rs266729C/G polymorphism, 5 studies with 2945 cases and 3361 controls were identified. Overall, we did not find any association between rs266729C/G polymorphism and risk of CRC under all four genetic models [dominant model: OR=0.99, 95%CI: 0.90-1.09, P=0.19; recessive model: OR=0.98, 95%CI: 0.79-1.22, P=0.83; CG vs. CC: OR=0.96, 95%CI: 0.85-1.10, P=0.19; GG vs. CC: OR=0.98, 95%CI: 0.78-1.22, P=0.53] (Figure 2); Subgroup analysis with ethnicity also indicated that there was no significant association in both Asian and Caucasian populations (Table 2).
For rs822395A/C polymorphism, only three studies with 1221 cases and 1579 controls were identified. The results showed that no significant association was found both in overall and subgroup analysis (Table 2).
For rs822396A/G polymorphism, only three studies with 1222 cases and 1575 controls were identified. The results also suggested that there was no significant association between them both in overall and subgroup analysis (Table 2).
Sensitivity analysis
Sensitivity analysis, after removing one study at a time, was performed to evaluate the stability of the results. For rs2241766T/G polymorphism, when excluded the study by Al-Harithy et al[7], the heterogeneity disappears; for the other four polymorphisms, when successively excluded one study, the estimated pooled odd ratio still did not change at all, indicating that our results were statistically robust (data not shown).
Publication bias
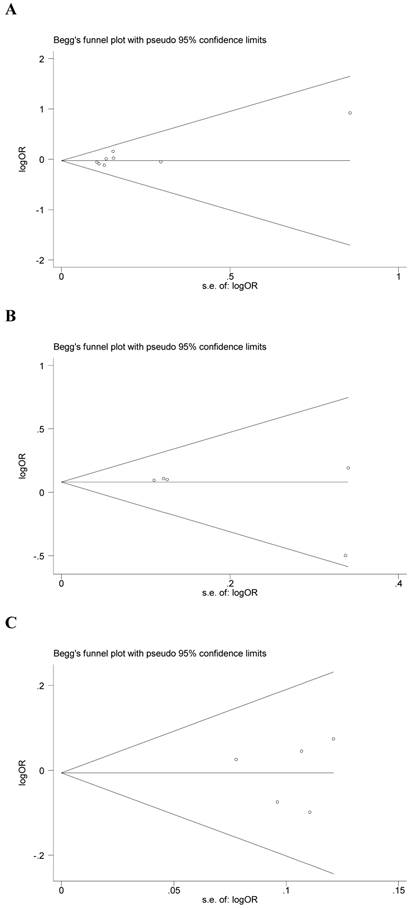
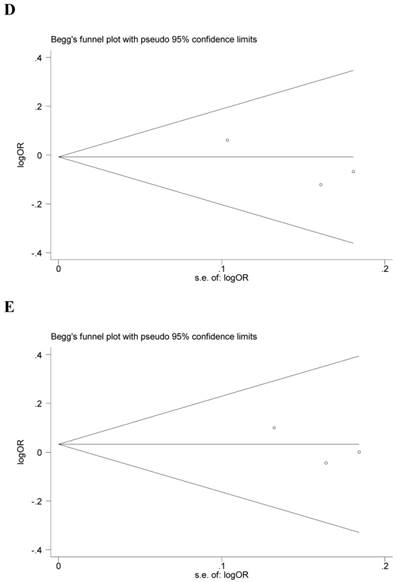
Begg's funnel plot and Egger's test were performed to assess the potential publication bias in the available literature. The publication bias of the meta-analysis on the association between ADIPOQ polymorphisms and susceptibility to CRC was detected. The shape of funnel plots did not reveal any evidence of funnel plot asymmetry (Figure 4). Egger's test also showed that there was no statistical significance for the evaluation of publication bias under dominant model (rs1501299G/T: P=0.095, rs2241766T/G: P=0.316, rs266729C/G: P=0.952, rs822395A/C: P=0.265, rs822396A/G: P=0.387).
Begg's funnel plot for publication bias under dominant model (A: rs1501299G/T; B: rs2241766T/G; C: rs266729C/G; D: rs822395A/C; E: rs822396A/G).
Discussion
Adiponectin is solely secreted by the adipose tissue. In the past decade, the associations between adiponectin and its genetic polymorphisms and risk of cancer have been widely studied. A meta-analysis conducted by An et al [22] consisting of 2,632 cases of colorectal tumor and 2,753 controls indicated that plasma level of adiponectin was significantly lower in patients compared to healthy people, which indicated the protective role of adiponectin in colorectal tumor development.
To our knowledge, this is the first meta-analysis which comprehensively assessed the associations between polymorphisms in the ADIPOQ gene and CRC risk. In this study, five common polymorphisms (rs1501299G/T, rs2241766T/G, rs266729C/G, rs822395A/C, rs822396A/G) were investigated, and a total of nine case-control studies were included. The results showed that a significant association was observed for rs2241766T/G polymorphism under heterozygote comparison (TG vs. TT), however, there was no significant association for rs2241766 polymorphism under other genetic models, and for other four polymorphisms under all genetic models. In addition, when stratified analyses by ethnicity, no significant association between five polymorphisms and CRC risk were observed under all genetic models among Asian, Caucasian and African-American.
Heterogeneity between studies is very common in the meta-analysis of genetic association studies [23]. In this study, heterogeneity was found under dominant model in rs2241766T/G polymorphism, however, stratified by ethnicity, heterogeneity still existed in Asian population, Then sensitivity analyses were conducted by successively excluding one study, for rs2241766T/G polymorphism, when excluded the study by Al-Harithy et al, the heterogeneity disappears; it suggests that the particular study may be the source of heterogeneity. But, for the other four polymorphisms, the estimated pooled odd ratio changed quite little, strengthening the results from this meta-analysis. No publication bias was shown suggesting this possible true result.
Some limitations of this meta-analysis should be addressed. First, because of incomplete raw data or publication limitations, some relevant studies could not be included in our analysis. Second, the number of published studies, especially for rs822395A/C and rs822395A/C polymorphism was not sufficiently large for a comprehensive analysis, and some studies with small size (such as the study by Al-Harithy et al) may not have enough statistical power to explore the real association. Third, our results were based on unadjusted estimates, while lacking of the information for the date analysis may cause serious confounding bias. In spite of these limitations, our meta-analysis had several advantages. First, substantial number of cases and controls were pooled from different studies, which significantly increased statistical power of the analysis. Second, the quality of case-control studies included in current meta-analysis was satisfactory and met our inclusion criterion. Third, we did not detect any publication bias indicating that the whole pooled result should be unbiased.
In summary, this meta-analysis suggesting that adiponectin rs2241766T/G rather than rs1501299G/T, rs266729C/G, rs822395A/C and rs822396A/G polymorphism was associated with risk of colorectal cancer development. However, large and well-designed studies are warranted to validate our findings.
Competing Interests
The authors have declared that no competing interest exists.
References
1. Jemal A, Bray F, Center MM. et al. Global cancer statistics. CA Cancer J Clin. 2011;61:69-90
2. Fearon ER. Human cancer syndromes: clues to the origin and nature of cancer. Science. 1997;278:1043-50
3. Risch N. The genetic epidemiology of cancer: interpreting family and twin studies and their implications for molecular genetic approaches. Cancer Epidemiol Biomarkers Prev. 2001;10:733-41
4. Cnop M, Havel PJ, Utzschneider KM. et al. Relationship of adiponectin to body fat distribution, insulin sensitivity and plasma lipoproteins: evidence for independent roles of age and sex. Diabetologia. 2003;4:459-69
5. Yang WS, Chuang LM. Human genetics of adiponectin in the metabolic syndrome. J Mol Med(Berl). 2006;84:112-21
6. Gialamas SP, Petridou ET, Tseleni-Balafouta S. et al. Serum adiponectin levels and tissue expression of adiponectin receptors are associated with risk, stage, and grade of colorectal cancer. Metabolism. 2011;60:1530-8
7. Al-Khaldi RM, Al Mulla F, Al Awadhi S. et al. Associations of single nucleotide polymorphisms in the adiponectin gene with adiponectin levels and cardio-metabolic risk factors in patients with cancer. Dis Markers. 2011;30:197-212
8. Gornick MC, Rennert G, Moreno V. et al. Adiponectin gene and risk of colorectal cancer. Br J Cancer. 2011;105:562-4
9. He B, Pan Y, Zhang Y. et al. Effects of genetic variations in the adiponectin pathway genes on the risk of colorectal cancer in the Chinese population. BMC Med Genet. 2011;12:94
10. Kaklamani VG, Wisinski KB, Sadim M. et al. Variants of the adiponectin (ADIPOQ) and adiponectin receptor 1 (ADIPOR1) genes and colorectal cancer risk. JAMA. 2008;300:1523-31
11. Keku TO, Vidal A, Oliver S. et al. Genetic variants in IGF-I, IGF-II, IGFBP-3, and adiponectin genes and colon cancer risk in African Americans and Whites. Cancer Causes Control. 2012;23:1127-38
12. Partida-Pérez M, de la Luz Ayala-Madrigal M, Peregrina-Sandoval J. et al. Association of LEP and ADIPOQ common variants with colorectal cancer in Mexican patients. Cancer Biomark. 2010;7:117-21
13. Pechlivanis S, Bermejo JL, Pardini B. et al. Genetic variation in adipokine genes and risk of colorectal cancer. Eur J Endocrinol. 2009;160:933-40
14. Tsilidis KK, Helzlsouer KJ, Smith MW. et al. Association of common polymorphisms in IL10, and in other genes related to inflammatory response and obesity with colorectal cancer. Cancer Causes Control. 2009;20:1739-51
15. Zhang Y, Feng QL, Liu CM. et al. Relationship between polymorphism sites of adiponection and it's receptor gene and the susceptibility of colorectal cancer. Jiangsu Daxue Xuebao (Yixueban). 2012;22:336-41
16. Stang A. Critical evaluation of the Newcastle-Ottawa scale for the assessment of the quality of nonrandomized studies in meta-analyses. Eur J Epidemiol. 2010;25:603-5
17. Lau J, Ioannidis JP, Schmid CH. Quantitative synthesis in systematic reviews. Ann Intern Med. 1997;127:820-6
18. DerSimonian R, Laird N. Meta-analysis in clinical trials. Control Clin Trials. 1986;7:177-88
19. Mantel N, Haenszel W. Statistical aspects of the analysis of data from retrospective studies of disease. J Natl Cancer Inst. 1959;22:719-48
20. Begg CB, Mazumdar M. Operating characteristics of a rank correlation test for publication bias. Biometrics. 1994;50:1088-101
21. Egger M, Davey Smith G, Schneider M. et al. Bias in meta-analysis detected by a simple, graphical test. BMJ. 1997;315:629-34
22. An W, Bai Y, Deng SX. et al. Adiponectin levels in patients with colorectal cancer and adenoma: a meta-analysis. Eur J Cancer Prev. 2012;21:126-33
23. Boccia S, De Feo E, Gallı` P. et al. A systematic review evaluating the methodological aspects of meta-analyses of genetic association studies in cancer research. Eur J Epidemiol. 2010;25:765-75
Author contact
![]() Corresponding author: Shiyun Tan; Department of Gastroenterology, Renmin Hospital of Wuhan University, Wuhan 430060, Hubei, China, Tel.: 86-27-88041911-81237, Fax: 86-27-88041911, Email: tanshiyuncom.cn.
Corresponding author: Shiyun Tan; Department of Gastroenterology, Renmin Hospital of Wuhan University, Wuhan 430060, Hubei, China, Tel.: 86-27-88041911-81237, Fax: 86-27-88041911, Email: tanshiyuncom.cn.