Impact Factor ISSN: 1449-1907

 Global reach, higher impact
Int J Med Sci 2012; 9(8):634-641. doi:10.7150/ijms.4969 This issue Cite
Research Paper
Decisive Indicator for Gastrointestinal Workup in Anemic Patients with Nondialysis Chronic Kidney Disease
Hyeon Seok Hwang1, Youn Mi Song2, Eun Oh Kim1, Eun Sil Koh1, Hye Eun Yoon1, Sung Jin Chung1, Sang Ju Lee1, Yoon Kyung Chang1, Chul Woo Yang1, Yoon Sik Chang1, Suk Young Kim1 ![]()
1. Division of Nephrology, Departments of Internal Medicine, College of Medicine, The Catholic University of Korea, Seoul, Korea
2. Division of Gastroenterology, Departments of Internal Medicine, College of Medicine, The Catholic University of Korea, Seoul, Korea
Received 2012-8-1; Accepted 2012-9-7; Published 2012-9-19
Abstract
Background: Anemia and iron deficiency are universal problems in patients with chronic kidney disease (CKD). However, decisive indicator to guide the further gastrointestinal (GI) workup has not been determined.
Methods: We included 104 anemic patients with nondialysis-dependent CKD stages 3-5 (38 patients at stage 3, 26 patients at stage 4, and 40 patients at stage 5). Hemoglobin, serum ferritin, transferrin saturation (TSAT), mean corpuscular volume (MCV), and corrected reticulocyte count data were assessed to evaluate diagnostic utility for bleeding-related GI lesions, which were identified by esophagogastroduodenoscopy and colonoscopy.
Results: Bleeding-related GI lesions were found in 55 (52.9%) patients, and patients with stage 5 CKD had a higher prevalence of gastric lesions than patients with CKD stage 3 or 4 (all p < 0.05). The areas under the receiver operating characteristic curves used to predict bleeding-related lesions were 0.69 for TSAT (p = 0.002) and 0.61 for serum ferritin (p = 0.085). The sensitivity and specificity of a cutoff value for TSAT < 20% were 0.59 and 0.74, respectively. Hemoglobin, MCV, and corrected reticulocyte levels had no significant diagnostic utility. On multivariable logistic regression, the chance of GI lesions increased by 6% for each 1% reduction in TSAT and increased 4.1-fold for patients with CKD stage 5 (all p < 0.05).
Conclusions: TSAT is a useful indicator for determining the GI workup in anemic patients with nondialysis-dependent CKD stages 3-5. Stage 5 CKD is independently associated with bleeding-related lesions and TSAT should be used cautiously in these patients.
Keywords: Chronic kidney disease, anemia, endoscopy
Introduction
Anemia is a universal problem in patients with chronic kidney disease (CKD), contributing to a poor quality of life and increasing the risk of cardiovascular events (1-3). Iron depletion predominantly contributes to anemia and the correction of insufficient iron levels is an integral part of anemia management (4-7). Iron deficiency in hemodialysis patients results from blood retention in the dialysis circuit, frequent blood testing, access bleeding, and surgical blood loss. Although iron deficiency is also a common disorder in patients with CKD stages 3-5 not undergoing dialysis therapy, most of these factors are either not present in these patients or are present to a lesser degree (6-9). Therefore, a diagnosis of iron deficiency anemia should entrain an evaluation of any sources of blood loss.
In patients without renal dysfunction, serum ferritin < 15 ng/mL is the most powerful indicator of iron deficiency (10). Low levels of serum iron, increased total iron-binding capacity, and transferrin saturation usually appear to be associated with iron deficiency anemia and hypochromasia, together with an increased reticulocyte count (11). In this setting, iron deficiency is presumed to result from gastrointestinal (GI)-tract blood loss, so upper and lower GI studies should be considered, unless there is a history of significant overt non-GI blood loss (12, 13). However, there is little information about the decisive indicators that can guide the further diagnostic GI workup in patients with CKD. There have also been few comparative studies of peripheral iron, red blood cells, and reticulocyte indices in the prediction of bleeding-related GI lesions.
Therefore, we evaluated the diagnostic utility of peripheral iron, red blood cells, and reticulocyte indices for bleeding-related GI lesions. We looked for useful indicators that can guide the GI workup in anemic patients with nondialysis-dependent CKD stages 3-5, and also interested in establishing critical information about the diagnostic utility of these indicators in different stages of CKD.
Materials and Methods
Patients and selection criteria
This study was approved by the Institutional Review Board of our centers (XC12RIMI0032D). We identified 142 anemic patients with nondialysis-dependent CKD stages 3-5 at Daejeon and Yeouido St. Mary`s hospital from February 2005 to December 2011, who were naïve for iron and erythropoiesis-stimulating agents and had undergone both esophagogastroduodenoscopy (EGD) and colonoscopy. Anemia was defined as a serum hemoglobin concentration < 12.0 g/dL for women and < 13.5 g/dL for men. The estimated glomerular filtration rate, calculated using the abbreviated Modification of Diet in Renal Disease formula, was used for CKD staging (14). All premenopausal women eligible for this study were referred to an obstetrician/gynecologist, and we identified no definite bleeding lesions among them.
Patients with recent blood transfusions (n = 1), active infectious conditions (n = 17), obvious sources of active GI bleeding (n = 4), cancer (n = 5), iron overload (ferritin > 800 ng/mL, n = 6), hematological disease affecting anemia (n = 4), or liver cirrhosis (n = 1) were excluded. No patient had severe hyperparathyroidism (intact parathyroid hormone > 800 pg/mL). Finally, a total of 104 anemic patients with CKD stages 3-5 were enrolled in this study.
Laboratory measurements
We examined the hematological and biochemical variables that had been recorded within three months of the index EGD and colonoscopy. The examined data included the demographic data, hemoglobin, hematocrit, serum ferritin, serum iron, total iron-binding capacity, mean corpuscular volume (MCV), mean cell hemoglobin (MCH), mean corpuscular hemoglobin concentration (MCHC), and reticulocyte count. The transferrin saturation (TSAT) index was calculated as the percentage of serum iron in the total serum iron-binding capacity. The corrected reticulocyte count was calculated as the reticulocyte count multiplied by the hematocrit, divided by 45.
Definition of bleeding-related GI lesions on EGD and colonoscopy
We investigated the EGD and colonoscopy findings for each patient, which had been made within three months interval. All EGD and colonoscopy procedures were performed either by gastroenterology fellows with a gastroenterologist present or by a gastroenterologist alone. Informed consent was obtained from all patients before EGD and colonoscopy. The EGD findings considered to be important sources of GI blood loss included: esophagitis with erosions or ulceration involving at least 5 mm of the mucosal surface of the esophagus; multiple erosive gastritis or duodenitis; severe hemorrhagic gastritis/duodenitis; gastric or duodenal ulcers larger than 0.5 cm in diameter; carcinoma; angiodysplasia; portal hypertensive gastropathy; gastric polyps of more than 1 cm in diameter; and single angioectasias larger than 8 mm in diameter or more than two angioectasias 5 mm in diameter. Hiatal hernia and esophageal varices were not considered to be sources of blood loss. The following lesions were considered to be sources of GI blood loss on colonoscopy: colorectal cancer; one or more polyps more than 1 cm in diameter; colonic ulcer; active colitis; inflammatory bowel disease; and vascular ectasia (as described above). Hemorrhoids and diverticula were not considered to be sources of GI bleeding (15-19).
Statistical analyses
The data are expressed as the mean ± SD unless otherwise indicated. Differences in continuous variables were compared using a t test or ANOVA, and differences in categorical variables were compared using a χ2 test. Receiver operating characteristic (ROC) curves were created with bleeding-related lesions in the GI tract (present versus absent) as the dichotomous variable and peripheral iron indices and hematological variables as the continuous variables. The effect of combining TSAT and serum ferritin was also tested by analysis of the ROC curve (20). A univariate analysis followed by multivariate binary logistic regression was used to analyze the relationships between GI lesions and the relevant parameters. A p value < 0.05 was considered statistically significant, and the statistical analysis was performed using the SPSS v.16.0 software package (SPSS Inc., Chicago, IL).
Results
Patient characteristics
CKD severity was stage 3 in 38 (36.5%) patients, stage 4 in 26 (25.0%) patients, and stage 5 in 40 (38.5%) patients. The baseline demographic and clinical characteristics of the study subjects, stratified by CKD stage, are listed in Table 1. Age, proportion of males, body size and baseline laboratory data did not differ between the three CKD stages. However, hemoglobin, hematocrit and serum ferritin was significantly different between patients with CKD stage 3 and with CKD stage 5.
Baseline characteristics of anemic CKD patients
| CKD stage | P | |||
|---|---|---|---|---|
| 3 | 4 | 5 | ||
| Age (years) | 63.9±11.8 | 65.1±12.6 | 63.8±13.8 | 0.831 |
| Male (%) | 15 (39.5) | 13 (50.0) | 24 (60.0) | 0.194 |
| Height (cm) | 156.6±8.6 | 158.4±8.4 | 161.0±8.6 | 0.113 |
| Weight (kg) | 59.1±10.3 | 61.7±9.4 | 60.5±10.0 | 0.599 |
| eGFR (mL/min per 1.73 m2) | 43.3±10.0 | 22.2±3.5* | 8.8±4.0*,** | <0.001 |
| Hemoglobin (g/dL) | 10.1±1.8 | 9.7±1.5 | 8.7±1.9* | 0.003 |
| Hematocrit (%) | 30.5±5.2 | 28.8±4.6 | 25.9±5.5* | 0.001 |
| MCV (fl) | 89.2±8.6 | 89.4±6.3 | 91.9±5.0 | 0.166 |
| MCH (pg) | 29.6±3.6 | 30.0±2.2 | 30.9±1.7 | 0.102 |
| MCHC (%) | 33.1±1.7 | 33.6±1.0 | 33.6±1.2 | 0.292 |
| Iron (μg/dL) | 48.4±27.8 | 53.9±24.2 | 55.6±24.4 | 0.533 |
| TIBC (μg/dL) | 228.3±58.9 | 247.5±63.5 | 223.0±62.5 | 0.355 |
| TSAT (%) | 22.0±12.1 | 22.6±11.0 | 25.0±10.8 | 0.487 |
| Ferritin (ng/mL) | 152.5±106.8 | 188.1±162.0 | 251.8±169.8* | 0.035 |
| Corrected reticulocyte count (%) | 0.81±0.42 | 0.96±0.55 | 0.68±0.35 | 0.089 |
CKD, chronic kidney disease; eGFR, estimated glomerular filtration rate; MCV, Mean corpuscular volume; MCH, mean corpuscular hemoglobin; MCHC, Mean corpuscular hemoglobin concentration; TIBC, total iron-binding capacity; TSAT, transferrin saturation index.
*P < 0.05 vs. CKD stage 3, **P < 0.05 vs. CKD stage 4
Bleeding-related GI lesions on endoscopy
Of the total patients, 55 (52.9%) had lesions consistent with GI bleeding, and upper GI lesions (esophageal, gastric and duodenal lesions) were identified in 41 patients (39.4%) (Table 2). The stomach was the most frequently involved site and erosive gastritis was the most common lesion. The prevalence of esophageal and duodenal lesions did not differ between the patients with CKD stages 3-5. However, gastric lesions were found more frequently in patients with CKD stage 5 than in patients with CKD stage 3 or 4. Colonic lesions were identified in 24 patients (23.1%). The most common lesion was a colonic polyp of more than 1 cm. The prevalence of colonic lesions did not differ between patients with CKD stages 3-5 (p = 0.535).
Prevalence of bleeding-related GI lesions identified by endoscopy
| Total | CKD stage | P | ||||
|---|---|---|---|---|---|---|
| 3 | 4 | 5 | ||||
| Esophageal lesion (%) | 4 (3.8) | 1 (2.6) | 1 (3.8) | 2 (5.0) | 1.00 | |
| Erosive esophagitis(%) | 2 (1.9) | 0 | 1 (3.8) | 1 (2.5) | 0.716 | |
| Ulcer (%) | 2 (1.9) | 1 (2.6) | 0 | 1 (2.5) | 1.00 | |
| Gastric lesion (%) | 36 (34.6) | 10 (26.3) | 6 (23.1) | 20 (50.0)*, ** | 0.032 | |
| Ulcer (%) | 5 (4.8) | 1 (2.6) | 1 (3.8) | 3 (7.5) | 0.641 | |
| Erosive gastritis (%) | 18 (17.3) | 5 (13.2) | 3 (11.5) | 10 (25.0) | 0.265 | |
| Hemorrhagic gastritis (%) | 8 (7.7) | 1 (2.6) | 2 (7.7) | 5 (12.5) | 0.302 | |
| Polyp (%) | 4 (3.8) | 2 (5.3) | 1 (3.8) | 1 (2.5) | 0.832 | |
| Vascular ectasia | 1 (1.0) | 1 (2.6) | 0 | 0 | 0.615 | |
| Portal hypertensive gastropathy (%) | 1 (1.0) | 0 | 0 | 1 (2.5) | 1.00 | |
| Duodenal lesion (%) | 12 (11.5) | 1 | 5 (19.2) | 6 (15.0) | 0.094 | |
| Ulcer (%) | 11 (10.6) | 1 (3.2) | 6 (27.3) | 4 (10.0) | 0.057 | |
| Erosive duodenitis (%) | 2 (1.9) | 1 (2.6) | 1 (3.8) | 0 | 0.522 | |
| Hemorrhagic duodenitits (%) | 2 (1.9) | 0 | 0 | 2 (5.0) | 0.338 | |
| Colonic lesions (%) | 24 (23.1) | 9 (23.7) | 4 (15.4) | 11 (27.5) | 0.535 | |
| Polyp (%) | 12 (11.5) | 4 (10.5) | 3 (11.5) | 5 (12.5) | 1.00 | |
| Colitis (%) | 8 (7.7) | 3 (7.9) | 0 | 5 (12.5) | 0.187 | |
| Ulcer (%) | 3 (2.9) | 0 | 1 (3.8) | 2 (5.0) | 0.466 | |
| Cancer (%) | 3 (2.9) | 3 (7.9) | 0 | 0 | 0.061 | |
GI, gastrointestinal; CKD, chronic kidney disease.
* P < 0.05 vs. CKD stage 3, **P < 0.05 vs. CKD stage 4
Diagnostic utility of iron indices and hematological variables for bleeding-related GI lesions
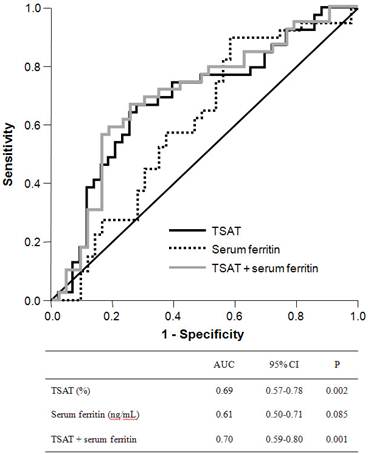
ROC curves were plotted to evaluate the diagnostic utility of peripheral iron, red blood cell, and reticulocyte indices for any endoscopic lesion consistent with blood loss (Figure 1). The area under the ROC curve (AUC) for TSAT was 0.69 (95% confidence interval (CI), 0.57-0.78) and was significantly higher than the indeterminate value of 0.5 (p = 0.002). The best cutoff threshold of TSAT for GI lesions was 21.0% (sensitivity, 0.67, specificity, 0.72) and the odds ratio for this cutoff value was 2.39. The AUC for serum ferritin was 0.61 (95% CI, 0.50-0.71), with marginal statistical significance (p = 0.085). The combination of TSAT and serum ferritin had an AUC of 0.70 (95% CI, 0.59-0.80, p = 0.001). We also evaluated the diagnostic accuracy of hemoglobin, corrected reticulocyte count, MCV, MCH, and MCHC levels in identifying anemic GI lesions, but none of these variables had a significant AUC value.
Receiver-operating characteristic curve of TSAT, serum ferritin and their combination (TSAT + serum ferritin) to predict bleeding-related GI lesions. The area under the ROC curve was 0.69 for TSAT (95% CI, 0.57-0.78; P = 0.002), 0.61 for serum ferritin (95% CI, 0.50-0.71, P = 0.085) and 0.70 for combination of TSAT and serum ferritin (95% CI, 0.59-0.80, P = 0.001).
To estimate the clinically relevant thresholds for TSAT, serum ferritin, and their combination, the sensitivity, specificity, and positive and negative predictive values of these indices were calculated for different cutoff levels (Table 3). Several cutoff values for TSAT and serum ferritin yielded a reasonable trade-off between sensitivity and specificity. The sensitivity and specificity achieved with a cutoff value for TSAT < 20% were 0.59 (95% CI, 0.42-0.74) and 0.74 (95% CI, 0.59-0.87), respectively. For the combination of TSAT and serum ferritin, cutoff values of TSAT < 20% or serum ferritin level < 75 ng/mL provided useful diagnostic accuracy, as follows: sensitivity 0.68 (95% CI, 0.51-0.81), specificity 0.70 (95% CI, 0.53-0.82), positive predictive value of 0.68 (95% CI, 0.51-0.81), and negative predictive value of 0.70 (95% CI, 0.53-0.83).
Clinically relevant thresholds for TSAT, serum ferritin, and their combinations to predict bleeding-related GI lesions
| Sensitivity | Specificity | Positive predictive value | Negative predictive value | |
|---|---|---|---|---|
| TSAT <15% | 0.38 (0.23-0.56) | 0.86 (0.72-0.95) | 0.71 (0.48-0.89) | 0.61 (0.47-0.73) |
| TSAT <20% | 0.59 (0.42-0.74) | 0.74 (0.59-0.87) | 0.68 (0.50-0.83) | 0.67 (0.52-0.80) |
| TSAT <25% | 0.74 (0.58-0.87) | 0.60 (0.44-0.75) | 0.63 (0.48-0.77) | 0.72 (0.55-0.86) |
| TSAT <20 % or ferritin < 50 ng/mL | 0.58 (0.41-0.73) | 0.74 (0.59-0.87) | 0.68 (0.50-0.83) | 0.65 (0.50-0.78) |
| TSAT <20 % or ferritin < 75 ng/mL | 0.68 (0.51-0.81) | 0.70 (0.54-0.83) | 0.68 (0.51-0.81) | 0.70 (0.54-0.83) |
| TSAT <20 % or ferritin < 100 ng/mL | 0.68 (0.51-0.81) | 0.63 (0.47-0.77) | 0.63 (0.47-0.77) | 0.68 (0.51-0.81) |
95% confidence interval presented in parenthesis. GI, gstrointestinal; TSAT, transferrin saturation index.
Impact of CKD stage 5 on prediction for bleeding-related GI lesions
We used multivariable logistic regression to evaluate the independent predictors for bleeding-related GI lesions. The final model included TSAT, serum ferritin, and stage 5 CKD (Table 4). TSAT and stage 5 CKD made a significant contribution to the detection of bleeding-related GI lesions. The chances of GI lesions increased by 6% for each 1% reduction in TSAT, and patients with CKD stage 5 had a 4.1-fold greater risk of endoscopic lesions than that of patients with CKD stages 3 and 4.
Relationship between the iron indices, CKD stages and bleeding-related GI lesions in a model of multivariable logistic regression test
| β | SE | Wald | df | P | Exp(B) (95% CI) | |
|---|---|---|---|---|---|---|
| TSAT (per 1% increment) | -0.06 | 0.03 | 6.18 | 1 | 0.013 | 0.94 (0.89-0.99) |
| Serum ferritin (per 1 ng/mL increment) | -0.003 | 0.002 | 3.11 | 1 | 0.078 | 1.00 (0.99-1.00) |
| CKD stage 5 (versus CKD stage 3 and 4) | 1.40 | 0.56 | 6.29 | 1 | 0.012 | 4.10 (1.36-12.11) |
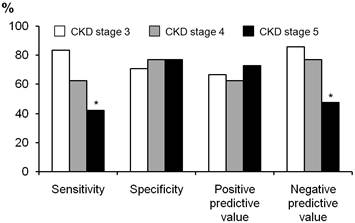
We compared the diagnostic usefulness of a cut-off value for TSAT of < 20% between patients with CKD stages 3-5 (Figure 2). The specificity and positive predictive value were both in the range 0.65-0.75, and did not differ between stages CKD 3-5. However, the sensitivity and negative predictive value were poor in patients with CKD stage 5 (0.47 and 0.50, respectively), and were significantly lower than those of patients with CKD stage 3 (p = 0.032 for sensitivity and p = 0.034 for negative predictive value).
Comparison of diagnostic utility of cut-off value TSAT < 20% between patients with CKD stages 3 to 5. The sensitivity and negative predictive value was significantly lower than those of patients with CKD stages 3. *P < 0.05 vs. CKD stage 3.
Discussion
This study was a diagnostic evaluation of peripheral iron indices and hematological variables for predicting GI lesions consistent with blood loss. We demonstrated that TSAT is a useful and independent predictor of anemic endoscopic lesions, but the other variables showed no significant diagnostic utility. Our study also indicated that patients with CKD stage 5 showed higher prevalence of gastric lesions than patients with CKD stage 3 or 4.
Several previous reports have indicated that upper GI inflammation is prevalent in patients with dyspeptic renal failure (21, 22). In our study, 40% of patients were identified with bleeding-related upper GI lesions, and multiple gastric erosions and duodenal ulcer were the most frequent lesions. In addition, we found that gastric lesions were more frequent in patients with CKD stage 5 than in patients with CKD stage 3 or 4. These findings suggest the relationship between uremia levels and GI mucosal injury, and some research has also indicated that GI bleeding is attributable to the effects of uremia on the GI mucosa (23, 24).
GI blood loss is closely associated with iron deficiency anemia, and the typical markers of iron deficiency assessed in CKD patients were serum ferritin and TSAT. Of these, TSAT has some advantages over ferritin in certain respects. TSAT has shown higher sensitivity for iron deficiency than serum ferritin, and using the ratio of the two variables can reduce the effects of noniron-related confounding factors (25, 26). In the present study, we have demonstrated that TSAT is a useful and independent indicator predicting bleeding GI lesions, but serum ferritin alone did not show significant diagnostic utility. These findings might be associated with the advantages of TSAT in detecting iron deficiency, and we suggest that TSAT is a useful marker in deciding the GI workup.
Proinflammatory cytokines directly increase the synthesis of ferritin, so elevated serum ferritin levels neither rule out iron deficiency nor indicate adequate or elevated iron stores in patients with CKD. However, low levels of serum ferritin are highly specific for iron deficiency in patients with CKD, and low serum ferritin is the most powerful indicator of GI lesions in the general population (10, 27). In our study, the combination of TSAT < 20% or serum ferritin levels < 75 ng/mL increased the sensitivity of the detection of anemic GI lesions by 9% (from 59% to 68%) compared with TSAT < 20% alone. These findings suggest that a low level of serum ferritin is an index that can support TSAT in the determination of a GI workup.
Occult GI blood loss causes hypochromasia, microcytosis, and increased erythropoiesis. Therefore, the values for MCV, MCH, and MCHC decrease and the corrected reticulocyte count increases. However, these variables were not predictive of endoscopically detected bleeding lesions in our study. These findings are thought to be associated with the CKD status of the patient, because the chronic inflammation and erythropoietin deficiency that are prevalent in CKD patients could limit the appropriate red cell changes and reticulocyte increments (28-30). Therefore, we suggest that red cell indices and corrected reticulocyte counts are not useful indicators for GI workup for bleeding-related lesions in patients with CKD.
The patients with CKD stage 5 had a 4.1-fold greater risk of bleeding-related lesions according to our multivariable logistic regression analysis. A cutoff value for TSAT of < 20% showed lower sensitivity and a lower negative predictive value in patients with CKD stage 5 than in patients with CKD stage 3, despite their higher bleeding risk. These findings suggest that TSAT is not a useful parameter for detecting anemia-related GI lesions in patients with stage 5 CKD, and that more reliable indicators are needed for these patients. From this perspective, we propose the fecal occult blood test as an indicator for GI workup, because the positive predictive value of a positive fecal occult blood test increases as the severity of CKD increases (31). Therefore, further studies are needed to demonstrate that combination of fecal occult blood test with iron indices had a better diagnostic accuracy.
Our study had some limitations. First, the practical utility of the indices studied was limited because we did not include patients who were treated with iron or erythropoiesis-stimulating agents. Second, we did not include inflammation markers, such as C-reactive protein or tumor necrosis factor-α. Nevertheless, all the variables included in this study are commonly used in day-to-day practice and our results should be useful in clinical decisions about GI workup.
In conclusion, TSAT is a useful indicator in determining the GI workup in anemic patients with CKD stages 3-5. Patients with CKD stage 5 are at greater risk of bleeding-related GI lesions and TSAT should be used with caution in these patients.
Conflict of Interest
The authors have declared that no conflict of interest exists.
References
1. Astor BC, Muntner P, Levin A. et al. Association of kidney function with anemia: the Third National Health and Nutrition Examination Survey (1988-1994). Arch Intern Med. 2002;162:1401-1408
2. Levin A, Foley RN. Cardiovascular disease in chronic renal insufficiency. Am J Kidney Dis. 2000;36(6 Suppl 3):S24-S30
3. Locatelli F, Conte F, Marcelli D. The impact of haematocrit levels and erythropoietin treatment on overall and cardiovascular mortality and morbidity--the experience of the Lombardy Dialysis Registry. Nephrol Dial Transplant. 1998;13:1642-1644
4. KDOQI; National Kidney Foundation. KDOQI Clinical Practice Guidelines and Clinical Practice Recommendations for Anemia in Chronic Kidney Disease. Am J Kidney Dis. 2006;47(5 Suppl 3):S11-S145
5. Van Wyck DB, Roppolo M, Martinez CO. et al. A randomized, controlled trial comparing IV iron sucrose to oral iron in anemic patients with nondialysis-dependent CKD. Kidney Int. 2005;68:2846-2856
6. Gotloib L, Silverberg D, Fudin R. et al. Iron deficiency is a common cause of anemia in chronic kidney disease and can often be corrected with intravenous iron. J Nephrol. 2006;19:161-167
7. Silverberg DS, Iaina A, Peer G. et al. Intravenous iron supplementation for the treatment of the anemia of moderate to severe chronic renal failure patients not receiving dialysis. Am J Kidney Dis. 1996;27:234-238
8. Fishbane S, Maesaka JK. Iron management in end-stage renal disease. Am J Kidney Dis. 1997;29:319-333
9. Stancu S, Stanciu A, Zugravu A. et al. Bone marrow iron, iron indices, and the response to intravenous iron in patients with non-dialysis-dependent CKD. Am J Kidney Dis. 2010;55:639-647
10. Goddard AF, James MW, McIntyre AS. et al. Guidelines for the management of iron deficiency anaemia. Gut. 2011;60:1309-1316
11. Brugnara C. Iron deficiency and erythropoiesis: new diagnostic approaches. Clin Chem. 2003;49:1573-1578
12. Rockey DC, Cello JP. Evaluation of the gastrointestinal tract in patients with iron-deficiency anemia. N Engl J Med. 1993;329:1691-1695
13. Rockey DC. Occult gastrointestinal bleeding. N Engl J Med. 1999;341:38-46
14. Poggio ED, Wang X, Greene T. et al. Performance of the modification of diet in renal disease and Cockcroft-Gault equations in the estimation of GFR in health and in chronic kidney disease. J Am Soc Nephrol. 2005;16:459-466
15. Rockey DC, Koch J, Cello JP. et al. Relative frequency of upper gastrointestinal and colonic lesions in patients with positive fecal occult-blood tests. N Engl J Med. 1998;339:153-159
16. Serefhanoglu S, Buyukasik Y, Emmungil H. et al. Identification of clinical and simple laboratory variables predicting responsible gastrointestinal lesions in patients with iron deficiency anemia. Int J Med Sci. 2010;8:30-38
17. Green BT, Rockey DC. Gastrointestinal endoscopic evaluation of premenopausal women with iron deficiency anemia. J Clin Gastroenterol. 2004;38:104-109
18. Majid S, Salih M, Wasaya R. et al. Predictors of gastrointestinal lesions on endoscopy in iron deficiency anemia without gastrointestinal symptoms. BMC Gastroenterol. 2008;8:52
19. Powell N, McNair A. Gastrointestinal evaluation of anaemic patients without evidence of iron deficiency. Eur J Gastroenterol Hepatol. 2008;20:1094-1100
20. Tripepi G, Jager KJ, Dekker FW. et al. Diagnostic methods 2: Receiver operating characteristic (ROC) curves. Kidney Int. 2009;76:252-256
21. Khedmat H, Ahmadzad-Asl M, Amini M. et al. Gastro-duodenal lesions and Helicobacter pylori infection in uremic patients and renal transplant recipients. Transplant Proc. 2007;39:1003-1007
22. Doherty CC. Peptic ulcer and chronic renal failure. Ulster Med J. 1979;48:145-154
23. Lieber CS, Lefevre A. Ammonia as a source of gastric hypoacidity in patients with uremia. J Clin Invest. 1959;38:1271-1277
24. Shirazian S, Radhakrishnan J. Gastrointestinal disorders and renal failure: exploring the connection. Nat Rev Nephrol. 2010;6:480-492
25. Wish JB. Assessing iron status: beyond serum ferritin and transferrin saturation. Clin J Am Soc Nephrol. 2006;1(Suppl 1):S4-S8
26. Kalantar-Zadeh K, Kalantar-Zadeh K, Lee GH. The fascinating but deceptive ferritin: to measure it or not to measure it in chronic kidney disease? Clin J Am Soc Nephrol. 2006;1(Suppl 1):S9-S18
27. Rockey DC. Occult and obscure gastrointestinal bleeding: causes and clinical management. Nat Rev Gastroenterol Hepatol. 2010;7:265-279
28. Lankhorst CE, Wish JB. Anemia in renal disease: diagnosis and management. Blood Rev. 2010;24:39-47
29. Keel SB, Abkowitz JL. The microcytic red cell and the anemia of inflammation. N Engl J Med. 2009;361:1904-1906
30. Cavill I. Iron and erythropoietin in renal disease. Nephrol Dial Transplant. 2002;17(Suppl 5):19-23
31. Bini EJ, Kinkhabwala A, Goldfarb DS. Predictive value of a positive fecal occult blood test increases as the severity of CKD worsens. Am J Kidney Dis. 2006;48:580-586
Author contact
![]() Corresponding author: Suk Young Kim, MD, PhD. Division of Nephrology, Department of Internal Medicine, Daejeon St. Mary's Hospital, 520-2 Daeheung-Dong, Jung-Ku, 301-804, Daejeon, Korea. Phone: +82-42-220-9335, Fax: +82-42-220-9669. E-mail: alterego54ac.kr
Corresponding author: Suk Young Kim, MD, PhD. Division of Nephrology, Department of Internal Medicine, Daejeon St. Mary's Hospital, 520-2 Daeheung-Dong, Jung-Ku, 301-804, Daejeon, Korea. Phone: +82-42-220-9335, Fax: +82-42-220-9669. E-mail: alterego54ac.kr