Impact Factor ISSN: 1449-1907

 Global reach, higher impact
Int J Med Sci 2012; 9(1):93-102. doi:10.7150/ijms.9.93 This issue Cite
Research Paper
Electrocardiographic Findings in Patients with Polycythemia Vera
Mehmet Kayrak1, Kadir Acar2, Enes Elvin Gul1 ![]() , Turyan Abdulhalikov1, Murat Bağlıcaklıoğlu3, Osman Sonmez4, Zeynettin Kaya1, Hatem Arı1
, Turyan Abdulhalikov1, Murat Bağlıcaklıoğlu3, Osman Sonmez4, Zeynettin Kaya1, Hatem Arı1
1. Department of Cardiology, Meram School of Medicine, Selcuk University, Konya, Turkey.
2. Department of Hematology, Gazi Medical School, Gazi University, Ankara, Turkey.
3. Department of Internal Medicine, Meram School of Medicine, Selcuk University, Konya, Turkey.
4. Bezmialem University, Faculty of Medicine, Cardiology Department, Istanbul, Turkey.
Received 2011-8-17; Accepted 2011-11-23; Published 2011-12-14
Abstract
Background: The 12-lead surface electrocardiogram (ECG) is a useful tool to predict both atrial and ventricular arrhythmias via P-wave and QT measurements and its derivatives. Polycythemia vera (PV) is a chronic myeloproliferative disorder associated with cardiovascular events. The aim of this study was to assess ECG findings of patients with PV.
Method and materials: Sixty patients with PV (34 male, mean age 58±11 years) and 60 age and gender-matched healthy volunteers were enrolled into the study. From the 12-lead surface ECG, P-wave and both conventional QT measurements and transmyocardial repolarization parameters (Tpeak-Tend interval (Tp-Te) and derivatives) were evaluated digitally by two experienced cardiologists. In addition, a novel parameter, Pi was calculated digitally as the standard deviation of the P-wave duration across the 12 ECG leads.
Results: QT duration and corrected QT interval were significantly longer in the PV group compared to healthy controls (p<0.01 and p<0.01, respectively). The Tp-Te was longer and the Tp-Te/QT ratio was significantly higher in the PV group compared to the controls. P-wave analyses showed that all P-wave parameters including Pmax, Pmin, P dispersion, and Pi were significantly prolonged in PV patients compared to the controls. The increase of both Tp-Te and P max in the PV group was independent of age, BMI, diabetes and hypertension, gender, systolic blood pressure, hemoglobin, hematocrit, left atrial dimension, left ventricular end-diastolic diameter and early deceleration time in a univariate analysis of co-variance model (F=11.097, p=0.001 and F=31.537, p=0.0001, respectively).
Conclusion: The present study demonstrated that PV may be associated with electrocardiographic abnormalities of both atrium and ventricle.
Keywords: Polycythemia Vera, electrocardiographic abnormalities, atrium, ventricle
Introduction
Polycythemia vera (PV) is a chronic myeloproliferative disorder characterized by increased formation of red blood cells. Bleeding and thrombosis are major causes of morbidity and mortality in patients with PV, occurring in 40 to 60% of the patients (1-2). Thrombotic complications include acute cerebrovascular events, myocardial infarctions, peripheral vascular occlusions, pulmonary infarctions, and venous thromboses. The most common cause of death is myocardial infarction and heart failure (3). The precise mechanism causing this thrombotic tendency is not yet well understood. The hematocrit is the only laboratory parameter that shows clear association with thrombotic complications (4).
P-wave measurements are frequently used in clinical practice to predict atrial arrhythmias, especially atrial fibrillation (AF). It is well known that AF is associated with thromboembolic events (5). PV is a myeloproliferative disorder associated with both hyperviscosity and increase of total plasma volume which may cause atrial abnormalities. In addition, relation between hyperviscosity and AF was previously demonstrated (6). Caimi et al. (6) have suggested that hyperviscosity is frequent in patients with AF. Although mechanisms of in situ arterial thrombosis are known, the issue of thromboembolism remains controversial in patients with PV (7). Potentially, AF may contribute to arterial thrombus formation and embolism in patients with PV. However, P-wave measurements which are useful tool to predict AF have not yet been investigated in patients with PV.
Conventional QT parameters and transmyocardial repolarization parameters including Tpeak-Tend interval and derivatives (Tpeak-Tend dispersion and Tpeak-Tend/QT) have been used to predict cardiac arrhythmias in a number of clinical conditions with increased arrhythmia risk (8-10). About half a century ago, left ventricular (LV) hypertrophy was demonstrated in patients with PV by using 12-lead ECG. However, repolarization abnormalities were not investigated (11). Nevertheless, LV hypertrophy was related to increased total plasma volume (11). Potentially deleterious effects of hyperviscosity and LV hypertrophy on repolarization parameters have not yet been examined in patients with PV. In the present study, we aimed to evaluate electrocardiographic P-wave characteristics and ventricular repolarization parameters in patients with PV.
Method and Materials
Study Population
This is a cross-sectional case control study which was conducted at the hematology department, Selcuk University, in Konya, Turkey. Sixty PV patients (34 males, mean age 58±11 years) and 60 age-matched healthy subjects were enrolled into the study. The diagnosis of PV was made according to World Health Organization criteria (12). Included patients gave their verbal and written consent for participation in the study. The study was approved by the local ethical committee of Selcuk University. All the patients in PV group used acetylsalicylic acid (100 mg per day) for the prophylaxis of thrombosis. Most of the patients (45 of 60 patients, 75%) were on hydroxyurea (HU) (1.0 mg daily) treatment. Exclusion criteria were: history of coronary artery disease, congestive heart failure, congenital or acquired arrhythmia syndromes, use of drugs that lengthen the QT interval, current AF, bundle branch block, atrioventricular blocks, and unmeasurable T waves (<0.15 mV) on surface ECG. Blood pressure was measured with a mercury sphygmomanometer according to ESC/ESH guidelines (13).
EGG measurements
All patients had a standard surface 12-lead ECG recorded with a 50 mm/s paper speed at 10 mm/1mV amplitude. ECGs were performed while the patients were supine and breathing normally. The ECGs were scanned at a 600 dpi resolution and measurements made by electronic cursor from the screen by two experts who were blinded to the clinical status of the study population. Three consecutive ECG complexes were analyzed and given averaged measures for each lead.
Regional and transmyocardial repolarization ECG parameters
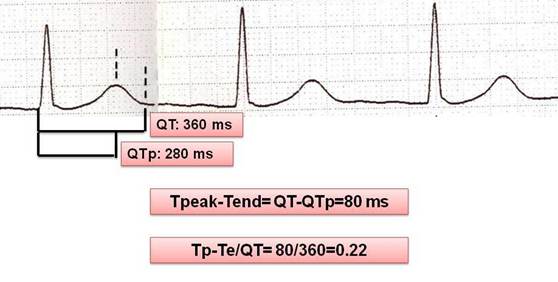
The QT intervals were measured from the onset of the first deflection of the QRS complex to the end of the T wave in all the 12 leads. If the T wave was flat or the end of the T wave was difficult to define, or if the T wave amplitude was <0.15 mV, the lead was excluded from the measurement. The end of the QT interval was defined as the intersection of terminal part of the T wave and the isoelectric line. If a U wave interrupted the T wave before it returned to baseline, the end of the QT interval was defined as the nadir between T and U waves. Corrected QT interval (cQT) was calculated using Bazett's formula (cQT=QT/√R-R interval). cQT dispersion (cQTd) was defined as the difference between maximum cQT and minimum cQT. The interval from the trigger point (QRS onset) to the peak of T-wave was defined as QT peak interval.
Tp-Te interval was defined as the interval between QT peak and QT end (Tp-Te=QTend-QTpeak). The difference between maximum Tp-Te and minimum Tp-Te was defined as Tp-Te dispersion. The (Tp-Te)/QT ratio was also calculated (Figure 1). Intra- and inter-observer difference of Tp-Te was 7.7% and 9.8%, respectively.
Measurement of repolarization parameters on 12-lead ECG sample.
P-wave measurements
P-wave indices (P max, P min, and Pd) were measured in all 12 leads. P max was defined as the longest and P min as the shortest P-wave duration measured from the 12-lead ECG. Pd was defined as the difference between P max and P min (Pd=P max-P min). Pi was calculated digitally as the standard deviation (SD) of the P-wave duration across the 12 ECG leads. The intraobserver and interobserver coefficients of variation, standard deviation of differences between two observations divided by the mean value and expressed as a percentage, for the P-wave dispersion were found to be 8.8% and 3.8%, respectively.
Conventional Echocardiography
Examinations were performed with a Philips EnVisor C HD ultrasound machine (Royal Philips Electronics, Bothell, WA, USA) with a 2.5 MHz transducer by two experienced cardiologists, who were blinded to the patients' clinical and laboratory status. All measurements were performed during normal respiration. The LV ejection fraction (EF) was assessed by the modified biplane Simpson method (14) and the mean of three consecutive measurements was used. Cardiac dimensions were measured according to the recommendations of the American Society of Echocardiography (ASE) by M-mode and two-dimensional (2D) echo (15). 2D mode echocardiography was used to assess the LV mass (LVM) using the methodology of Devereux et al. (16).
Statistical analysis
The statistical analyses were performed with the help of the Statistical Package for Social Sciences (SPSS for Windows) software (version 15.0) (SPSS Inc., Chicago, IL, USA). All data are expressed as the mean ± SD. Differences between parametric variables of the two groups were assessed by the Student-t test. The relation between the categorical variables was determined by the chi-square test. The distribution of the variables was analyzed with the Kolmogorow-Smirnow test. A Univariate Analysis of Covariance (ANCOVA) was applied to adjust for differences in age, body mass index (BMI), diabetes, hypertension, gender, systolic blood pressure (SBP), hemoglobin, hematocrit, left atrial dimension (LAD), left ventricular end-diastolic diameter (LVEDD) and early deceleration time (EDT) in general linear model. Tp-Te and/or P max were accepted as dependent variables, patient group was entered as a fixed factor and other variables, age, BMI, diabetes, hypertension, gender, SBP, hemoglobin, hematocrit, LAD, LVEDD and EDT were entered as covariates into the ANCOVA model. A p-value under 0.05 was considered statistically significant. Power analysis was performed by using a Minitab 16 packet program. Sample volume was calculated as 56 for each group to determine 10 ms difference of Tp-Te with 80% power. Because of probability of inadequate record quality of ECGs, a total of 60 subjects were enrolled to study.
Results
The demographic, general, and echocardiographic characteristics of the study population are listed in Table 1. There were no significant differences between the groups regarding to age, gender, body-mass index, or blood pressure levels. Hemoglobin and hematocrit levels were significantly higher in the PV group than in the control group (p<0.01 and p<0.01, respectively). The presence of diabetes mellitus and hypertension was similar between groups (Table 1). All patients were under antihypertensive and oral antidiabetic treatments. The main antihypertensive medication of study population was angiotensine-converting enzyme inhibitors. Of the 2D echocardiographic measurements, LV dimensions, and ejection fraction (EF) were similar in both groups; only LVM was significantly elevated in the PV group compared to the healthy controls (160±36 g vs. 135±34 g, p=0.04; respectively) (Table 1).
Demographic, laboratory, and echocardiographic characteristics of the study population.
| Control | PV | p-Value | |
|---|---|---|---|
| (n=60) | (n=60) | ||
| Age (years) | 55±10 | 58±10 | NS |
| Gender: Female / Male (n) | 31/29 | 26/34 | NS |
| HT (n) | 21 | 19 | NS |
| DM (n) | 10 | 7 | NS |
| BMI (kg/m2) | 25±1.6 | 27±2.0 | NS |
| SBP (mmHg) | 121±12 | 128±20 | NS |
| DBP (mmHg) | 76±7 | 81±16 | NS |
| Heart rate (bpm) | 75±8 | 76±9 | NS |
| Hemoglobin (g/dL) | 13.3±1.2 | 15.7±1.9 | <0.01 |
| Hematocrit (%) | 42.2±2.5 | 48.7±6.6 | <0.01 |
| LVEDD (cm) | 4.5±0.3 | 4.6±0.5 | NS |
| LVESD (cm) | 2.7±0.3 | 2.9±0.5 | NS |
| IVS (cm) | 1.0±0.2 | 1.0±0.1 | NS |
| PW (cm) | 0.9±0.1 | 0.9±0.1 | NS |
| EF Simpson (%) | 62±4 | 62±5 | NS |
| LVM (gr) | 135±34 | 160±36 | 0.04 |
| LA (cm) | 3.4±0.4 | 3.5±0.5 | NS |
HT, hypertension; BMI. Body-mass index; SBP. Systolic blood pressure; DBP. Diastolic blood pressure; LVEDD, left ventricle end-diastolic dimension; LVESD, left ventricle end-systolic dimension; IVS, interventricular septum; PW, posterior wall; EF, ejection fraction; LVMI, left ventricular mass ; LA, left atrium; NS. Non-significant (p>0.05).
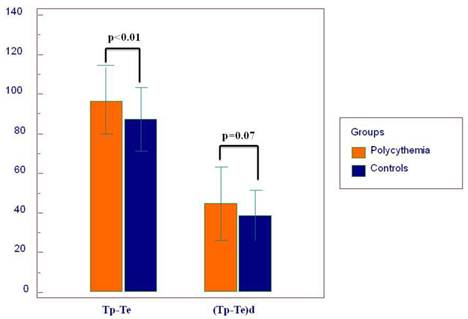
Twelve-lead surface ECG analysis of atrial and ventricular arrhythmia indices are demonstrated in Table 2. QT and QTc were significantly prolonged in patients with PV compared to controls (p<0.01 and p<0.01, respectively). Other conventional QT parameters were similar between the two groups. Transmyocardial repolarization parameters including Tp-Te and Tp-Te/QT were significantly higher in the PV group compared to the healthy subjects (Tp-Te p=0.003 and Tp-Te/QT p=0.02, respectively) (Figure 2). (Tp-Te)d was pretend to be increased in PV patients compared to controls (p=0.07) (Table 2). We have found that in PV group, some P wave parameters were positively correlated with ventricular abnormality parameters compared to healthy controls (Table 4). In addition, patients with P-wave abnormalities did not present with QT prolongation (Table 5).
Electrocardiographic parameters of the PV group and controls.
| Controls | PV | p-Value | |
|---|---|---|---|
| (n=60) | (n=60) | ||
| QT (ms) | 372±32 | 394±29 | <0.01 |
| QTd (ms) | 44±17 | 47±18 | NS |
| QTp (ms) | 287±31 | 297±25 | 0.07 |
| (QTp)d (ms) | 31±13 | 36±13 | 0.08 |
| QTc (ms) | 416±25 | 445±31 | <0.01 |
| cQTd (ms) | 50±21 | 53±21 | NS |
| Tp-Te (ms) | 86±16 | 97±17 | <0.01 |
| (Tp-Te)d (ms) | 39±12 | 45±19 | 0.07 |
| Tp-Te/QT | 0.23±0.04 | 0.24±0.04 | 0.02 |
| QRS duration (ms) | 93±12 | 103±13 | <0.01 |
| Heart rate (bpm) | 76±11 | 78±13 | NS |
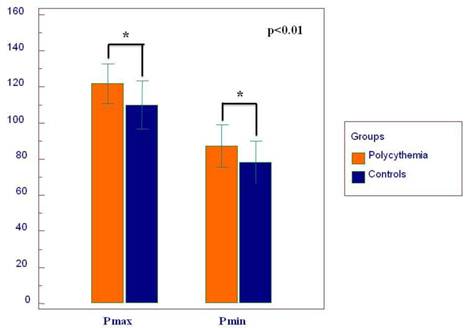
| P max (ms) | 109±13 | 122±11 | <0.01 |
| P min (ms) | 78±12 | 87±12 | <0.01 |
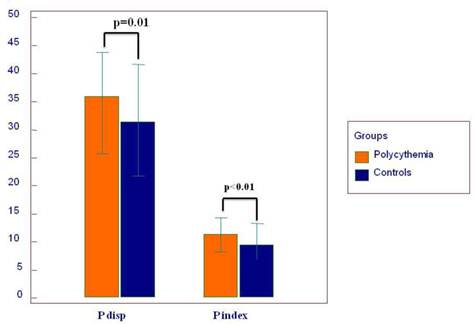
| P disp (ms) | 30±9 | 35±8 | 0.01 |
| P index (ms) | 9.8±2.9 | 11.3±2.9 | <0.01 |
QTd, QT dispersion; QTp, peak QT; (QTp)d, peak QT dispersion; QTc, corrected QT; cQTd; corrected QT dispersion; Tp-Te, difference between T-peak and T-end; (Tp-Te)d, Tp-Te dispersion.
Mean values of transmyocardial repolarization parameters.
Correlations between P-wave and ventricular repolarization parameters.
| QT | QTc | Tp-Te | (Tp-Te)d | Tp-Te/QT | |||||||
|---|---|---|---|---|---|---|---|---|---|---|---|
| PV | C | PV | C | PV | C | PV | C | PV | C | ||
| Pd | r | 0.01 | 0.07 | 0.32 | 0.02 | 0.13 | 0.06 | 0.06 | 0.05 | 0.14 | 0.08 |
| p | 0.94 | 0.57 | 0.01 | 0.87 | 0.32 | 0.64 | 0.64 | 0.71 | 0.27 | 0.52 | |
| Pi | r | 0.10 | 0.02 | 0.36 | 0.06 | 0.20 | 0.05 | 0.16 | 0.03 | 0.18 | 0.06 |
| p | 0.42 | 0.89 | 0.005 | 0.66 | 0.13 | 0.72 | 0.22 | 0.82 | 0.17 | 0.67 | |
| P max | r | 0.38 | 0.27 | 0.31 | 0.22 | 0.32 | 0.18 | 0.48 | 0.05 | 0.18 | 0.66 |
| p | 0.003 | 0.04 | 0.02 | 0.09 | 0.01 | 0.16 | 0.000 | 0.72 | 0.17 | 0.62 | |
| P min | r | 0.36 | 0.24 | 0.04 | 0.23 | 0.20 | 0.25 | 0.41 | 0.01 | 0.06 | 0.15 |
| p | 0.004 | 0.06 | 0.76 | 0.07 | 0.13 | 0.05 | 0.001 | 0.92 | 0.65 | 0.26 | |
PV, polycythemia vera; C, controls.
The frequency of patients with PV and controls according to abnormal P max and QTc values.
| P max < 120 ms | P max ≥ 120 ms | p-Value | ||
|---|---|---|---|---|
| PV | QTc < 470 ms | 19 | 32 | 0.32 |
| QTc > 470 ms | 3 | 7 | ||
| C | QTc < 470 ms | 41 | 19 | --- |
| QTc > 470 ms | 0 | 0 | ||
PV, polycythemia vera; C, controls.
Results of Univariate Analysis of Variance (ANCOVA) for the Tp-Te and P max.
| Variables | Dependent variables | Mean square | F | p-Value | Model R2 |
|---|---|---|---|---|---|
| Patient group | Tp-Tea | 2902.814 | 11.097 | 0.001 | 0.12 |
| P maxb | 4652.813 | 31.537 | 0.0001 | 0.23 | |
| BMI | Tp-Te | 67.570 | 0.280 | 0.59 | 0.13 |
| P max | 4.205 | 0.028 | 0.87 | 0.35 | |
| Age | Tp-Te | 136.296 | 0.496 | 0.483 | 0.09 |
| P max | 566.442 | 3.809 | 0.06 | 0.22 | |
| Gender | Tp-Te | 43.572 | .158 | 0.692 | 0.10 |
| P max | 6.423 | 0.042 | 0.838 | 0.18 | |
| DM | Tp-Te | 1698.926 | 6.495 | 0.012 | 0.12 |
| P max | 707.089 | 4.793 | 0.03 | 0.23 | |
| HT | Tp-Te | 814.922 | 3.028 | 0.08 | 0.11 |
| P max | 1390.708 | 9.808 | 0.002 | 0.26 | |
| Systolic BP | Tp-Te | 5.575 | 0.022 | 0.88 | 0.05 |
| P max | 263.796 | 2.009 | 0.16 | 0.18 | |
| Hb | Tp-Te | 27.846 | 0.110 | 0.74 | 0.07 |
| P max | 155.396 | 1.191 | 0.28 | 0.18 | |
| Htc | Tp-Te | 4.150 | 0.016 | 0.89 | 0.07 |
| P max | 321.301 | 2.519 | 0.12 | 0.20 | |
| LA | Tp-Te | 3.863 | 0.015 | 0.90 | 0.07 |
| P max | 154.268 | 1.182 | 0.28 | 0.18 | |
| LV EDD | Tp-Te | 215.007 | 0.860 | 0.36 | 0.08 |
| P max | 119.653 | 0.912 | 0.34 | 0.18 | |
| EDT | Tp-Te | 281.420 | 1.131 | 0.29 | 0.08 |
| P max | 18.015 | 0.135 | 0.71 | 0.17 | |
| LV mass | Tp-Te | 131,697 | 0.524 | 0.47 | 0.08 |
| P max | 28,527 | 0.215 | 0.64 | 0.17 | |
| QRS duration | Tp-Te | 2521,874 | 9,907 | 0,002 | 0,15 |
| P max | 1667,183 | 11,804 | 0,001 | 0,27 |
In the ANCOVA analysis, Tp-Te and/or P max were accepted as dependent variables, patient groups were entered as a fixed factor and other variables were defined as covariates.
a R2=0.18, adjusted R2=0.12 for the Tp-Te.
b R2=0.45, adjusted R2=0.41 for the P max in theANCOVA model.
Tp-Te was increased in the PV group independent of demographic and echocardiographic findings such as age, BMI, sex, hemoglobin, hematocrit, LVEDD, EDT, and LAD in the ANCOVA model (F=11.097 and p=0.001). Tp-Te was also related with DM and pretends to be related with HT in the ANCOVA model.
Twelve-lead surface ECG analysis of P-wave parameters is presented in Table 2. P max, P min, Pd, and Pi showed significantly higher values in the PV group compared to the controls (Figure 3 and 4). The difference of P max between the two groups was independent of age, BMI, diabetes, hypertension, gender, SBP, hemoglobin, hematocrit, LAD, LVEDD and EDT in the ANCOVA model (F=31.537 and p=0.0001). Also, hypertension and diabetes were independent predictors of P max (F=9.808, p=0.002 and F=4.793, p=0.03, respectively). Pmax pretends to be increased with age in the ANCOVA model (F= 3.809, p=0.06). Statistically, the effect of PV on the ECG was stronger on Pmax than on Tp-Te according to the ANCOVA analysis.
The graph depicts the mean duration of P wave maximum (P max) and P wave minimum (P min).
Mean values of P wave dispersion (P disp) and P index.
Discussion
The present study demonstrated that P-wave measurements showed significantly higher values in patients with PV compared to healthy subjects. In addition, most of repolarization parameters (QT, QTc, Tp-Te, and Tp-Te/QT) were significantly prolonged in patients with PV. The relationship between PV and ECG parameters were independent of demographic features. The present study is the first one, where comprehensive analysis of both ventricular repolarization parameters and P-wave characteristics in PV patients was performed.
Recently, non-invasive ECG methods have been introduced to assess the atrial arrhythmia risk of patients. P-wave duration and dispersion are considered to be one of the most important non-invasive ECG markers (17-18). The increase in P-wave duration is considered an indicator of atrial conduction prolongation and, thus, might be useful in atrial arrhythmia risk stratification. Pd constitutes a recent contribution to the field of noninvasive ECG-prediction of AF (19). Pd represents non-homogeneous and anisotropic distribution of connections between myocardial fibers in atrial tissue (20). Non-homogeneity of atrial conduction, i.e. Pd prolongation, was considered as an independent predictor of AF. In the present study, all of the P wave measurements (Pd, P max, P min, and Pi) were increased in the PV group compared to the control group. PV is frequently associated with thrombotic complications. Also patients with AF have an increased risk for thromboembolic events (5). The relationship between PV and AF with regard to thrombotic complications is an unknown issue. Atrial electrical abnormalities have not been investigated before in patients with PV. Based on the P-wave measurements, our study indicates that patients with PV may have an increased risk of AF development. In addition, Pi was added to the P-wave measurements as a novel parameter in the present study. Pi was increased in the PV group compared to the control group. It is thought that Pi accounts for the differences in atrial conduction across different vectors (21).
Increased non-homogeneity in the repolarization phase of the myocardial action potential can precipitate malignant ventricular arrhythmias (ventricular tachycardia and fibrillation) (22). The duration of the action potential varies between different parts of the myocardium and this difference is defined as dispersion of repolarization so called regional repolarization. A regional repolarization abnormality was represented with conventional QT measurements (QTc, QTd, and etc) in ECG. Regarding transmyocardial repolarization, there are three layers in the myocardium: the endocardial, the M-cell, and the epicardial layer. The myocardial layers can be at different repolarization phases creating transmyocardial non-homogeneities. This transmyocardial non-homogeneity are determined by the ECG parameters Tp-Te, (Tp-Te)d, and Tp-Te/QT ratio in ECG. Thus, an inhomogeneity of both regional and transmyocardial repolarization becomes substrates for re-entry causing ventricular arrhythmias in different populations (23). In the present study, although QT and QTc were higher in the PV group compared to controls, dispersion parameters did not show significant difference between the two groups. Also we found higher Tp-Te duration and Tp-Te/QT ratio in PV patients compared to the healthy subjects. The increase of Tp-Te in the PV group was independent of age, BMI, diabetes and hypertension in a univariate analysis. Based on the study results, transmyocardial repolization was impaired consistent with regional repolarization measurements in PV group. Although (Tp-Te)d was tended to be prolonged in PV patients, both QTd and (Tp-Te)d were comparable in both group. The effect of PV on dispersion parameters was not as strong as measurements related to repolarization duration.
PV is mainly characterized with hyperviscosity. Hyperviscosity is associated with increase of total plasma volume and reduced O2 saturation of the erythrocytes in patients with PV (24). Thus, hyperviscosity may result in an increased myocardial workload and tissue ischemia (25). Myocardial ischemia is associated with prolongation of repolarization parameters in patients with coronary heart disease (9, 26-27). Therefore, we speculated that hyperviscosity may cause to abnormal repolarization via tissue ischemia. In addition, although patients with clinically overt coronary artery disease were excluded from the study, subclinical atherosclerosis and silent myocardial ischemia may affect repolarization parameters in the study group. It was also suggested that there is a strong relation between arterial ischemic complications, including myocardial infarction, and hematocrit levels in patients with PV (25). Recent studies have demonstrated that hyperviscosity is frequent in patients with non-valvular AF (6). Furthermore, hyperviscosity is a possible risk factor for cerebrovascular ischemic complications in patients with AF (28). A possible explanation for the higher values of the P-wave parameters in PV patients might be related to accompanying hyperviscosity. In a univariate analysis, although PV independently affected both atrial and ventricular parameters independent from the patients' demographic features, the effect of PV on the ECG was stronger on Pmax than on Tp-Te according to the ANCOVA model.
Nevertheless, LV hypertrophy secondary to increased workload may also explain the ECG changes in PV patients. Prati et al. (11) firstly described ECG changes secondary to LV hypertrophy in patients with PV. Cobb and colleagues (24) discussed plasma rheology and physiologic consequences of PV, and LV hypertrophy was mentioned in this context. Currently, Devereux et al. (29) stated that increased blood viscosity (especially patients with hematocrit levels above 18 mg/dL) may be a potential determinant of cardiac hypertrophy in patients with systemic hypertension. Therefore, we performed echocardiographic examination in PV patients in the present study. We found an increased LVM in the PV group. Although the study population and the control group were similar in demographic characteristics (age, gender, blood pressure, BMI, physical condition), an increase in LVM was attributed to PV. In addition, previous studies have demonstrated that QT, QTd and Tp-Te prolongation well correlates with LVM (30-32). In conclusion, hyper viscocity may affect repolarization parameters in several ways.
The relation between atrial and ventricular electrical abnormality was also examined in the present study. The duration of QTc was positively corrected with Pd, Pi and Pmax in the PV group. In addition, QT and (Tp-Te)d were positively correlated with Pmax and Pmin in the PV group. In the control group, there was no linear relation between atrial and ventricular electrocardiographic measurements. Thus, PV may concordantly impair both ventricular and atrial electrical activities. However, power of linear association was seen as a mild to moderate. When we used a universal cut-off value for group comparisons, there was no difference between groups. It may be related with small sample size and mild to moderate association. Logically, PV affected both atrial and ventricular electrical activations with same pathway. It needs to future investigations in this area.
The main limitation is that this study is a cross-sectional study and large prospective randomized studies are needed to clarify whether these abnormal ECG parameters translate into clinical outcomes and enable us to predict future arrhythmia development. Most of the PV patients were under cytoreductive therapy, and our results may not be applicable to patients not undergoing this kind of therapy. More importantly, P-wave measurements and ventricular abnormality parameters of PV patients with sinus rhythm were performed using the 12-lead ECG; however, rhythm Holter monitoring and/or an event recorder were not performed on study participants to eliminate paroxysmal AF and ventricular arrhythmias.
In conclusion, our study demonstrated that PV may affect both P-wave and ventricular repolarization parameters.
Acknowledgements
The authors disclose special acknowledgement to Dr. Kjell C. Nikus for his scientific comments on the present manuscript.
Conflict of Interest
The authors have declared that no conflict of interest exists.
References
1. Schafer AI. Bleeding and thrombosis in the myeloproliferative disorders. Blood. 1984Jul;64(1):1-12
2. Murphy S, Iland H, Rosenthal D, Laszlo J. Essential thrombocythemia: an interim report from the Polycythemia Vera Study Group. Semin Hematol. 1986Jul;23(3):177-82
3. Venegoni P, Schroth G. Myocardial infarction and polycythemia vera: how should we treat it? Cathet Cardiovasc Diagn. 1994Jul;32(3):259-61
4. Pearson TC, Wetherley-Mein G. Vascular occlusive episodes and venous haematocrit in primary proliferative polycythaemia. Lancet. 1978Dec9;2(8102):1219-22
5. Fuster V, Rydén LE, Cannom DS, Crijns HJ, Curtis AB, Ellenbogen KA, Halperin JL, Le Heuzey JY, Kay GN, Lowe JE, Olsson SB, Prystowsky EN, Tamargo JL, Wann S, Smith SC Jr, Jacobs AK, Adams CD, Anderson JL, Antman EM, Halperin JL, Hunt SA, Nishimura R, Ornato JP, Page RL, Riegel B, Priori SG, Blanc JJ, Budaj A, Camm AJ, Dean V, Deckers JW, Despres C, Dickstein K, Lekakis J, McGregor K, Metra M, Morais J, Osterspey A, Tamargo JL, Zamorano JL; American College of Cardiology; American Heart Association Task Force; European Society of Cardiology Committee for Practice Guidelines; European Heart Rhythm Association; Heart Rhythm Society. ACC/AHA/ESC 2006 guidelines for the management of patients with atrial fibrillation: full text: a report of the American College of Cardiology/American Heart Association Task Force on practice guidelines and the European Society of Cardiology Committee for Practice Guidelines (Writing Committee to Revise the 2001 guidelines for the management of patients with atrial fibrillation) developed in collaboration with the European Heart Rhythm Association and the Heart Rhythm Society. Europace. 2006Sep;8(9):651-745
6. Caimi G, Messina L, Alfano R, Canino B, Fabbiano A, Cammarata AM, Lo Presti R. Haemorheological profile in subjects with nonvalvular atrial fibrillation. Clin Hemorheol Microcirc. 1999;20(2):85-90
7. Vannucchi AM. Insights into the pathogenesis and management of thrombosis in polycythemia vera and essential thrombocythemia. Intern Emerg Med. 2010Jun;5(3):177-84
8. Castro Hevia J, Antzelevitch C, Tornés Bárzaga F, Dorantes Sánchez M, Dorticós Balea F, Zayas Molina R, Quiñones Pérez MA, Fayad Rodríguez Y. Tpeak-Tend and Tpeak-Tend dispersion as risk factors for ventricular tachycardia/ventricular fibrillation in patients with the Brugada syndrome. J Am Coll Cardiol. 2006May2;47(9):1828-34
9. Savelieva I, Yap YG, Yi G, Guo X, Camm AJ, Malik M. Comparative reproducibility of QT, QT peak, and T peak-T end intervals and dispersion in normal subjects, patients with myocardial infarction, and patients with hypertrophic cardiomyopathy. Pacing Clin Electrophysiol. 1998Nov;21(11 Pt 2):2376-81
10. Hlaing T, Guo D, Zhao X, DiMino T, Greenspon L, Kowey PR, Yan GX. The QT and Tp-e intervals in left and right chest leads: comparison between patients with systemic and pulmonary hypertension. J Electrocardiol. 2005Oct;38(4 Suppl):154-8
11. Prati PL, Silingardi V, Puviani G, Fontana G, Depetra V, Fontanini F, Rivi A. [the "P Pulmonary and Left-Deviated Aqrs" Electrocardiographical Syndrome. Study of 56 Cases of Polycythemia Vera]. Cardiol Prat. 1964Feb;15:72-92
12. Tefferi A, Thiele J, Orazi A, Kvasnicka HM, Barbui T, Hanson CA, Barosi G, Verstovsek S, Birgegard G, Mesa R, Reilly JT, Gisslinger H, Vannucchi AM, Cervantes F, Finazzi G, Hoffman R, Gilliland DG, Bloomfield CD, Vardiman JW. Proposals and rationale for revision of the World Health Organization diagnostic criteria for polycythemia vera, essential thrombocythemia, and primary myelofibrosis: recommendations from an ad hoc international expert panel. Blood. 2007Aug15;110(4):1092-7
13. Mansia G, De Backer G, Dominiczak A, Cifkova R, Fagard R, Germano G, Grassi G, Heagerty AM, Kjeldsen SE, Laurent S, Narkiewicz K, Ruilope L, Rynkiewicz A, Schmieder RE, Struijker Boudier HA, Zanchetti A. 2007 ESH-ESC Guidelines for the management of arterial hypertension: the task force for the management of arterial hypertension of the European Society of Hypertension (ESH) and of the European Society of Cardiology (ESC). Blood Press. 2007;16(3):135-232
14. Schiller NB, Shah PM, Crawford M, DeMaria A, Devereux R, Feigenbaum H, Gutgesell H, Reichek N, Sahn D, Schnittger I. Recommendations for quantitation of the left ventricle by two-dimensional echocardiography. American Society of Echocardiography Committee on Standards, Subcommittee on Quantitation of Two-Dimensional Echocardiograms. J Am Soc Echocardiogr. 1989;2(5):358-67
15. Park SH, Shub C, Nobrega TP, Bailey KR, Seward JB. Two-dimensional echocardiographic calculation of left ventricular mass as recommended by the American Society of Echocardiography: correlation with autopsy and M-mode echocardiography. J Am Soc Echocardiogr. 1996;9(2):119-28
16. Devereux RB. Detection of left ventricular hypertrophy by M-mode echocardiography. Anatomic validation, standardization, and comparison to other methods. Hypertension. 1987Feb;9(2 Pt 2):II19-26
17. Dilaveris PE, Andrikopoulos GK, Metaxas G, Richter DJ, Avgeropoulou CK, Androulakis AM, Gialafos EJ, Michaelides AP, Toutouzas PK, Gialafos JE. Effects of ischemia on P wave dispersion and maximum P wave duration during spontaneous anginal episodes. Pacing Clin Electrophysiol. 1999Nov;22(11):1640-7
18. Dilaveris PE, Gialafos EJ, Sideris SK, Theopistou AM, Andrikopoulos GK, Kyriakidis M, Gialafos JE, Toutouzas PK. Simple electrocardiographic markers for the prediction of paroxysmal idiopathic atrial fibrillation. Am Heart J. 1998May;135(5 Pt 1):733-8
19. Dilaveris PE, Gialafos JE. P-wave dispersion: a novel predictor of paroxysmal atrial fibrillation. Ann Noninvasive Electrocardiol. 2001Apr;6(2):159-65
20. Centurion OA. Clinical implications of the P wave duration and dispersion: relationship between atrial conduction defects and abnormally prolonged and fractionated atrial endocardial electrograms. Int J Cardiol. 2009May1;134(1):6-8
21. Perez MV, Dewey FE, Marcus R, Ashley EA, Al-Ahmad AA, Wang PJ, Froelicher VF. Electrocardiographic predictors of atrial fibrillation. Am Heart J. 2009Oct;158(4):622-8
22. Zabel M, Portnoy S, Franz MR. Electrocardiographic indexes of dispersion of ventricular repolarization: an isolated heart validation study. J Am Coll Cardiol. 1995Mar1;25(3):746-52
23. Tun A, Khan IA, Wattanasauwan N, Win MT, Hussain A, Hla TA, Cherukuri VL, Vasavada BC, Sacchi TJ. Increased regional and transmyocardial dispersion of ventricular repolarization in end-stage renal disease. Can J Cardiol. 1999Jan;15(1):53-6
24. Cobb LA, Kramer RJ, Finch CA. Circulatory effects of chronic hypervolemia in polycythemia vera. J Clin Invest. 1960Nov;39:1722-8
25. Kwaan HC, Wang J. Hyperviscosity in polycythemia vera and other red cell abnormalities. Semin Thromb Hemost. 2003Oct;29(5):451-8
26. Haarmark C, Hansen PR, Vedel-Larsen E, Pedersen SH, Graff C, Andersen MP, Toft E, Wang F, Struijk JJ, Kanters JK. The prognostic value of the Tpeak-Tend interval in patients undergoing primary percutaneous coronary intervention for ST-segment elevation myocardial infarction. J Electrocardiol. 2009;42(6):555-60
27. Szydlo K, Wita K, Trusz-Gluza M, Zawada K, Piecuch A, Kulach A, Kucz E, Tyrka A, Kornacka I, Trams-Stawowska P, Pieda G. Repolarization parameters in patients with acute ST segment elevation myocardial infarction treated with primary percutaneous coronary intervention with respect to predischarge ST-T pattern: a preliminary study. Cardiol J. 2009;16(1):52-6
28. Cecchi E, Marcucci R, Poli D, Antonucci E, Abbate R, Gensini GF, Prisco D, Mannini L. Hyperviscosity as a possible risk factor for cerebral ischemic complications in atrial fibrillation patients. Am J Cardiol. 2006Jun15;97(12):1745-8
29. Devereux RB, Drayer JI, Chien S, Pickering TG, Letcher RL, DeYoung JL, Sealey JE, Laragh JH. Whole blood viscosity as a determinant of cardiac hypertrophy in systemic hypertension. Am J Cardiol. 1984Sep1;54(6):592-5
30. Pshenichnikov I, Shipilova T, Karai D, Riiupulk J, Veski K, Pilt K, Kaik J. Association between ventricular repolarization and main cardiovascular risk factors. Scand Cardiovasc J. 2011Feb;45(1):33-40
31. Porthan K, Virolainen J, Hiltunen TP, Viitasalo M, Vaananen H, Dabek J, Hannila-Handelberg T, Toivonen L, Nieminen MS, Kontula K, Oifkarinen L. Relationship of electrocardiographic repolarization measures to echocardiographic left ventricular mass in men with hypertension. J Hypertens. 2007Sep;25(9):1951-7
32. Mayet J, Shahi M, McGrath K, Poulter NR, Sever PS, Foale RA, Thom SA. Left ventricular hypertrophy and QT dispersion in hypertension. Hypertension. 1996Nov;28(5):791-6
Author contact
![]() Corresponding author: Enes Elvin Gul, MD. Selcuk Universitesi, Meram Tip Fakultesi, Kardiyoloji Sekreterligi, Meram, 42090 Konya, Turkey. Tel: 90-332-22360 72 Fax: 0090 3323237121 E-Mail: elvin_salamovcom
Corresponding author: Enes Elvin Gul, MD. Selcuk Universitesi, Meram Tip Fakultesi, Kardiyoloji Sekreterligi, Meram, 42090 Konya, Turkey. Tel: 90-332-22360 72 Fax: 0090 3323237121 E-Mail: elvin_salamovcom