Impact Factor ISSN: 1449-1907

 Global reach, higher impact
Int J Med Sci 2011; 8(7):599-614. doi:10.7150/ijms.8.599 This issue Cite
Research Paper
Overexpression of CD36 and Acyl-CoA Synthetases FATP2, FATP4 and ACSL1 Increases Fatty Acid Uptake in Human Hepatoma Cells
Julia Krammer, Margarete Digel, Friedrich Ehehalt, Wolfgang Stremmel, Joachim Füllekrug, Robert Ehehalt ![]()
Department of Gastroenterology, Hepatology and Infectious Diseases, University Hospital Heidelberg, Im Neuenheimer Feld 410, 69120 Heidelberg, Germany
Received 2011-1-13; Accepted 2011-9-27; Published 2011-10-7
Abstract
Background: Understanding the mechanisms of long chain fatty acid (LCFA) uptake in hepatic cells is of high medical importance to treat and to prevent fatty liver disease (FLD). ACSs (Acyl-CoA synthetases) are a family of enzymes that catalyze the esterification of fatty acids (FA) with CoA. Recent studies suggest that ACS enzymes drive the uptake of LCFA indirectly by their enzymatic activity and could promote special metabolic pathways dependent on their localization.
The only protein located at the plasma membrane which has consistently been shown to enhance FA uptake is CD36.
Aims: The current study investigated whether ACSs and CD36 could regulate hepatic LCFA uptake.
Methods and Results: FATP2 and FATP4 were both localized to the ER of HuH7 and HepG2 cells as shown by double immunofluorescence in comparison to marker proteins. ACSL1 was located at mitochondria in both cell lines. Overexpression of FATP2, FATP4 and ACSL1 highly increased ACS activity as well as the uptake of [3H]-oleic acid and fluorescent Bodipy-C12 (B12) fatty acid. Quantitative FACS analysis showed a correlation between ACS expression levels and B12 uptake. FATP2 had the highest effect on B12 uptake of all proteins tested. CD36 was mainly localized at the plasma membrane. Whereas [3H]-oleic acid uptake was increased after overexpression, CD36 had no effect on B12 uptake.
Conclusion: Uptake of LCFA into hepatoma cells can be regulated by the expression levels of intracellular enzymes. We propose that ACS enzymes drive FA uptake indirectly by esterification. Therefore these molecules are potential targets for treatment of nonalcoholic fatty liver disease (NAFLD) or steatohepatitis (NASH).
Keywords: fatty acid transport, acyl-CoA synthetases, nonalcoholic fatty liver disease, nonalcoholic steatohepatitis, CD36
INTRODUCTION
The molecular mechanism of long chain fatty acid (LCFA) uptake is still a matter of debate (for reviews see [1-8]). Understanding this process is important to elucidate potential targets for the treatment of lipid disorders like nonalcoholic fatty liver disease (NAFLD), which is caused by an accumulation of triglycerides in the liver. A common feature for the hepatic triglyceride accumulation is an elevated plasma level of free fatty acids (FFA) found especially in correlation with obesity and insulin resistance [9, 10]. Studies suggest that the rate of hepatic FFA uptake is directly proportional to plasma FFA concentrations [11]. Obesity results in a marked enlargement of the intraabdominal visceral fat. The development of insulin resistance leads to an elevated rate of lipolysis of these depots. Released LCFAs are transported to the liver where they are translocated across the plasma membrane, reassembled to triglycerides and stored in lipid droplets [12]. To interfere with the uptake mechanism is therefore a promising target for further therapeutic intervention for one of the major burdens of our society. The prevalence of hepatic steatosis in the general population is already estimated between 14 % and 24 % with an increasing tendency in all segments of the population [13, 14].
The first step of LCFA uptake is its translocation across the plasma membrane. There is a high degree of controversy regarding the mechanism of LCFA translocation. However, the concept of a facilitated uptake by special membrane components like proteins and lipid rafts had become popular in recent years [1, 3, 8]. There have been different candidate proteins published that are possibly involved in LCFA uptake of which only CD36 has consistently been shown to be expressed at the plasma membrane and to enhance LCFA uptake upon overexpression [4]. CD36 is a scavenger protein that besides FAs can bind a variety of molecules including acetylated LDL, collagen and phospholipids [4, 15-18]. It is located in lipid rafts and non-raft domains of the cellular plasma membrane and most likely facilitates LCFA transport by accumulating LCFA on the outer surface [3, 19, 20]. As CD36 has been shown to be expressed in liver tissue [21, 22] as well and is upregulated in nonalcoholic fatty liver disease (NAFLD) [23] and nonalcoholic steatohepatitis (NASH) [22], we examined its capability for LCFA uptake in our systems.
The first step for intracellular use of LCFA is its esterification with coenzyme A (CoA). This reaction is catalyzed by acyl-CoA synthetases (ACSs). The produced acyl-CoAs are substrates for ß-oxidation, the synthesis of triacylglycerol, phospholipids, cholesterol esters as well as ceramides and are also a primary source of signaling molecules [2, 24]. In humans two related protein families for long chain fatty acid activation exist: The fatty acid transport proteins (FATPs) and the long chain acyl-CoA synthetases (ACSLs) [25, 26]. They differ in tissue expression and in the cellular localization. Thereby they likely play a role in channeling LCFA to different intracellular metabolic pathways [2, 27]. As the overexpression of most of these proteins leads to an enhanced LCFA uptake [19, 28-30], these enzymes are potential pharmacological targets. In this study we investigated ACSL1, FATP2 and FATP4, all proteins that have been shown to be expressed in human liver [22, 23, 31-35].
We set the goal to better understand the role of FATP2, FATP4, ACSL1 and CD36 in LCFA uptake and lipid metabolism of hepatocytes to point out potential targets for treatment of hepatic steatosis.
MATERIALS AND METHODS
Reagents and Antibodies
Antibodies used were mouse anti-placenta alkaline phosphatase (PLAP) (Dako Cytomation), mouse anti-FLAG (Sigma), mouse anti-HA (Santa Cruz), Allophycocyanin (APC), Cy2 and Cy3 donkey anti-mouse (Jackson Immuno Research).
Constructs
GFP-FATP4 and FATP4-FLAGhave been described previously [29]. CD36-FLAG was kindly provided by Douglas M. Lublin, Washington University School of Medicine, St. Louis, MO. FLAG epitope-tagged ACSL1 [36] was a gift from Rosalind Coleman, PLAP cDNA [37] and HA epitope-tagged FATP2 were from our laboratory.
Plasmid constructs used for localization studies were pOCT-GFP [38], a gift from Heidi McBride and mito-RFP (containing the N terminus of rat aldehyde dehydrogenase fused to mRFP) as markers for mitochondria. ADRP-mRFP1, a marker for lipid droplets, mRFP-sec61ß, a marker for ER and peroxisomal-RFP, a marker for peroxisomes were gifts of Christoph Thiele and Lars Kürschner, MPI Molecular Cell Biology, Dresden, Germany. From our laboratory ssGFPglycTMDpcx as well as PLAP, both constructs for plasmamembrane marking, were used.
Oleate Uptake
Cumulative uptake of oleate was based on Stremmel and Berk 1986 [39]. Adherent cells were incubated for 5 min at 37 °C with [3H]oleate uptake solution (170 µM [3H] oleate, 170 µM BSA in PBS; specific activity 4.1 Ci/mol). After stopping and washing with ice-cold 0.5 % BSA in PBS, cells were lysed with 1 M NaOH and aliquots analyzed by scintillation counting (Biorad) for protein concentration and radioactivity as before [40].
Cells and transient transfection
HuH7 (JCRB 0403) and HepG2 (ATCC HB-8065) cells were maintained under standard tissue culture conditions with the appropriate culture media (HuH7: D-MEM Invitrogen; 4,5 g glucose/L, 10% FBS, 2 mM L-Glutamine and HepG2: D-MEM Invitrogen; 4,5 g glucose/L 10% FBS 2mM L-Glutamine, 1% Sodium pyruvate Sigma, 1% non-essential aminoacid solution Sigma). HepG2 cells were grown on a Collagen R surface coating (Serva). Cells grown to near confluency (10 cm²) were transfected with 2 μg plasmid-DNA and 10 μl FuGENE HD (Roche). Analysis was performed 24-48 hours after transfection.
Immunofluorescence and confocal analysis
For immunofluorescence microscopy, cells were fixed for 10 min with 4% PFA at RT followed by a permeabilisation with 0.1% saponin (Sigma) for 10 min. Fixed cells were incubated for 1 hour at room temperature with the appropriate dilution of antibodies in phosphate-buffered saline (PBS) containing 0.2% gelatine and 0.1% saponin.
After three washes with PBS/ 0.2% gelatine cells were incubated with the respective fluorescently labelled secondary antibodies in PBS containing 0.2% gelatine and 0.1% saponin for 1 hour at room temperature. The antibody against PLAP and the anti-HA antibody were diluted 1:100, the anti-FLAG antibody 1:1000.
Cy3-labelled secondary antibodies were diluted 1:1000, and the Cy2-labelled ones 1:200. The cells were fixed as described above. Coverslips were mounted in Mowiol and fluorescent images were acquired on a Leica TCS SP2 confocal microscope as described in [41] and arranged with Adobe Photoshop. All confocal images are representative single sections.
B12-FA uptake and FACS analysis
Flow cytometric analyses were essentially performed as described before [29]. Transfected HuH7 and HepG2 cells were incubated with 2 µM B12-FA [Bodipy 3823 (4.4-difluoro-5.7-diphenyl-4-bora-3a,4a-diaza-s-indacene-3-dodecanoic-acid) Invitrogen] bovine serum albumin (BSA) solution for 2 min. After the termination of FA uptake by adding ice-cold 0.1% BSA in PBS, the cells were trypsinized, fixed in suspension with 4% paraformaldehyde and stained with the appropriate antibodies. For FATP2-HA, CD36-FLAG and ACSL1-FLAG staining we incubated the cells with APC (Allophycocyanin) as second antibody for 30 min. FATP4 was used as an RFP-construct. Appropriate controls (for autofluorescence, single signals) were used for calibration of the FACS analysis. Cells were analyzed with a FACS Scan and LSRII FACS (BD Biosciences). Data were exported from the CellQuestPro software (BD Biosciences, San Jose, CA) and FACS Diva Software (BD Biosciences, San Jose, CA) and analyzed by spreadsheet calculations [42].Moreover, S(Bodipy) [AU] was calculated using the absolute number of cells overexpressing one of the candidate proteins (in % of all cells gated) and the overall mean of Bodipy fatty acid fluorescence measured.
Acyl-CoA synthetase activity
The protocol is based on Hall et al. [43]. Cells were lysed for 30 min on ice with 1% TX-100, 130 mM KCl, 25 mM Tris-HCl, pH 7.4. Protein lysates were incubated for 10 min at 30°C in 100 mM Tris, pH 7.4, 5 mM MgCl2, 200 µM dithiothreitol (DTT), 10 mM ATP, 0.2% TX-100, 20 µM [3H]oleate (specific activity 10 Ci/mol), 200 µM CoA. The reaction was stopped with Dole's solution (isopropanol: n-heptane: H2SO4 40:10:1), unreacted oleate was extracted four times with n-heptane and the remaining oleoyl-CoA in the aqueous phase determined by scintillation counting.
Real time PCR
First cDNA was prepared using Transcriptor First Strand cDNA Synthesis Kit (Roche) and mRNA prepared using High Pure RNA Isolation Kit (Roche) according to the manufacturer´s instructions. The final RNA concentrations were determined spectrophotometrically with BioPhotometer (Eppendorf).
Using reverse transcription quantitative PCR (qPCR) we studied FATP2, FATP4, ACSL1 and CD36 and obtained these to our housekeeping gene ß-Actin.
For each gene investigated specific primers were designed for optimal performance with its specific annealing temperature by software (http://frodo.wi.mit.edu/primer3/) [44]. Primer pairs (self-designed) are listed below:
ratACSL1
Forward 5'-TGGGCACAGAAGAGAGGATT-3'MT(°C): 63,8
Reverse 5'- ATGGCTTCAAACCAGCATTC-3'MT(°C): 63,9
hACSL1
Forward 5'-CTTCTGGTACGCCACGAGAC-3'MT(°C): 64,8
Reverse 5'-GTCGCTGTCAAGTAGTGCG-3'MT(°C): 62,3
hCD36
Forward 5'-TTGATGTGCAAAATCCACAGG-3'MT(°C): 65,7
Reverse 5'-TGTGTTGTCCTCAGCGTCCT-3'MT(°C): 66
mFATP2
Forward 5'-TCGTGGGACTGGTAGATTTTG-3'MT(°C): 64
Reverse 5'-CGCGATGTGTTGAAAGAGTTT-3'MT(°C): 63,8
hFATP2
Forward 5'-TGGTGTCGCCAGAACTACAAG-3'MT(°C): 65,1
Reverse 5'-GAAAGAGTCAATCCCATCTGTGT-3'MT(°C): 63,1
mFATP4
Forward 5'-GTGAGATGGCCTCAGCTATC-3'MT(°C): 61,4
Reverse 5'-GAAGAGGGTCCAGATGCTCT-3'MT(°C): 62,3
hFATP4
Forward 5'-CGGTTCTGGGACGATTGTAT-3'MT(°C): 63,6
Reverse 5'-AACCTGGTGCTGGTTTTCTG-3'MT(°C): 64
human ß-actin
Forward 5'-AGGATGCAGAAGGAGATCACT-3'MT(°C): 61,8
Reverse 5'-GGGTGTAACGCAACTAAGTCATAG-3'MT(°C): 62,5
Levels of the following thermal profile were used: Enzyme activation at 95° for 10min followed by 35 amplification cycles of 15 sec at 95° (denaturation step), 30 sec at 60° (annealing step) and 30 sec at 72° for Elongation. Paying attention the melting curves show just one peak for every sample, data acquisition occurred at the elongation step of each cycle, and the threshold cycle (Ct) for each sample was calculated by determining the point at which fluorescence exceeded the threshold limit.
For use as internal standards, control plasmids including each gene were diluted to 10^310^7 copies. RT qPCRs were carried out in 96 well reaction plates using Power SYBR® Green PCR Master Mix from Applied Biosystems. Results were analyzed using the software by 7500 Fast Real-Time PCR System from Applied Biosystems and finally given as the relative expression to the housekeeping gene for human ß-actin. Results were collected from at least two independent experiments using each time three different RNA samples and were presented as a ratio to actin expression.
Statistical analysis
All values are reported as mean and standard error of the mean (SEM). The ANOVA test was used to test for statistical significance. Probability values of p < 0.05 were set as threshold for statistical significance.
RESULTS
Subcellular localisation of FATP2, FATP4, ACSL1 and CD36
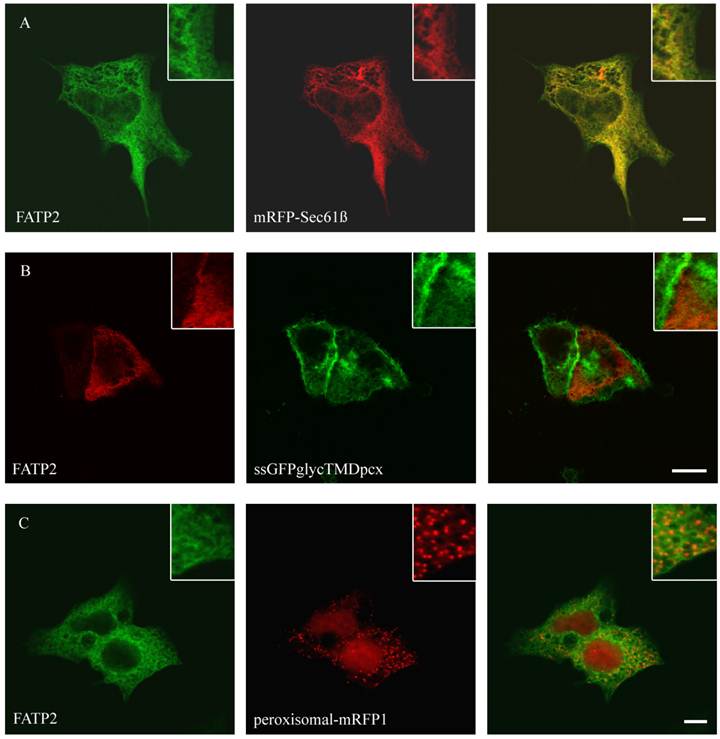
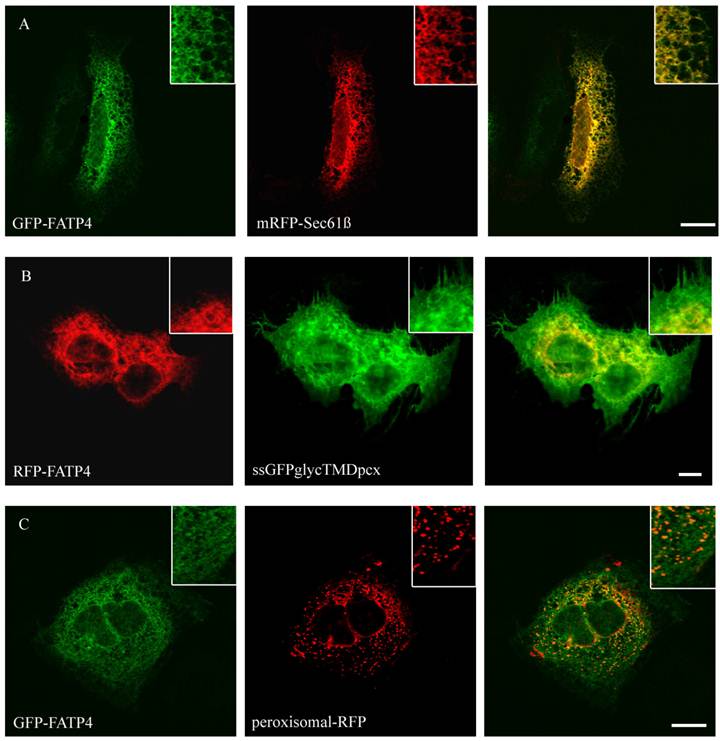
To study the role of FATP2, FATP4, ACSL1 and CD36 in LCFA transport of hepatoma cells we first investigated the localization of these proteins. So far the localization of FATP2 was described in peroxisomes as well as at the plasma membrane of rat, mouse and monkey cells [27, 34, 45] and additionally in the endoplasmatic reticulum (ER) of COS cells [46]. FATP4 was originally reported to be located at the plasma membrane and act there like a transporter for LCFA [28]. However, recent studies could show a localization in the ER of mouse small intestine, HeLa, Caco-2, Ptk2, MDCK, 3T3-L1 and COS cells [29, 47]. For localization studies HA-tagged FATP2 as well as GFP-tagged FATP4 was transiently transfected in HuH7 and HepG2 cells. In these cells they showed a similar reticular cellular pattern typifying the ER membranes (figure 1 and 2). ER localization was assured by co-expression with the ER-marker mRFP-Sec61ß. FATP2 and FATP4 did neither co-localize with plasma membrane (ssGFPglycTMDpcx) nor peroxisomal (peroxisomal-mRFP1) marker proteins.
Localisation of FATP2 in HepG2 (A+C) and HuH7 (B) cells. The ER marker protein mRFP (red) was cotransfected. For FATP2-HA we used mouse anti-HA antibody from Santa Cruz and Cy2 fluorescently-labelled secondary antibody. FATP2 shows a reticular cellular structure representing ER membranes. There was no match with plasmamembrane marker (ssGFPglyc) (B) or peroxisomal marker proteins (peroxisomal-RFP) (C) in both cell lines. Bar: 10 µm.
Localisation of FATP4 in HuH7 cells. GFP-FATP4 flags the same reticular structures as the ER marker protein mRFP (A). There was no concordance with plasmamembrane (ssGFPglyc) and RFP-FATP4 (C) or peroxisomal marker proteins (peroxisomal-RFP) and GFP-FATP4 (B). Results are representative for HepG2 cells as well. Bar: 10 µm.
ACSL1 is one of the most extensively characterized proteins of the ACSL-family. Nevertheless its localization is still debatable [27, 29, 48, 49]. To specify the localization of FLAG-tagged ACSL1 we did a co-staining with the mitochondria-marker (mito-RFP) and found a co-localization in both HuH7 and HepG2 cell lines (figure 3). No overlap was found with plasma membrane (ssGFPglycTMDpcx), peroxisomes (peroxisomal-mRFP1), ER (mRFP-Sec61ß) or lipid droplets (adipophilin-mRFP1), where it has been previously described to be located as well [27].
Localisation of ACSL1 in HepG2 cells. For ACSL1-FLAG we used mouse anti-FLAG antibody (Sigma) and Cy2 or Cy3 fluorescently-labelled secondary antibodies. HepG2 cells were cotransfected with mito-RFP, a marker for mitochondria and a plasmamembrane marker protein (ssGFPglyc). There was an overlap with the mitochondria staining (mito-RFP) (A) and no concordance with plasmamembrane staining (ssGFPglyc) (B). In addition ACSL1 had no overlap with lipid droplets (adipophilin-mRFP1) (C) or peroxisome (peroxisomal-RFP) marker proteins (D). Results are representative for HuH7 cells as well. Bar: 10 µm.
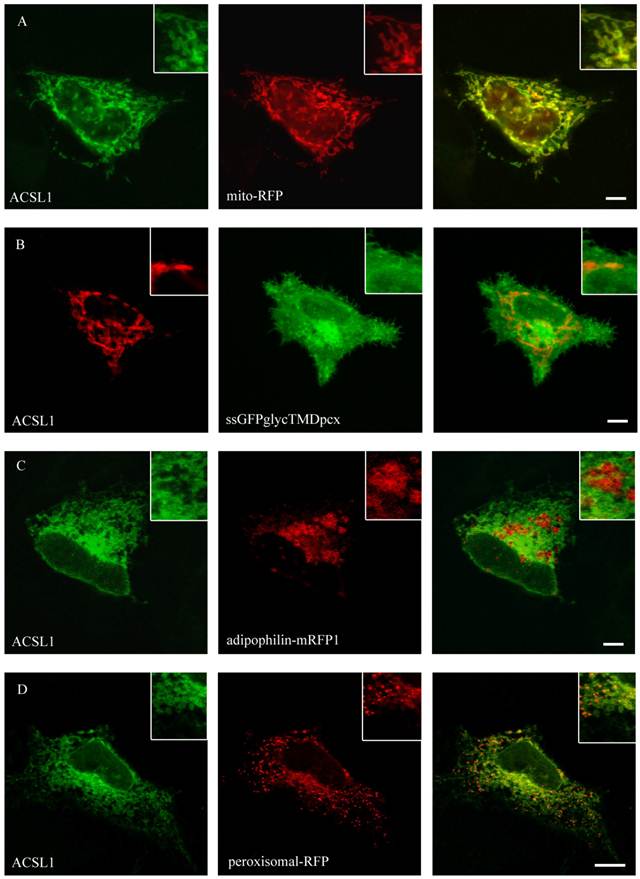
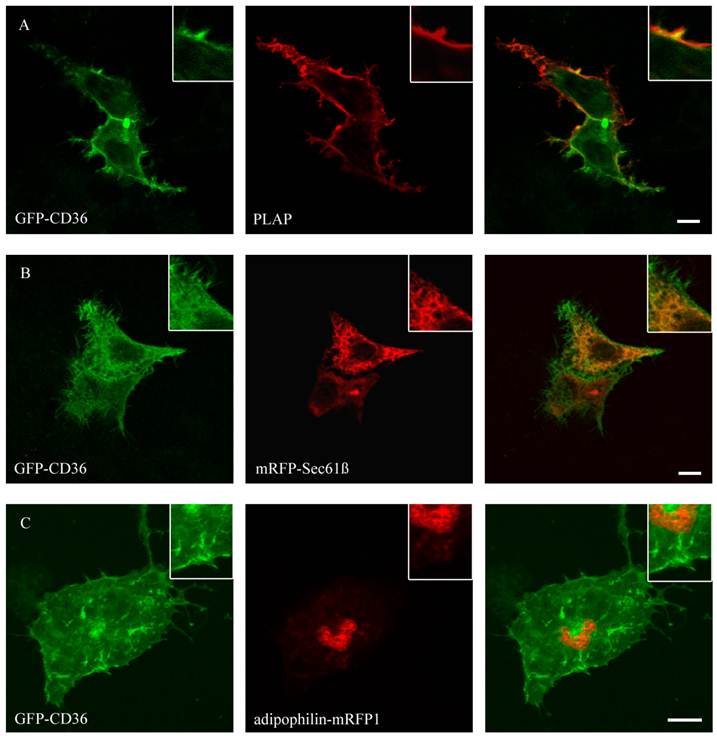
Figure 4 shows that CD36 could be co-localized with PLAP, a marker for plasma membrane. The staining presented the complete size of the cell and typical branches on the cell surface. This localization is in line with previous results in COS cells [19]. No co-localization with mitochondria (mito-RFP), ER (mRFP-Sec61ß), lipid droplets (ADP-mRFP1) and peroxisomes (peroxisomal-mRFP1) could be detected.
GFP-CD36 transiently cotransfected with PLAP in HepG2 cells and clustered with mouse anti PLAP. CD36 flags typical branches on the cell surface compatible with the plasma membrane (A). There was no matching of CD36 staining with ER (mRFP) (B) or lipid droplet (adipophilin-mRFP1) marker proteins (C). Results are representative for HuH7 cells as well. Bar: 10 µm.
Analysis of fatty acid uptake
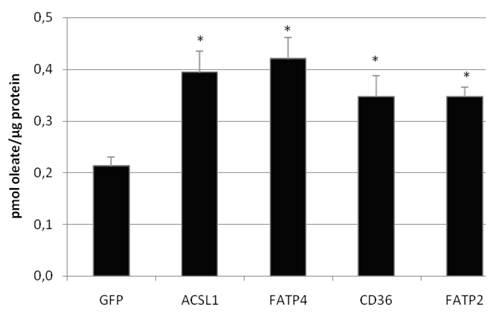
To investigate the LCFA uptake in HuH7 and HepG2 cells, we transiently expressed FATP2, FATP4, ACSL1 and CD36 and incubated the cells with different FA substrates. Transcription of FATP4, FATP2, ACSL1, and CD36 was measured by efficiency corrected real-time PCR relative to ß-actin to estimate the basal und overexpression rates. Transfection resulted in a several fold increase of mRNA expression: overexpression was 271-fold (ACSL1), 6777-fold (FATP2), 3165-fold (FATP4) and 181-fold (CD36) in HuH7 cells, respectively. To work with physiological fatty acids, we first used radio-labeled oleate in a 1:1 relation to BSA and incubated the cells for 60 sec with the mix. All proteins significantly increased the oleate uptake in HuH7 (figure 5) as well as in HepG2 cells (data not shown) in comparison to GFP overexpression. GFP served as control and did not show any influence on LCFA uptake compared to non-transfected cells.
Oleate uptake of transient transfected HuH7 cells after 60 sec of incubation with oleate-BSA mix (in pmol oleate/µg protein). Controls for endogenous oleate uptake were transfected with GFP plasmid. The proteinoverexpression resulted in a significant increase in the rate of [3H]oleate uptake within 60 sec (p<0.05). Values are means ± SD of three independent experiments.
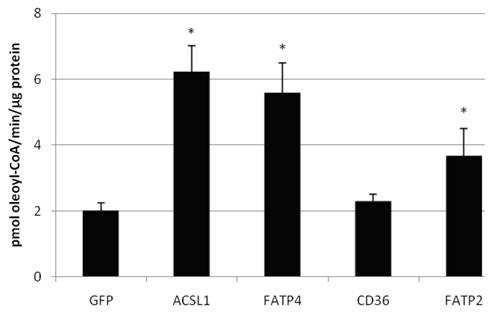
We also confirmed that overexpression of FATP2, FATP4 and ACSL1 leads to an increased acyl-CoA-synthetase activity in HuH7 cells (figure 6) and HepG2 cells (data not shown), when using oleate as substrate. CD36 had no influence on the ACS activity of the cells in comparison to the control.
Acyl-CoA synthetase activity (in pmol oleoyl-CoA/minute/µg protein) determined from lysates of transiently transfectet HepG2 cells. Controls for endogenous ACS activity were transfected with GFP plasmid. Values are means ± SD of three independent experiments (p<0.05).
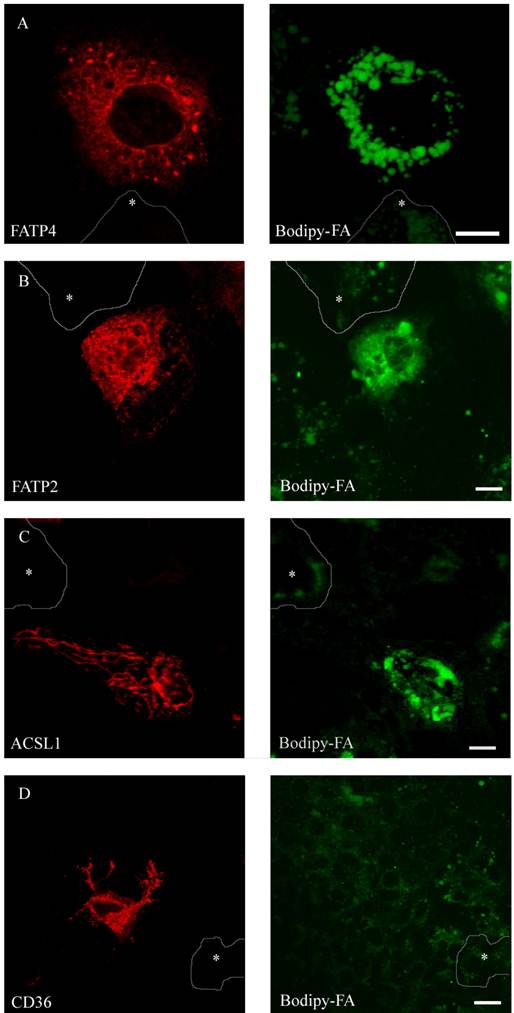
To compare FA uptake to the expression level of the individual protein at a single cell level, we performed FACS analysis as described [29]. FATP2, CD36 and ACSL1 were transiently overexpressed and incubated for a short time with the fluorescent long chain fatty acid B12. FATP4 was used as RFP-construct, FATP2, CD36 and ACSL1 were marked by immunofluorescence. In initial experiments our cells were analysed by a confocal microscope and classified by visual characteristics. We could register an increased fluorescence level and thus increased B12 uptake upon overexpression of FATP2, FATP4 and ACSL1 compared to their non-expressing counterparts. Surprisingly, there was no significant uptake detectable upon overexpression with CD36 (figure 7).
HuH7 cells with short time incubation of B12 fatty acid. Overexpression of RFP-FATP4, FATP2-HA and ACSL1-FLAG increased B12 uptake into the cell. B12 was accumulated and stored in lipid droplets. CD36-FLAG did not show any enhanced uptake of B12 compared to control cells.
To gain quantitative data a larger number of individual cells was analysed by FACS. The standard dot plot output of the FACS software confirmed that there is a higher B12 uptake with overexpression of FATP2, FATP4 and ACSL1, but not with CD36. Even though we could collect a large amount of cells with the FACS analysis, we could not correlate the B12 uptake with the level of expression of CD36 accurately.
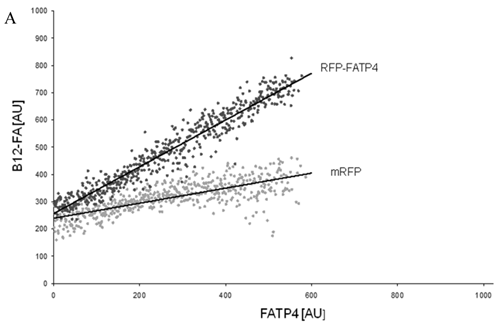
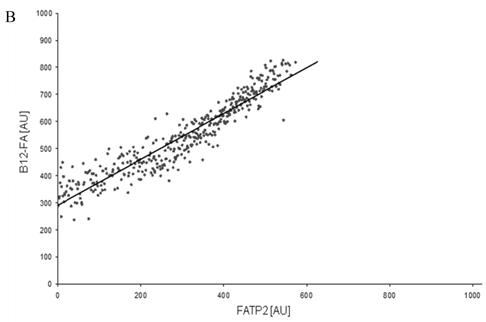
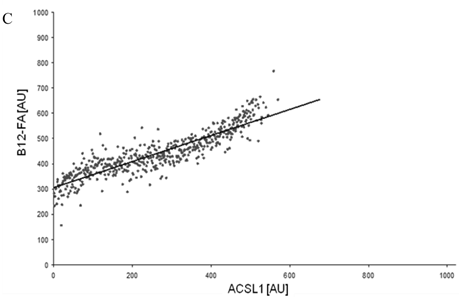
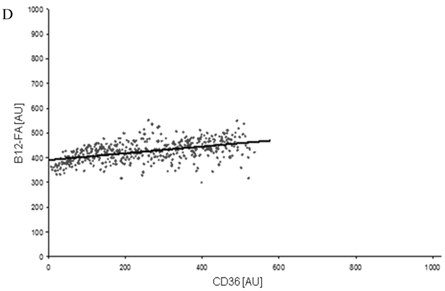
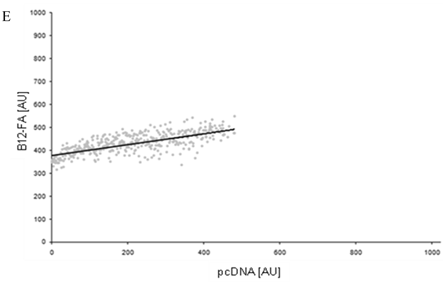
To correlate individual transfected cells with their special fluorescent intensity of B12-FA that has been taken up, data were transformed by a spreadsheet method (figure 8) [42]. Each data point in figure 8 contains all cells with the same fluorescence value of the transfected protein (equals the level of expression) and the average B12-FA fluorescence of these cells (equals the amount of FA taken up). Control cells were transfected with mRFP and pcDNA and show the endogenous B12 uptake of HuH7 cells. The calculated slopes (m) and the correlation coefficients (r) confirm a strong linear correlation between the level of protein expression of RFP-FATP4, FATP2-HA and ACSL1-FLAG and B12 uptake.
FACS analysis of fluorescent fatty acid uptake of transiently transfected HuH7 cells. Thespreadsheets correlated the level of expression with the amount of fluorescent fatty acid uptake (B12-FA). (A) HuH7 cells transfected with RFP-FATP4.Control cells were transfected with red fluorescent mRFP protein. RFP-FATP4 (r=0.73) enhanced fatty acid uptake depending on its relative level of expression in comparison to control cells only expressing mRFP (r=0.4). The low increase of the fatty acid uptake of control cells (r=0.4) could be explained by endogenous FATP4 expression in HuH7 cells. FATP2-HA (B) (r=0.92) and ACSL1-FLAG (C) (r=0.64) overexpressing cells enhanced the uptake of fatty acids as well. The overexpression of CD36-FLAG (D) (r=0.2) did not significantly correlate with the uptake of fatty acids. Control cells were transfected with pcDNA3 (E) (r=0.18). The pictured diagrams are representative for three independent experiments.
To find out, which one of the investigated proteins causes the quantitative highest FA uptake, we compared Bodipy fatty acid uptake to the fluorescent level of the overexpressed candidate protein on a single cell basis. The percentage of gated cells was multiplied with the mean of the fluorescence signal derived from B12. Presenting this data in arbitrary units showes that FATP2 overexpressing cells seem to have the quantitative highest uptake of fluorescent fatty acid compared to their expression levels (figure 9). This means less FATP2 within one cell is necessary to incease FA uptake to a similar level compared to other candidate proteins.
Bodipy fatty acid uptake of RFP-FATP4, CD36-FLAG, FATP2-HA and ACSL1-FLAG transfected HuH7 cells in arbitrary units based on FACS analyses. Bodipy fatty acid uptake was correlated to the protein expression level of transfected protein on a snigle cell basis. The gated overexpressing cells (in % of all cells gated) were multiplied with the corresponding overall mean of the fluorescence signal derived from the Bodipy fatty acid (SBodipy). HuH7 Cells transfeced with pcDNA3 were used as control and as background range and were set as base level of the x-axis. Uptake was performed with B12 fatty acid in experiments with FATP4, FATP2, ACSL1 and CD36 (CD36 B12) or with B16 (CD36 B16). The pictured diagram is representative for three independent experiments.
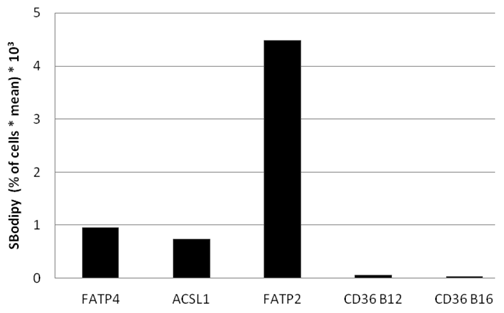
Again we could not find any increased uptake of B12-FA when HuH7 cells were transfected with CD36. In contrast to studies of Koonen et al. [50] even with another ligand (Bodipy-C16) there was no difference between the uptake of untransfected cells and cells with CD36 overexpression (figure 9). This likely indicates that Bodipy FAs - in opposite to [3H]oleate - are no ligands for CD36.
DISCUSSION
Translocation of long chain fatty acids at the plasma membrane is achieved by a complex interplay of several co-existing mechanisms [1, 3]. Members of the FATP family have been previously proposed to be the long sought transport proteins that facilitate LCFA uptake at the plasma membrane. However, this is still a matter of debate [1-4, 6, 8]. Recent data suggest that at least FATP4 is an intracellular enzyme localized in the ER [29, 47]. In our studies we could localize FATP2 and FATP4 only in the ER of HuH7 and HepG2 cells. This confirms other results which found FATP4 in the ER of mouse small intestine, COS, MDCK, 3T3-L1 adipocytes and Vero cells [29]. In accordance to Steinberg et al. we could find FATP2 in the ER of hepatoma cells [46]. Other studies located FATP2 at the plasma membrane of hepatocytes [34] or in fibroblast peroxisomes promoting FA converting via ß-oxidation [45]. We could not affirm these findings in our cell lines. The reason for this difference remains unclear, but it could be due to different methods of overexpression, materials and cells used for analysis. Consequently, in Huh7 as well as in HepG2 cells, FATP4 as well as FATP2 are no transport proteins directly facilitating LCFA transport at the plasma membrane. In fact, they are located intracellular and are involved in FA metabolism (probably production of phospholipids and triglycerides) upon their acyl-CoA activity. They more likely increase LCFA uptake indirectly by metabolic trapping, which means that long chain fatty acids are activated and then metabolized. A decreased intracellular free LCFA concentration would drive more LCFAs into the cell [2, 8].
Acyl-CoAs are involved in both anabolic and catabolic pathways. The disturbance of these pathways is linked to hepatic steatosis, hyperlipidemia and insulin resistance [51]. Increased LCFA uptake could also be correlated to the ACSL1 activity [29] and accumulation of triglycerides could be shown upon overexpression in HepG2 cells [52]. Therefore we also analyzed the localization and effect of ACSL1 in our hepatoma cell models. In contrast to previous results on primary rat hepatocytes where ACSL1 was located in ER [49], we could point out its localization in mitochondria of HuH7 and HepG2 cells. This would be in line with their potential role in mice adipocytes [53]. In the majority of cases the localization in hepatocytes has been studied when ACSL1 was overexpressed, therefore ER localization might also be a phenomenon of different levels of overexpression. Another explanation might be a different function of ACSL1 depending on the cell type or tissue.
Our studies affirm, that FA uptake into hepatoma cells can be regulated by enzymes. Accordingly, we could identify an increased oleate uptake in addition to an elevated ACS activity for ACSL1, FATP2 and FATP4 after overexpression. We believe that increased enzyme activity could diminish the intracellular pool of free LCFA and create a concentration gradient of free LCFA in the intra- and extracellular domain. For an increased LCFA uptake ACS have therefore not to be localized at the plasma membrane as found in our results.
As we could demonstrate an inceased [3H]oleate uptake upon FATP2, FATP4, ACSL1 and CD36 overexpression compared to control cells, we have to limitate, that expression levels by transient transfection are varying from cell to cell in these experiments. As the Bradford assay measures the total protein level of each sample, we could not draw conclusions to the amount of overexpressed protein reliably. Accordingly, these data as well as the data of ACS activity should not be considered quantitatively but qualitatively.
For this reason we performed fatty acid uptake assays on a single cell level via FACS analyses and spreadsheet calculations. We could affirm that at least FATP2, FATP4 and ACSL1 have significant influence on the level of LCFA uptake depending on their expression levels. Therefore they can be important targets for the treatment of metabolic liver diseases as a dose dependent effect of inhibition seems likely. Interestingly, targeting FATP2 and FATP4 have already become more attractive as potent small molecule inhibitors have been identified [33, 54].
In our FACS analysis we could identify FATP2, the most expressed FATP in liver cells [30], to have the highest influence on LCFA uptake in correlation to its protein expression level in hepatoma cells. Therefore the treatment of nonalcoholic fatty liver disease (NAFLD) or NASH by inhibiting the uptake of FA into the liver cell could be theoretically influenced by blocking especially FATP2 function. Interestingly, actual data show that liver specific inhibition of FATP2 expression in vivo resulted in a reduced hepatosteatosis with improving glucose and insulin levels [34]. In addition, recent results from an high throughput screen on HepG2 and CaCo-2 cells demonstrate that FA transport can be inhibited in a FATP-specific manner without causing cellular toxicity [33]. This makes FATP2 to a target of high interest for further metabolic strategies.
When overexpressed in cultured fibroblasts CD36 increases LCFA uptake [55]. Moreover, CD36 knockout mice show reduced uptake of oleate in isolated adipocytes [56]. In HuH7 and HepG2 cells we could increase [3H]oleate uptake by transient overexpression of CD36 significantly. In FACS analyses an enlarged uptake of B12 FA was missed. Even with B16FA, previously been shown to be a CD36 ligand [50], there was not a significant gain of FA uptake (figure 9). The differences between [3H]oleate and Bodipy fatty acid could probably be explained by special substrate specificities of CD36.
We could show that CD36 is located in the plasmamembrane of HuH7 and HepG2 cells. This strengthens results from other studies that locate CD36 in raft and non raft plasma membrane domains [19, 20] and suggests a significant role of CD36 in the uptake mechanism of FA in hepatoma cells. As CD36 has no ACS activity, it possibly increases FA uptake by accumulating FA at the plasma membrane. Recent data show that CD36 is indeed increased in liver of morbidly obese patients and correlated to free FA levels [22]. It has also been shown that downregulation of CD36 can prevent steatohepatitis in hyperlipidemic mice [57]. This way CD36 is also a target for the treatment of NAFLD or NASH.
In conclusion, we studied four different proteins that can promote FA uptake into hepatoma cells depending on their expression levels. An attractive therapeutic candidate seems to be FATP2 as it had the strongest influence on fatty acid uptake in our experiments. It is highly expressed in liver tissue and an effective selective inhibition with small molecules has already been shown [33]. It will be interesting to see, if this concept could be really integrated into therapeutic strategies.
Acknowledgements
We thank Richard Sparla for technical assistance and Prof. Heiner Krammer for critically reading the manuscript. RE and JF were supported by grants of the German Research Foundation (EH 196/5-1, FU 340/5-1).
CONFLICT OF INTEREST
The authors have declared that no conflict of interest exists.
References
1. Glatz JF, Luiken JJ, Bonen A. Membrane fatty acid transporters as regulators of lipid metabolism: implications for metabolic disease. Physiol Rev. 2010;90(1):367-417
2. Digel M, Ehehalt R, Stremmel W, Fullekrug J. Acyl-CoA synthetases: fatty acid uptake and metabolic channeling. Mol Cell Biochem. 2009;326(1-2):23-28
3. Ehehalt R, Fullekrug J, Pohl J, Ring A, Herrmann T, Stremmel W. Translocation of long chain fatty acids across the plasma membrane--lipid rafts and fatty acid transport proteins. Mol Cell Biochem. 2006;284(1-2):135-140
4. Su X, Abumrad NA. Cellular fatty acid uptake: a pathway under construction. Trends Endocrinol Metab. 2009;20(2):72-77
5. Schwenk RW, Holloway GP, Luiken JJ, Bonen A, Glatz JF. Fatty acid transport across the cell membrane: regulation by fatty acid transporters. Prostaglandins Leukot Essent Fatty Acids. 2010;82(4-6):149-154
6. Stahl A. A current review of fatty acid transport proteins (SLC27). Pflugers Arch. 2004;447(5):722-727
7. Kampf JP, Kleinfeld AM. Is membrane transport of FFA mediated by lipid, protein, or both? An unknown protein mediates free fatty acid transport across the adipocyte plasma membrane. Physiology (Bethesda). 2007;22:7-14
8. Hamilton JA. New insights into the roles of proteins and lipids in membrane transport of fatty acids. Prostaglandins Leukot Essent Fatty Acids. 2007;77(5-6):355-361
9. Lewis GF, Carpentier A, Adeli K, Giacca A. Disordered fat storage and mobilization in the pathogenesis of insulin resistance and type 2 diabetes. Endocr Rev. 2002;23(2):201-229
10. Harrison SA, Diehl AM. Fat and the liver--a molecular overview. Semin Gastrointest Dis. 2002;13(1):3-16
11. Wahren J, Sato Y, Ostman J, Hagenfeldt L, Felig P. Turnover and splanchnic metabolism of free fatty acids and ketones in insulin-dependent diabetics at rest and in response to exercise. J Clin Invest. 1984;73(5):1367-1376
12. Verna EC, Berk PD. Role of fatty acids in the pathogenesis of obesity and fatty liver: impact of bariatric surgery. Semin Liver Dis. 2008;28(4):407-426
13. Hilden M, Christoffersen P, Juhl E, Dalgaard JB. Liver histology in a 'normal' population--examinations of 503 consecutive fatal traffic casualties. Scand J Gastroenterol. 1977;12(5):593-597
14. Bellentani S, Saccoccio G, Masutti F, Croce LS, Brandi G, Sasso F, Cristanini G, Tiribelli C. Prevalence of and risk factors for hepatic steatosis in Northern Italy. Ann Intern Med. 2000;132(2):112-117
15. Silverstein RL, Febbraio M. CD36, a scavenger receptor involved in immunity, metabolism, angiogenesis, and behavior. Sci Signal. 2009;2(72):re3
16. Engelmann B, Wiedmann MK. Cellular phospholipid uptake: flexible paths to coregulate the functions of intracellular lipids. Biochim Biophys Acta. 2010;1801(6):609-616
17. Calvo D, Gomez-Coronado D, Suarez Y, Lasuncion MA, Vega MA. Human CD36 is a high affinity receptor for the native lipoproteins HDL, LDL, and VLDL. J Lipid Res. 1998;39(4):777-788
18. Connelly MA, Klein SM, Azhar S, Abumrad NA, Williams DL. Comparison of class B scavenger receptors, CD36 and scavenger receptor BI (SR-BI), shows that both receptors mediate high density lipoprotein-cholesteryl ester selective uptake but SR-BI exhibits a unique enhancement of cholesteryl ester uptake. J Biol Chem. 1999;274(1):41-47
19. Ehehalt R, Sparla R, Kulaksiz H, Herrmann T, Fullekrug J, Stremmel W. Uptake of long chain fatty acids is regulated by dynamic interaction of FAT/CD36 with cholesterol/sphingolipid enriched microdomains (lipid rafts). BMC Cell Biol. 2008;9:45
20. Pohl J, Ring A, Korkmaz U, Ehehalt R, Stremmel W. FAT/CD36-mediated long-chain fatty acid uptake in adipocytes requires plasma membrane rafts. Mol Biol Cell. 2005;16(1):24-31
21. Cheung L, Andersen M, Gustavsson C, Odeberg J, Fernandez-Perez L, Norstedt G, Tollet-Egnell P. Hormonal and nutritional regulation of alternative CD36 transcripts in rat liver--a role for growth hormone in alternative exon usage. BMC Mol Biol. 2007;8:60
22. Bechmann LP, Gieseler RK, Sowa JP, Kahraman A, Erhard J, Wedemeyer I, Emons B, Jochum C, Feldkamp T, Gerken G. et al. Apoptosis is associated with CD36/fatty acid translocase upregulation in non-alcoholic steatohepatitis. Liver Int. 2010;30(6):850-859
23. Greco D, Kotronen A, Westerbacka J, Puig O, Arkkila P, Kiviluoto T, Laitinen S, Kolak M, Fisher RM, Hamsten A. et al. Gene expression in human NAFLD. Am J Physiol Gastrointest Liver Physiol. 2008;294(5):G1281-1287
24. Ellis JM, Frahm JL, Li LO, Coleman RA. Acyl-coenzyme A synthetases in metabolic control. Curr Opin Lipidol. 2010;21(3):212-217
25. Watkins PA. Very-long-chain acyl-CoA synthetases. J Biol Chem. 2008;283(4):1773-1777
26. Gimeno RE. Fatty acid transport proteins. Curr Opin Lipidol. 2007;18(3):271-276
27. Mashek DG, Li LO, Coleman RA. Long-chain acyl-CoA synthetases and fatty acid channeling. Future Lipidol. 2007;2(4):465-476
28. Stahl A, Hirsch DJ, Gimeno RE, Punreddy S, Ge P, Watson N, Patel S, Kotler M, Raimondi A, Tartaglia LA. et al. Identification of the major intestinal fatty acid transport protein. Mol Cell. 1999;4(3):299-308
29. Milger K, Herrmann T, Becker C, Gotthardt D, Zickwolf J, Ehehalt R, Watkins PA, Stremmel W, Fullekrug J. Cellular uptake of fatty acids driven by the ER-localized acyl-CoA synthetase FATP4. J Cell Sci. 2006;119(Pt 22):4678-4688
30. Doege H, Stahl A. Protein-mediated fatty acid uptake: novel insights from in vivo models. Physiology (Bethesda). 2006;21:259-268
31. Hirsch D, Stahl A, Lodish HF. A family of fatty acid transporters conserved from mycobacterium to man. Proc Natl Acad Sci U S A. 1998;95(15):8625-8629
32. Mashek DG, Li LO, Coleman RA. Rat long-chain acyl-CoA synthetase mRNA, protein, and activity vary in tissue distribution and in response to diet. J Lipid Res. 2006;47(9):2004-2010
33. Sandoval A, Fraisl P, Arias-Barrau E, Dirusso CC, Singer D, Sealls W, Black PN. Fatty acid transport and activation and the expression patterns of genes involved in fatty acid trafficking. Arch Biochem Biophys. 2008;477(2):363-371
34. Falcon A, Doege H, Fluitt A, Tsang B, Watson N, Kay MA, Stahl A. FATP2 is a hepatic fatty acid transporter and peroxisomal very long-chain acyl-CoA synthetase. Am J Physiol Endocrinol Metab. 2010;299(3):E384-393
35. Uchiyama A, Aoyama T, Kamijo K, Uchida Y, Kondo N, Orii T, Hashimoto T. Molecular cloning of cDNA encoding rat very long-chain acyl-CoA synthetase. J Biol Chem. 1996;271(48):30360-30365
36. Kim JH, Lewin TM, Coleman RA. Expression and characterization of recombinant rat Acyl-CoA synthetases 1, 4, and 5. Selective inhibition by triacsin C and thiazolidinediones. J Biol Chem. 2001;276(27):24667-24673
37. Ehehalt R, Keller P, Haass C, Thiele C, Simons K. Amyloidogenic processing of the Alzheimer beta-amyloid precursor protein depends on lipid rafts. J Cell Biol. 2003;160(1):113-123
38. Harder Z, Zunino R, McBride H. Sumo1 conjugates mitochondrial substrates and participates in mitochondrial fission. Curr Biol. 2004;14(4):340-345
39. Stremmel W, Berk PD. Hepatocellular influx of [14C]oleate reflects membrane transport rather than intracellular metabolism or binding. Proc Natl Acad Sci U S A. 1986;83(10):3086-3090
40. Ehehalt R, Jochims C, Lehmann WD, Erben G, Staffer S, Reininger C, Stremmel W. Evidence of luminal phosphatidylcholine secretion in rat ileum. Biochim Biophys Acta. 2004;1682(1-3):63-71
41. Ehehalt R, Krautter M, Zorn M, Sparla R, Fullekrug J, Kulaksiz H, Stremmel W. Increased basolateral sorting of carcinoembryonic antigen in a polarized colon carcinoma cell line after cholesterol depletion-Implications for treatment of inflammatory bowel disease. World J Gastroenterol. 2008;14(10):1528-1533
42. Tzircotis G, Thorne RF, Isacke CM. A new spreadsheet method for the analysis of bivariate flow cytometric data. BMC Cell Biol. 2004;5:10
43. Hall AM, Smith AJ, Bernlohr DA. Characterization of the Acyl-CoA synthetase activity of purified murine fatty acid transport protein 1. J Biol Chem. 2003;278(44):43008-43013
44. Rozen S, Skaletsky H. Primer3 on the WWW for general users and for biologist programmers. Methods Mol Biol. 2000;132:365-386
45. Heinzer AK, Kemp S, Lu JF, Watkins PA, Smith KD. Mouse very long-chain acyl-CoA synthetase in X-linked adrenoleukodystrophy. J Biol Chem. 2002;277(32):28765-28773
46. Steinberg SJ, Wang SJ, McGuinness MC, Watkins PA. Human liver-specific very-long-chain acyl-coenzyme A synthetase: cDNA cloning and characterization of a second enzymatically active protein. Mol Genet Metab. 1999;68(1):32-42
47. Lobo S, Wiczer BM, Smith AJ, Hall AM, Bernlohr DA. Fatty acid metabolism in adipocytes: functional analysis of fatty acid transport proteins 1 and 4. J Lipid Res. 2007;48(3):609-620
48. Lewin TM, Kim JH, Granger DA, Vance JE, Coleman RA. Acyl-CoA synthetase isoforms 1, 4, and 5 are present in different subcellular membranes in rat liver and can be inhibited independently. J Biol Chem. 2001;276(27):24674-24679
49. Li LO, Mashek DG, An J, Doughman SD, Newgard CB, Coleman RA. Overexpression of rat long chain acyl-coa synthetase 1 alters fatty acid metabolism in rat primary hepatocytes. J Biol Chem. 2006;281(48):37246-37255
50. Koonen DP, Jacobs RL, Febbraio M, Young ME, Soltys CL, Ong H, Vance DE, Dyck JR. Increased hepatic CD36 expression contributes to dyslipidemia associated with diet-induced obesity. Diabetes. 2007;56(12):2863-2871
51. Coleman RA, Lewin TM, Muoio DM. Physiological and nutritional regulation of enzymes of triacylglycerol synthesis. Annu Rev Nutr. 2000;20:77-103
52. Parkes HA, Preston E, Wilks D, Ballesteros M, Carpenter L, Wood L, Kraegen EW, Furler SM, Cooney GJ. Overexpression of acyl-CoA synthetase-1 increases lipid deposition in hepatic (HepG2) cells and rodent liver in vivo. Am J Physiol Endocrinol Metab. 2006;291(4):E737-744
53. Ellis JM, Li LO, Wu PC, Koves TR, Ilkayeva O, Stevens RD, Watkins SM, Muoio DM, Coleman RA. Adipose acyl-CoA synthetase-1 directs fatty acids toward beta-oxidation and is required for cold thermogenesis. Cell Metab. 2010;12(1):53-64
54. Blackburn C, Guan B, Brown J, Cullis C, Condon SM, Jenkins TJ, Peluso S, Ye Y, Gimeno RE, Punreddy S. et al. Identification and characterization of 4-aryl-3,4-dihydropyrimidin-2(1H)-ones as inhibitors of the fatty acid transporter FATP4. Bioorg Med Chem Lett. 2006;16(13):3504-3509
55. Ibrahimi A, Sfeir Z, Magharaie H, Amri EZ, Grimaldi P, Abumrad NA. Expression of the CD36 homolog (FAT) in fibroblast cells: effects on fatty acid transport. Proc Natl Acad Sci U S A. 1996;93(7):2646-2651
56. Febbraio M, Abumrad NA, Hajjar DP, Sharma K, Cheng W, Pearce SF, Silverstein RL. A null mutation in murine CD36 reveals an important role in fatty acid and lipoprotein metabolism. J Biol Chem. 1999;274(27):19055-19062
57. Bieghs V, Wouters K, van Gorp PJ, Gijbels MJ, de Winther MP, Binder CJ, Lutjohann D, Febbraio M, Moore KJ, van Bilsen M. et al. Role of scavenger receptor A and CD36 in diet-induced nonalcoholic steatohepatitis in hyperlipidemic mice. Gastroenterology. 2010;138(7):2477-2486
Author contact
![]() Corresponding author: Prof. Dr. med. Robert Ehehalt,Department of Gastroenterology, University Hospital Heidelberg, Im Neuenheimer Feld 410, 69120 Heidelberg; Robert.Ehehaltuni-heidelberg.de; Telephone: +49(0)62215638715, Fax: +49(0)6221565255.
Corresponding author: Prof. Dr. med. Robert Ehehalt,Department of Gastroenterology, University Hospital Heidelberg, Im Neuenheimer Feld 410, 69120 Heidelberg; Robert.Ehehaltuni-heidelberg.de; Telephone: +49(0)62215638715, Fax: +49(0)6221565255.