Impact Factor ISSN: 1449-1907

 Global reach, higher impact
Int J Med Sci 2011; 8(6):470-478. doi:10.7150/ijms.8.470 This issue Cite
Research Paper
The Relationship between Serum Uric Acid and Spirometric Values in Participants in a Health Check: The Takahata Study
Yasuko Aida1, Yoko Shibata1 ![]() , Daisuke Osaka1, Shuichi Abe1, Sumito Inoue1, Koji Fukuzaki1, Yoshikane Tokairin1, Akira Igarashi1, Keiko Yamauchi1, Takako Nemoto1, Keiko Nunomiya1, Hiroyuki Kishi1, Masamichi Sato1, Tetsu Watanabe1, Tsuneo Konta1, Sumio Kawata2, Takeo Kato3, Isao Kubota1
, Daisuke Osaka1, Shuichi Abe1, Sumito Inoue1, Koji Fukuzaki1, Yoshikane Tokairin1, Akira Igarashi1, Keiko Yamauchi1, Takako Nemoto1, Keiko Nunomiya1, Hiroyuki Kishi1, Masamichi Sato1, Tetsu Watanabe1, Tsuneo Konta1, Sumio Kawata2, Takeo Kato3, Isao Kubota1
1. Department of Cardiology, Pulmonology, and Nephrology, Yamagata University School of Medicine, Yamagata, Japan
2. Department of Gastroenterology, Yamagata University Hospital, Yamagata, Japan
3. Department of Neurology, Hematology, Metabolism, Endocrinology, and Diabetology, Yamagata University School of Medicine, Yamagata, Japan
Received 2011-5-10; Accepted 2011-7-25; Published 2011-8-5
Abstract
Background: Tissue hypoxia induces the degradation of adenosine triphosphate, resulting in the production of uric acid (UA). Patients with chronic obstructive pulmonary disease (COPD) have been reported to have high serum levels of UA (sUA), compared with control subjects. However, the relationship between sUA levels and spirometric measures has not been investigated in detail in a general population.
Methods: Subjects aged 40 years or older (n = 2,917), who had participated in a community-based annual health check in Takahata, Japan, in 2004 and 2005, were enrolled in the study. These subjects performed spirometry, their blood pressure was measured, and a blood sample was taken.
Results: sUA levels were significantly higher in males than in females. Percent predicted forced vital capacity [FVC %predicted] (r = -0.13) and forced expiratory volume in 1 s [FEV1 %predicted] (r = -0.118) were inversely correlated with sUA levels in females but not in males. Univariate regression analysis indicated that age, body mass index (BMI), ethanol intake, mean blood pressure (BP), and serum creatinine (sCr) were significantly associated with sUA levels in males. In females, age, BMI, mean BP, hemoglobin A1c, sCr, FVC %predicted, and FEV1 %predicted were significantly associated with sUA levels. Multiple linear regression analysis showed that for both genders, FVC %predicted and FEV1 %predicted were predictive for sUA levels, independently of the other clinical parameters. Subjects with lung restriction had higher sUA levels than subjects without lung restriction. In addition, subjects with moderate and severe airflow limitation had higher sUA levels than subjects without airflow limitation or those with mild airflow limitation.
Conclusion: FVC %predicted and FEV1 %predicted were significantly associated with sUA levels in a general population.
Keywords: uric acid, spirometry, pulmonary function, epidemiology
INTRODUCTION
Long-term cigarette smoking injures the respiratory system and causes pulmonary diseases such as chronic obstructive pulmonary disease (COPD). Even in healthy individuals, cigarette smoking induces oxidative stress and lung inflammation. As a result of damage to lung tissues induced by oxidants and inflammation, pulmonary function declines with long-term exposure to smoke (1,2). Impairment of pulmonary function reduces oxygen intake, resulting in tissue hypoxia.
Tissue hypoxia has been reported to induce the degradation of adenosine (3,4). This results in the release of purine intermediates and end products of purine catabolism, such as uric acid (UA) (5). Elevation of serum UA (sUA) levels has been observed in hypoxic subjects, including patients with COPD (6-8). However, sUA levels are also influenced by other clinical factors such as gender, body mass index (BMI), daily intake of alcohol, blood pressure (BP), and renal function, as indicated by serum creatinine (sCr) concentration (9-11).
Garcia-Larsen et al. performed a population-based investigation to examine the relationship between oxidative stress-related biomarkers, oxidant status and asthma and atopy in young adults aged 22-29 years. That study demonstrated that there was no relationship between plasma UA and lung function (12). However, these relationships were only investigated in a population of young adults, and the association between sUA levels and pulmonary function in the general population remains to be elucidated.
In this study, we examined the relationship between spirometric measures and sUA levels in a general population participating in an annual health check in Takahata, Japan.
METHODS
Study population
This study formed part of the Molecular Epidemiological Study, utilizing data from the Regional Characteristics of 21st Century Centers of Excellence (COE) Program and the Global COE Program in Japan. Details of the study methodology have been described elsewhere (2,13). The study was approved by the institutional ethics committee and all participants gave written informed consent.
This study utilized data from a community-based annual health check, in which all inhabitants of Takahata town (population 26,026) in northern Japan, who were aged 40 years or older, were invited to participate. This region has a resident population of 15,222 adults aged 40 years or older (7,109 males and 8,113 females). Since employees in public institutes and many companies are examined annually in the health check program organized by local health centers, they usually do not participate in the health checks organized by local government authorities such as Takahata town. The health checks organized by local government cover farmers, employees in smaller companies, self-employed persons, housewives, and retired persons. Four thousand two hundred and eighty-two adults aged 40 years or older participated in this health check program from June 2004 through November 2005, and 1,380 males and 1,735 females (a total of 3,165 subjects) agreed to be enrolled in the study. Two hundred and forty-eight subjects were excluded from the analysis because of unsatisfactory spirometry data that did not meet the Japanese Respiratory Society (JRS) criteria (14). Data for a total of 2,917 subjects (1,325 males, 1,592 females) was entered into the final statistical analysis (2). This study is a secondary analysis of previously published epidemiological data demonstrating an increased prevalence of airflow limitation among cigarette smokers from the same population (2).
Subjects used a self-report questionnaire to document their medical histories, smoking habits, current medications and clinical symptoms, with 2.2% of subjects reporting a history of respiratory disease. However, details of the respiratory diseases were not specified, because the question on history of respiratory disease only required a yes/no answer.
Measurements
Systolic and diastolic blood pressures (BPs) were measured using a mercury manometer placed on the right arm of subjects who had been resting in the sitting position for at least 5 min before the measurement. Measurements were performed twice, and mean BP was calculated as diastolic BP plus 0.33 x (systolic BP minus diastolic BP) (15). Fasting blood samples were taken from the antecubital vein and the blood was immediately transferred to chilled tubes.
Spirometric parameters [forced vital capacity (FVC) and forced expiratory volume in 1 s (FEV1)] were measured using standard techniques, with subjects performing FVC maneuvers on a CHESTAC-25 part II EX instrument (Chest Corp., Tokyo, Japan), according to the JRS guidelines (14). A bronchodilator was not administered prior to spirometry. The highest value from at least three FVC maneuvers by each subject was used in the analysis. Spirometry results were assessed by visual inspection of flow-volume curves by two pulmonary physicians, and data for subjects with unsatisfactory results, according to the JRS criteria, were excluded (14). The predictive equations described by Osaka et al. (2) were used, and percent predicted values for spirometric parameters are presented as FVC %predicted and FEV1 %predicted. Subjects with FEV1/FVC <70% were identified as having airflow limitation, and those with FVC %predicted <80% were identified as having lung restriction. According to the Global initiative for Chronic Obstructive Lung Disease (GOLD) criteria, subjects with airflow limitation and FEV1 %predicted ≥80 were identified as having mild air flow limitation, those with 50≤ FEV1 %predicted <80 were defined as having moderate air flow limitation, and those with FEV1 %predicted <50 were defined as having severe airflow limitation (1). In addition, subjects with lung restriction were divided into two groups: those with 70≤ FVC %predicted <80 and those with FVC %predicted <70. Those with FVC %predicted <70 constituted the lowest 2.5% percentile of all subjects in the study population.
Measurements of PaO2 by arterial blood gas analysis or of oxygen saturation by pulse oximetry were not performed in this health check program. Because this study was performed using data from the health check program, information on chest X-ray findings and the final diagnosis for each subject were not available.
Statistical analysis
Differences between two groups were analyzed using Student's t-test or the Mann-Whitney U test. Multiple comparisons were performed using non-parametric one way analysis of variance (Kruskal-Wallis test) followed by the Student-Newman-Keuls test. These analyses, as well as regression analyses and logistic regression analyses, were performed using SigmaPlot version 11 computer software (Systat Software, Inc., San Jose, CA, USA) and JMP version 8 software (SAS Institute Inc., Cary, NC, USA). Data in the figures are means ± SD. Significance was inferred for differences with P values <0.05.
RESULTS
The characteristics of the subjects are summarized according to gender in Table 1. Age, smoking index, daily intake of ethanol, mean BP, sCr and sUA levels were significantly higher in male than in female subjects. In contrast, BMI and hemoglobin A1c (HbA1c) concentration did not differ significantly between males and females. FVC %predicted and FEV1 %predicted were significantly lower in males than in females. FVC %predicted was weakly but significantly associated with BMI (r =0.07, P =0.008), smoking index (r =-0.14, P <0.0001), ethanol consumption (r =0.06, P =0.044), mean BP (r =0.06, P =0.019), and HbA1c (r =-0.09, P =0.001) in male subjects. In females, FVC %predicted was weakly but significantly associated with mean BP (r =-0.07, P =0.006), HbA1c (r =-0.06, P =0.012) and sCr (r =-0.05, P =0.029). FEV1 %predicted was weakly but significantly associated with age (r =-0.11, P <0.0001), BMI (r =0.13, P <0.0001), smoking index (r =-0.20, P <0.0001), and mean BP (r =0.06, P =0.043) in male subjects. In females, FEV1 %predicted was weakly but significantly associated with smoking index (r =-0.05, P =0.034) and mean BP (r =-0.05, P =0.044).
Differences in the characteristics of male and female subjects
| All subjects (n=2917) | Males (n=1325) | Females (n=1592) |
|---|---|---|
| Age, years | 63.2 ± 10.3 | 62.5 ± 10.1* |
| BMI, kg/m2 | 23.5 ± 3.0 | 23.6 ± 3.4 |
| Smoking index | 279.4 ± 406.0 | 13.6 ± 77.5** |
| Ethanol intake, g/day | 23.2 ± 22.5 | 2.5 ± 8.0** |
| Mean BP, mm Hg | 99.8 ± 11.0 | 95.6 ± 10.9** |
| HbA1C, % | 5.2 ± 0.8 | 5.2 ± 0.6 |
| sCr, mg/dL | 0.78 ± 0.27 | 0.59 ± 0.11** |
| Uric acid, mg/dL | 5.8 ± 1.3 | 4.5 ± 1.1** |
| FVC %predicted | 97.6 ± 14.7 | 100.2 ± 14.4** |
| FEV1 %predicted | 95.7 ± 17.5 | 99.9 ± 15.6** |
Differences in smoking index and ethanol intake between males and females were assessed for statistical significance using the Mann-Whitney U test.
Data are mean ± SD. *P <0.05 compared with male subjects, **P <0.001 compared with male subjects.
Smoking index = daily consumption of cigarettes x years of smoking
Ethanol intake = grams of ethanol consumed per day
Mean BP = diastolic BP + (average systolic BP - average diastolic BP)/3
BMI, body mass index; BP, blood pressure; HbA1c, hemoglobin A1c; sCr, serum creatinine; FVC %predicted, percent predicted forced vital capacity; FEV1 %predicted, percent predicted forced expiratory volume in 1 s
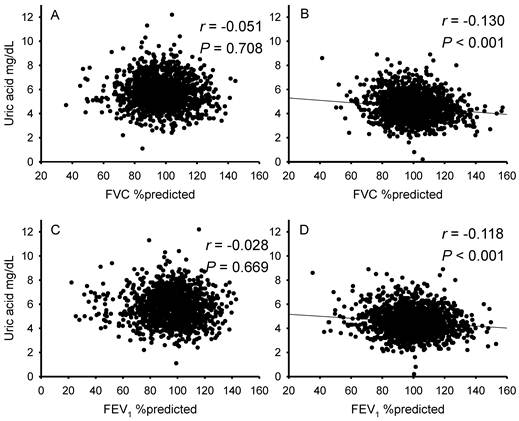
Figure 1 shows the relationships between spirometric parameters and sUA levels. In males, FVC %predicted and FEV1 %predicted were not significantly associated with sUA (Fig. 1A & 1C). However, in females, there were inverse relationships between these spirometric parameters and sUA levels (Fig. 1B & 1D).
Correlations between spirometric parameters and serum uric acid levels in males and females. Graphs show the relationships of FVC %predicted (A & B) and FEV1 %predicted (C & D) with serum uric acid in males (A & C) and females (B & D). In males, FVC %predicted and FEV1 %predicted were not significantly associated with serum uric acid levels (A & C). However, in females, there were inverse relationships between these spirometric parameters and serum uric acid levels (B & D).
Univariate regression analysis demonstrated that in male subjects, age, BMI, daily ethanol intake, mean BP, and sCr were significantly associated with sUA levels (Table 2A). In females, age, BMI, mean BP, HbA1c, sCr, FVC %predicted and FEV1 %predicted were significantly associated with sUA levels (Table 2A). Multiple linear regression analysis was performed to assess whether these spirometric parameters were independently associated with sUA levels. Because FVC %predicted and FEV1 %predicted were strongly correlated (r = 0.847, P <0.0001), these parameters were assessed separately to avoid confounding (Table 2B & 2C). As shown in Table 2, FVC %predicted and FEV1 %predicted were predictive for sUA levels, independently of age, BMI, smoking index, daily ethanol intake, mean BP, HbA1c and sCr, both in males and females. We also examined if pulmonary dysfunction was an independent risk factor for hyperuricemia (sUA >7 mg/dL), independently of age, BMI, smoking index, daily ethanol intake, mean BP, HbA1c and sCr, using multiple logistic analysis. As shown in Table 3, FVC %predicted was predictive for hyperuricemia, independently of these factors in female (P =0.002), not in males (P =0.075). FEV1 %predicted was predictive for hyperuricemia, independently of these factors in both genders (male: P =0.002, females: P <0.001).
Univariate and multivariate regression analyses to identify factors that were predictive for serum uric acid levels
| Males | Females | ||||||
|---|---|---|---|---|---|---|---|
| Coefficient | SE | P value | Coefficient | SE | P value | ||
| A. Univariate regression analysis | |||||||
| Age, years | -0.019 | 0.003 | <.0001 | 0.014 | 0.003 | <.0001 | |
| BMI, kg/m2 | 0.090 | 0.012 | <.0001 | 0.079 | 0.008 | <.0001 | |
| Smoking index | 0.000 | 0.000 | 0.082 | 0.000 | 0.000 | 0.779 | |
| Ethanol intake, g/day | 0.006 | 0.002 | <.0001 | 0.000 | 0.003 | 0.974 | |
| Mean BP, mmHg | 0.013 | 0.003 | <.0001 | 0.016 | 0.002 | <.0001 | |
| HbA1c, % | -0.053 | 0.047 | 0.261 | 0.243 | 0.045 | <.0001 | |
| sCr, mg/dL | 1.237 | 0.125 | <.0001 | 3.080 | 0.225 | <.0001 | |
| FVC %predicted | -0.004 | 0.002 | 0.064 | -0.010 | 0.002 | <.0001 | |
| FEV1 %predicted | -0.002 | 0.002 | 0.305 | -0.008 | 0.002 | <.0001 | |
| B. Multivariate regression analysis, model 1 | |||||||
| Age, years | -0.016 | 0.003 | <.0001 | 0.006 | 0.003 | 0.019 | |
| BMI, kg/m2 | 0.076 | 0.012 | <.0001 | 0.061 | 0.008 | <.0001 | |
| Smoking index | 0.000 | 0.000 | 0.111 | 0.000 | 0.000 | 0.640 | |
| Ethanol intake, g/day | 0.005 | 0.002 | 0.000 | 0.007 | 0.003 | 0.027 | |
| Mean BP, mmHg | 0.007 | 0.003 | 0.018 | 0.008 | 0.002 | 0.001 | |
| HbA1c, % | -0.077 | 0.045 | 0.086 | 0.142 | 0.042 | 0.001 | |
| sCr, mg/dL | 1.297 | 0.121 | <.0001 | 2.947 | 0.217 | <.0001 | |
| FVC %predicted | -0.006 | 0.002 | 0.009 | -0.007 | 0.002 | <.0001 | |
| C. Multivariate regression analysis, model 2 | |||||||
| Age, years | -0.016 | 0.003 | <.0001 | 0.006 | 0.003 | 0.021 | |
| BMI, kg/m2 | 0.076 | 0.012 | <.0001 | 0.062 | 0.008 | <.0001 | |
| Smoking index | 0.000 | 0.000 | 0.136 | 0.000 | 0.000 | 0.674 | |
| Ethanol intake, g/day | 0.005 | 0.002 | 0.001 | 0.007 | 0.003 | 0.035 | |
| Mean BP, mmHg | 0.007 | 0.003 | 0.020 | 0.008 | 0.002 | 0.001 | |
| HbA1c, % | -0.070 | 0.045 | 0.119 | 0.143 | 0.042 | 0.001 | |
| sCr, mg/dL | 1.297 | 0.121 | <.0001 | 2.963 | 0.216 | <.0001 | |
| FEV1 %predicted | -0.004 | 0.002 | 0.030 | -0.007 | 0.002 | <.0001 | |
BMI, body mass index; BP, blood pressure; HbA1c, hemoglobin A1c; sCr, serum creatinine; FVC %predicted, percent predicted forced vital capacity; FEV1 %predicted, percent predicted forced expiratory volume in 1 s
Multiple logistic analyses to identify factors that were predictive for hyperuricemia (serum uric acid >7.0 mg/dL)
| Males | Females | ||||||||
|---|---|---|---|---|---|---|---|---|---|
| OR | 95% CI | P | OR | 95% CI | P | ||||
| A. Model 1 | |||||||||
| Age (per 1 year increase) | 0.975 | (0.962, | 0.988) | 0.000 | 1.039 | (1.008, | 1.072) | 0.014 | |
| BMI (per 1 kg/m2 increase) | 1.117 | (1.066, | 1.172) | <.0001 | 1.128 | (1.042, | 1.223) | 0.003 | |
| Smoking index (per 1 cig/y increase) | 1.000 | (1.000, | 1.000) | 0.750 | - | - | |||
| Ethanol intake (per 1 g/day increase) | 1.011 | (1.005, | 1.017) | 0.000 | 1.014 | (0.966, | 1.046) | 0.494 | |
| mean BP (per 1 mmHg increase) | 1.018 | (1.006, | 1.031) | 0.004 | 1.012 | (0.985, | 1.039) | 0.384 | |
| HbA1C (per 1 % increase) | 0.930 | (0.760, | 1.123) | 0.461 | 1.306 | (0.863, | 1.838) | 0.198 | |
| sCr (per 0.1 mg/dL increase) | 6.139 | (2.324, | 16.851) | <.0001 | 20.703 | (3.167, | 165.303) | <.0001 | |
| FVC % predicted (per 1% increase) | 0.991 | (0.982, | 1.001) | 0.075 | 0.970 | (0.952, | 0.989) | 0.002 | |
| B. Model 2 | |||||||||
| Age (per 1 year increase) | 0.973 | (0.960, | 0.987) | <.0001 | 1.039 | (1.007, | 1.073) | 0.016 | |
| BMI (per 1 kg/m2 increase) | 1.120 | (1.068, | 1.175) | <.0001 | 1.131 | (1.045, | 1.226) | 0.002 | |
| Smoking index (per 1 cig*y increase) | 1.000 | (1.000, | 1.000) | 0.881 | - | - | |||
| Ethanol intake (per 1 g/day increase) | 1.011 | (1.005, | 1.017) | 0.000 | 1.013 | (0.966, | 1.045) | 0.518 | |
| mean BP (per 1 mmHg increase) | 1.019 | (1.006, | 1.032) | 0.004 | 1.014 | (0.987, | 1.041) | 0.316 | |
| HbA1C (per 1 % increase) | 0.937 | (0.766, | 1.130) | 0.506 | 1.329 | (0.880, | 1.864) | 0.169 | |
| sCr (per 0.1 mg/dL increase) | 6.374 | (2.411, | 17.515) | <.0001 | 23.081 | (3.464, | 185.534) | <.0001 | |
| FEV1 % predicted (per 1% increase) | 0.991 | (0.983, | 1.000) | 0.038 | 0.970 | (0.954, | 0.986) | <.001 | |
In females, OR and 95% CI for smoking index could not be obtained by the analyses using the computer software.
BMI, body mass index; BP, blood pressure; HbA1c, hemoglobin A1c; sCr, serum creatinine; FVC %predicted, percent predicted forced vital capacity; FEV1 %predicted, percent predicted forced expiratory volume in 1 s; OR, odds ratio; CI, confidence interval
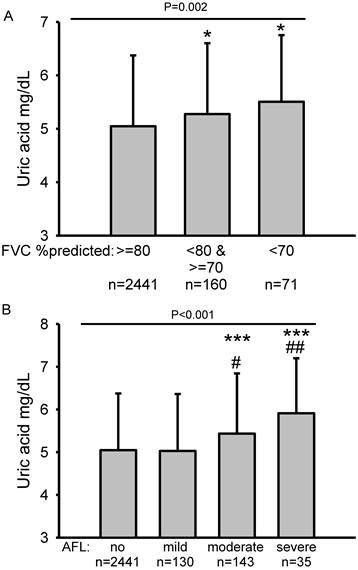
Elevation of sUA levels according to the degree of impairment of pulmonary function was also investigated. Subjects were categorized according to their FVC %predicted and FEV1 %predicted values (Fig. 2). To avoid using data for the subjects with airflow limitation and lung restriction from the referent group, those subjects were excluded from the analyses. Subjects with lung restriction [FVC %predicted <70, and 70≤ FVC %predicted <80] had higher sUA levels than subjects without lung restriction [FVC %predicted ≥80] (Fig. 2A). Subjects with moderate or severe airflow limitation had higher sUA levels than subjects without airflow limitation or those with mild airflow limitation (Fig. 2B).
Serum uric acid levels according to degree of lung restriction and airflow limitation. Subjects were categorized into three groups according to degree of lung restriction: FVC %predicted ≥80, 70≤ FVC %predicted <80, and FVC %predicted <70. Subjects were categorized as having airflow limitation if FEV1/FVC was <0.7, according to the Global Initiative for Obstructive Lung Disease (GOLD) criteria. Airflow limitation was classified as mild if FEV1 %predicted was ≥80, moderate if 50≤ FEV1 %predicted was <80 and severe if FEV1 %predicted was <50. To avoid using data for subjects with airflow limitation and lung restriction from the referent group, those subjects were excluded from the analyses shown in (A) and (B). Subjects with lung restriction [FVC %predicted <70, and 70≤ FVC %predicted <80] had higher serum uric acid levels than subjects without lung restriction [FVC %predicted ≥80] (A). Subjects with moderate or severe airflow limitation had higher serum uric acid levels than subjects without airflow limitation or those with mild airflow limitation (B). Statistical comparisons were performed by ANOVA followed by the Student-Newman-Keuls test. *P < 0.05 compared with FVC %predicted ≥ 80, ***P < 0.001 compared with no airflow limitation, #P < 0.05 compared with mild airflow limitation, ##P < 0.01 compared with mild airflow limitation.
DISCUSSION
This study demonstrated that there were significant inverse correlations between spirometric parameters (FVC %predicted, r =-0.130; FEV1 %predicted, r =-0.118) and sUA levels in female subjects who participated in an annual health check. Although these univariate correlations were not observed for male subjects, multiple linear regression analysis revealed that FVC %predicted and FEV1 %predicted were significant predictive factors for sUA levels, independently of age, BMI, smoking index, daily ethanol intake, mean BP, HbA1c and sCr, not only in females but also in males. Multiple logistic analysis revealed that FVC %predicted in females and FEV1 %predicted in both genders were significant predictive for hyperuricemia. Therefore, we concluded that there were significant associations between spirometric measures and sUA levels in the Japanese general population.
UA is the end-product of purine degradation (16). Excessive intake of foods containing purine bases (17), alcohol consumption (18), renal dysfunction (19), and genetic disorders of purine metabolism, such as hypoxanthine-guanine phosphoribosyltransferase deficiency (Lesch-Nyhan syndrome) (20) and adenine phosphoribosyltransferase deficiency (21), result in elevation of sUA levels. In addition, other demographic and clinical factors, such as gender, BMI, smoking index, BP and serum glucose levels, are known to be associated with serum levels of UA (9-11). Therefore, careful consideration of these factors is required when assessing the relationship between pulmonary function and UA levels.
UA is a biomarker of xanthine oxidase activity, which is known to be an important source of reactive oxygen species (22,23). Several investigators have reported that elevated UA levels were associated with worsening of cardiovascular disease, heart failure and COPD (6,24-26). In Japanese patients receiving home oxygen therapy, mortality was reportedly high among those with high sUA levels (27). In addition, positive associations were demonstrated between UA and inflammatory markers such as C-reactive protein and interleukin-6 (28). These findings suggest that systemic UA levels are associated with oxidative stress and inflammation in vivo. UA activates leukocytes through the NALP3 inflammasome (29). Activated leukocytes express selectins and adhere to endothelial cells, where they secrete various pro-inflammatory cytokines and chemical mediators, resulting in vessel wall damage and atherosclerosis.
In contrast to these cytotoxic properties, UA is known to be involved in the elimination of reactive oxygen species (ROS) (30,31). Therefore, UA appears to function as a double-edged sword in vivo. While UA is a pro-inflammatory molecule for endothelial cells, it functions as a powerful antioxidant in the upper airways (32). Indeed, patients with hypouricemia due to a genetic disorder affecting uric acid transporter 1 sometimes experience acute renal failure after strenuous exercise (33). The mechanism of renal dysfunction after exercise is thought to involve a reduced capacity for eliminating ROS (34,35). Therefore, the roles of UA in vivo are not simple due to this dual function. The crystalline form of UA is reported to be a strong inducer of inflammation, and hyperuricemia contributes to the formation of UA crystals (29). Thus, there may be optimal levels of UA to ensure homeostasis of ROS levels in mammalian tissues.
Possible explanations for the association between sUA levels and pulmonary function, as identified in the present study are 1) that hypoxia in subjects with impaired pulmonary function induces the production of UA, 2) that impaired pulmonary function induces pulmonary hypertension, resulting in the elevation of sUA levels, 3) that oxidative stress and inflammation induce lung tissue damage, resulting in the elevation of UA levels, or conversely, 4) that elevated levels of UA cause systemic inflammation, which eventually results in impairment of pulmonary function.
First, UA levels have been shown to be increased in hypoxic states. Elsayed et al. demonstrated that experimentally-induced hypoxia resulted in substantially higher UA concentrations in lung perfusate and lung tissues of animals, as compared with either normoxia or hyperoxia (5). Therefore, it has been suggested that pulmonary hypoxia promotes purine catabolism, leading to increased production of UA. Unfortunately, measurements of PaO2 or oxygen saturation were not performed in the health check program, and this was not a hospital-based clinical research study. Although the lack of this data is a limitation of the present study, multiple linear regression analysis revealed that pulmonary function was a significant determinant of serum UA levels, independently of age, gender, BMI, smoking index, alcohol consumption, BP, glucose levels, and renal function. However, it is still open to question whether low grade hypoxia, as observed in a general population, can affect serum UA levels, because in this study, the percentage of subjects with severe impairment of pulmonary function was not high.
Second, subjects with reduced pulmonary function may have elevated pulmonary arterial pressure. In patients with COPD, pulmonary hypertension is sometimes induced by loss of pulmonary vasculature and hypoxic vascular contraction. In some fibrosing lung diseases, impaired functioning of the pulmonary vasculature frequently causes pulmonary hypertension (36). Voelkel et al. reported an association between UA levels and pulmonary arterial pressure (37). This alteration of hemodynamics may elevate sUA levels. However, pulmonary arterial pressure was not measured in this study population.
Third, cigarette smoke is an important risk factor for many lung diseases, including COPD and pulmonary fibrosis. As cigarette smoke contains many toxic and highly oxidative compounds, oxidative stress is increased in the alveolar spaces of the lungs of smokers, due to the formation of ROS such as superoxide anion and hydrogen peroxide by alveolar macrophages (38-40). This oxidative stress induces lung inflammation, and eventually causes remodeling of the airways as a result of tissue damage. Chronic pulmonary inflammation and elevated oxidative stress in the alveolar spaces contribute to the pathogenesis of chronic respiratory diseases, such as COPD and pulmonary fibrosis, and cause chronic damage to the lung structure. sUA levels may be elevated according to the severity of tissue damage, as has been observed in tumor lysis syndrome (41). Therefore, in subjects with high levels of lung oxidative stress and inflammation, circulating UA levels may be elevated as a result of lung tissue damage.
Fourth, accumulating evidence suggests that hyperuricemia is a risk factor for cardiovascular disease (24,25). Hyperuricemia results in the production of UA crystals that precipitate in the joints and kidney tissues. Despite its anti-oxidative characteristics, UA activates leukocytes through the NALP3 inflammasome (29). Subsequently, activated leukocytes cause damage to vascular endothelial cells. As demonstrated by other investigators, as well as our studies, pulmonary endothelial dysfunction is involved in the pathogenesis of COPD (42,43). Therefore, hyperuricemia-induced endothelial dysfunction is possibly associated with impaired pulmonary function in the general population.
Twenty-eight percent of adults aged 40 years or older received health examinations organized by the Takahata local government, and 74% of these subjects were enrolled in this study. However, workers in public institutes and many companies did not participate in this research for the reasons described in the Methods. Differences in employment, socio-economic status or life style between participants and non-participants may result in sampling bias. Unfortunately, personal information regarding employment, annual income or details of life style were not available for these subjects. Therefore, further analyses could not be performed, which was a limitation of the present study.
In conclusion, FVC %predicted and FEV1 %predicted were significantly associated with sUA levels in a general population. Further investigations are required to clarify the mechanisms underlying this association between serum UA levels and pulmonary function.
Acknowledgements
We thank Taiko Aita and Eiji Tsuchida for their excellent technical assistance.
Funding: This study was supported by a grant-in-aid from the Global COE program of the Japan Society for the Promotion of Science, and grants-in-aid for Scientific Research from the Ministry of Education, Culture, Sports, Science and Technology, Japan (19590880, 20590892, and 23390220).
Conflict of Interest
The authors have declared that no conflict of interest exists.
References
1. Global strategy for the diagnosis, management and prevention of chronic obstructive pulmonary disease. Global Initiative for Chronic Obstructive Lung Disease. http://www.goldcopd.org/
2. Osaka D, Shibata Y, Abe S. et al. Relationship between habit of cigarette smoking and airflow limitation in healthy Japanese individuals: The Takahata Study. Intern Med. 2010;49:1489-1499
3. Mentzer RMJr, Rubio R, Berne RM. Release of adenosine by hypoxic canine lung tissue and its possible role in pulmonary circulation. Am J Physiol. 1975;229:1625-1631
4. Woolliscroft JO, Colfer H, Fox IH. Hyperuricemia in acute illness: A poor prognostic sign. Am J Med. 1982;72:58-62
5. Elsayed NM, Nakashima JM, Postlethwait EM. Measurement of uric acid as a marker of oxygen tension in the lung. Arch Biochem Biophys. 1993;302:228-232
6. Garcia-Pachon E, Padilla-Navas I, Shum C. Serum uric acid to creatinine ratio in patients with chronic obstructive pulmonary disease. Lung. 2007;185:21-24
7. Saito H, Nishimura M, Shibuya E. et al. Tissue hypoxia in sleep apnea syndrome assessed by uric acid and adenosine. Chest. 2002;122:1686-1694
8. Shimizu Y, Nagaya N, Satoh T. et al. Serum uric acid level increases in proportion to the severity of pulmonary thromboembolism. Circ J. 2002;66:571-575
9. Conen D, Wietlisbach V, Bovet P. et al. Prevalence of hyperuricemia and relation of serum uric acid with cardiovascular risk factors in a developing country. BMC Public Health. 2004;4:9
10. Nan H, Qiao Q, Soderberg S. et al. Serum uric acid and components of the metabolic syndrome in non-diabetic populations in Mauritian Indians and Creoles and in Chinese in Qingdao, China. Metab Syndr Relat Disord. 2008;6:47-57
11. Rathmann W, Haastert B, Icks A. et al. Ten-year change in serum uric acid and its relation to changes in other metabolic risk factors in young black and white adults: The cardia study. Eur J Epidemiol. 2007;22:439-445
12. Garcia-Larsen V, Chinn S, Rodrigo R. et al. Relationship between oxidative stress-related biomarkers and antioxidant status with asthma and atopy in young adults: A population-based study. Clin Exp Allergy. 2009;39:379-386
13. Konta T, Hao Z, Abiko H. et al. Prevalence and risk factor analysis of microalbuminuria in Japanese general population: The Takahata Study. Kidney Int. 2006;70:751-756
14. The Committee of Pulmonary Physiology JRS. Guidelines for pulmonary function tests: Spirometry, flow-volume curve, diffusion capacity of the lung. Tokyo. 2004
15. Zheng L, Sun Z, Li J. et al. Pulse pressure and mean arterial pressure in relation to ischemic stroke among patients with uncontrolled hypertension in rural areas of China. Stroke. 2008;39:1932-1937
16. So A, Thorens B. Uric acid transport and disease. J Clin Invest. 2010;120:1791-1799
17. Choi HK, Liu S, Curhan G. Intake of purine-rich foods, protein, and dairy products and relationship to serum levels of uric acid: The third national health and nutrition examination survey. Arthritis Rheum. 2005;52:283-289
18. Choi HK, Curhan G. Beer, liquor, and wine consumption and serum uric acid level: The third national health and nutrition examination survey. Arthritis Rheum. 2004;51:1023-1029
19. Feig DI. Uric acid: A novel mediator and marker of risk in chronic kidney disease? Curr Opin Nephrol Hypertens. 2009;18:526-530
20. Nyhan WL. Lesch-Nyhan disease. J Hist Neurosci. 2005;14:1-10
21. Cameron JS, Moro F, Simmonds HA. Gout, uric acid and purine metabolism in paediatric nephrology. Pediatr Nephrol. 1993;7:105-118
22. McCord JM, Roy RS, Schaffer SW. Free radicals and myocardial ischemia. The role of xanthine oxidase. Adv Myocardiol. 1985;5:183-189
23. Sjodin B, Hellsten Westing Y, Apple FS. Biochemical mechanisms for oxygen free radical formation during exercise. Sports Med. 1990;10:236-254
24. Anker SD, Doehner W, Rauchhaus M. et al. Uric acid and survival in chronic heart failure: Validation and application in metabolic, functional, and hemodynamic staging. Circulation. 2003;107:1991-1997
25. Holme I, Aastveit AH, Hammar N. et al. Uric acid and risk of myocardial infarction, stroke and congestive heart failure in 417,734 men and women in the apolipoprotein mortality risk study (AMORIS). J Intern Med. 2009;266:558-570
26. Obermayr RP, Temml C, Gutjahr G. et al. Elevated uric acid increases the risk for kidney disease. J Am Soc Nephrol. 2008;19:2407-2413
27. Sato N, Kurashima K, Ubukata M. et al. [Prognostic significance of serum uric acid in patients with chronic obstructive pulmonary disease receiving home oxygen therapy]. Nihon Kokyuki Gakkai Zasshi. 2003;41:74-80
28. Ruggiero C, Cherubini A, Miller E 3rd. et al. Usefulness of uric acid to predict changes in C-reactive protein and interleukin-6 in 3-year period in Italians aged 21 to 98 years. Am J Cardiol. 2007;100:115-121
29. Martinon F, Petrilli V, Mayor A. et al. Gout-associated uric acid crystals activate the NALP3 inflammasome. Nature. 2006;440:237-241
30. Becker BF, Reinholz N, Leipert B. et al. Role of uric acid as an endogenous radical scavenger and antioxidant. Chest. 1991;100:176S-181S
31. Kirschvink N, Fievez L, Bureau F. et al. Adaptation to multiday ozone exposure is associated with a sustained increase of bronchoalveolar uric acid. Free Radic Res. 2002;36:23-32
32. Cross CE, van der Vliet A, O'Neill CA. et al. Oxidants, antioxidants, and respiratory tract lining fluids. Environ Health Perspect. 1994;102(Suppl 10):185-191
33. Sperling O. Hereditary renal hypouricemia. Mol Genet Metab. 2006;89:14-18
34. Kaneko K, Taniguchi N, Tanabe Y. et al. Oxidative imbalance in idiopathic renal hypouricemia. Pediatr Nephrol. 2009;24:869-871
35. Tanaka M, Itoh K, Matsushita K. et al. Two male siblings with hereditary renal hypouricemia and exercise-induced ARF. Am J Kidney Dis. 2003;42:1287-1292
36. Ryu JH, Krowka MJ, Pellikka PA. et al. Pulmonary hypertension in patients with interstitial lung diseases. Mayo Clin Proc. 2007;82:342-350
37. Voelkel MA, Wynne KM, Badesch DB. et al. Hyperuricemia in severe pulmonary hypertension. Chest. 2000;117:19-24
38. Didilescu AC, Hanganu SC, Galie N. et al. [The role of smoking in changing essential parameters in body homeostasis]. Pneumologia. 2009;58:89-94
39. El-Agha O, Gokmen IG. Smoking habits and cadmium intake in Turkey. Biol Trace Elem Res. 2002;88:31-43
40. Rahman I, MacNee W. Role of oxidants/antioxidants in smoking-induced lung diseases. Free Radic Biol Med. 1996;21:669-681
41. Jeha S. Tumor lysis syndrome. Semin Hematol. 2001;38:4-8
42. Arao T, Takabatake N, Sata M. et al. In vivo evidence of endothelial injury in chronic obstructive pulmonary disease by lung scintigraphic assessment of (123)I-metaiodobenzylguanidine. J Nucl Med. 2003;44:1747-1754
43. Tuder RM, Zhen L, Cho CY. et al. Oxidative stress and apoptosis interact and cause emphysema due to vascular endothelial growth factor receptor blockade. Am J Respir Cell Mol Biol. 2003;29:88-97
Author contact
![]() Corresponding author: Dr. Yoko Shibata, 2-2-2 Iida-Nishi, Yamagata City, Yamagata 990-9585, Japan. Tel.: +81-23-628-5302; Fax: +81-23-628-5305; Email: shibataid.yamagata-u.ac.jp
Corresponding author: Dr. Yoko Shibata, 2-2-2 Iida-Nishi, Yamagata City, Yamagata 990-9585, Japan. Tel.: +81-23-628-5302; Fax: +81-23-628-5305; Email: shibataid.yamagata-u.ac.jp